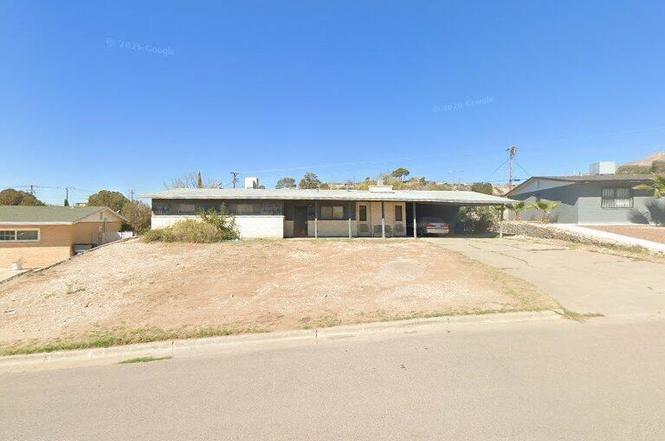
4318 Larchmont Dr · El Paso, TX
Flood risk 1/10 · Minimal
- FEMA flood zone
- X
- Chance of flooding over 30 yrs
- 0.0%
- Est. flood insurance / yr
- $507 – $1,088
Fire risk 1/10 · Minimal
- Est. fire insurance / yr
- $1,222 – $2,270
Heat risk 6/10 · Moderate
- Hot days now (above 100°F)
- 6 days/yr
- Hot days in 30 yrs
- 21 days/yr
Wind risk 1/10 · Minimal
- Chance of severe wind over 30 yrs
- —
Air-quality risk 2/10 · Minimal
- Unhealthy air days now
- 1 days/yr
- Unhealthy air days in 30 yrs
- 1 days/yr
Risk factors via First Street. Map © Google.
Why this score? — see what drove the B grade
The composite is a weighted blend of 9 inputs, each scored 0–100. Each bar is that input's sub-score; the figure is the points it added to the 100-point composite (weight × sub-score).
- Cash flow +30.0/30.0
- 1% rule +10.0/10.0
- DSCR +10.0/10.0
- ARV discount +7.5/15.0
- Livability +4.0/5.0
- Rent growth +3.8/5.0
- Schools +2.7/10.0
- Condition / age +2.5/5.0
- Appreciation +0.0/10.0
$99,000
🖨 Deal sheet 📄 Offer letter ✓ Due diligence
Listing remarks
Property to be sold ''As Is''. Great opportunity
Key facts
- 0.24 acre lot
- Built 1955
Neighborhood map
What this means for you Summary
Snapshot
- This is a 3-bed/3.0-bath single-family listed at $99k.
Deal economics
- At list price, monthly cash flow is $863 ($10k/yr) — positive.
- The deal already cash-flows at list — no discount required.
- Meets the 1% rule at list price ($2k rent vs $99k).
Location & tenants
- Location reads 81/100 on livability (#23 in TX, #1,375 nationally) — a professional / high-income tenant draw. Strengths: commute A+, cost of living A+, housing A+; Watch: employment D+.
- El Paso ISD (urban): math 27% / reading 37% proficiency, ranked #591 of 826 in TX (top 72%) — families likely to look elsewhere, expect single-tenant / working-renter base with shorter leases; 65% free/reduced lunch — lower-income household profile, screen leases tightly.
- Zoned schools: Mesita El (math 27% / reading 52%, grade F, #1,545 of 4,322 statewide, top 38%, 940 students, 69% FRL); Wiggs Middle (math 47% / reading 46%, grade D+, #443 of 1,662 statewide, top 28%, 861 students, 72% FRL).
- Market conditions: Rents rising fast (+5.2%/yr); 118 active listings in the ZIP; 14 comparable units currently listed for rent nearby; rentals at typical pace (median 24d on market — plan ~3-4 weeks tenant-placement turnaround); 43% of comp listings sitting > 30 days — soft ceiling on asking rent; 2,196 units permitted in El Paso County in 2024 (143 in 5+ unit buildings).
- At $1,958/mo this rent would consume 46% of the median local household income ($51k/yr) (locally 1380% of renters already pay >50% of income on rent) — very limited rent-growth headroom before tenants either downsize or default.
Forward outlook
- Local home prices are declining (-3.0%/yr); year-one equity from $684 of loan paydown is wiped out by about $3k of value loss. Plan a longer hold.
- El Paso County population projected at +10% by 2050 — modest demand growth; plan on rents tracking national, not racing it.
- At projected returns (-3.0% appreciation + 5.2% rent growth), your $28k cash investment doubles in ~4 years — after that, you're playing with house money.
Negotiation context
- Only 0 days on market — expect competitive offers; lowballing is unlikely to land.
Risks & watch-outs
- Watch-outs: built in 1955 — expect roof / HVAC / electrical / plumbing capex.
- Climate carrying-cost: extreme-heat days projected 6→21/yr by 2055 (HVAC capex compounding) — expect insurance premiums to compound above CPI over the hold.
Questions for the listing agent
- Built in 1955 — when were the roof, HVAC, electrical panel, plumbing, and water heater last replaced?
- Is there a deadline driving the sale (1031 exchange, divorce, estate, relocation)? That informs how much negotiation room exists.
- Schools are B-rated — typically a magnet for longer-tenancy family renters. What's the average tenant stay here, and is there a school-zone premium baked into asking?
- What's the average days-on-market for RENTAL listings here right now (not sales)? A rising rental-DOM trend means longer vacancies and softer asking-rent achievability than the comps imply.
- What's the recent tenant-quality profile in this submarket — average credit score on applications, eviction rate, late-payment / NSF rate, and stable-employment percentage? A property-management company in the area should have these aggregated.
- How much new for-sale + rental construction is in the pipeline within 1–3 miles? Heavy new supply typically softens prices + rents 12–24 months out; constrained supply supports both.
Investment metrics
- 1% rule
- 1.98% ✓
- Cap rate
- 16.75%
- Cash-on-cash
- 37.34%
- DSCR
- 2.66
- GRM
- 4.2
CMA / ARV
No comps found within radius.
Projected returns pro-forma
-3.0% appreciation · 5.25% rent growth · sell at horizon
- IRR
- 35.8%
- Equity multiple
- 2.57×
- Total profit
- $43,455
- Equity at exit
- $14,761
- IRR
- 43.7%
- Equity multiple
- 5.62×
- Total profit
- $128,172
- Equity at exit
- $8,560
Cash invested: $27,720 (down + closing). Projections, not guarantees.
Landlord ↔ Tenant lean methodology
- Overall (STATE)
- 87 Strongly Landlord-Friendly
- State Texas
- 87 Strongly Landlord-Friendly · R+5
- County
- — inherits STATE
- City
- — inherits STATE
ZIP-level market 79902
- Home prices YoY
- -23.1%
- Rents YoY
- 5.2%
- Active inventory
- 118
- Price-to-rent
- 4.2×
Monthly cashflow live
- Estimated rent
- $1,958 high interval (Pro) →
- Mortgage (P&I)
- −$519
- Tax est. 1.5%
- −$124 /mo · $1,485/yr
- Insurance
- −$41
- HOA
- −$0
- Vacancy / Maint / Mgmt
- −$411
- Net cashflow
- $863
Break-even live
UW: 25.0% down · 7.5% · 30yr · 1.5% tax · 5.0% vac · 8.0% maint · 8.0% mgmt
Financing live
Cash to close
- Down payment
- $24,750
- Closing costs
- $2,970
- Reserves months
- —
- Total cash needed
- —
Loan-product check · same deal, 3 products live
Conventional
25% down · 7.5% · 30yr
- Down + closing
- —
- Monthly P&I
- —
- Monthly cashflow
- —
- DSCR
- —
- Eligible?
- —
Personal DTI + credit; lowest rate.
DSCR
20% down · 8.5% · 30yr
- Down + closing
- —
- Monthly P&I
- —
- Monthly cashflow
- —
- DSCR
- —
- Eligible?
- —
No personal income docs; deal must DSCR.
Hard money
10% down · 12.0% · 12mo
- Down + closing
- —
- Monthly P&I
- —
- Monthly cashflow
- —
- DSCR
- —
- Eligible?
- —
Short-term bridge; refi at stabilization.
Rent comps 14 comps
| Address | Beds | Baths | Sqft | Rent | $/sqft | DOM | Units | Dist |
|---|---|---|---|---|---|---|---|---|
| 4217 Canterbury Dr El Paso, TX | 3.0 | 2.0 | 1827 | $2,095 | $1.15 | 44d | 1 | 0.09mi |
| 4312 Wallington Dr El Paso, TX | 3.0 | 2.0 | 2220 | $1,900 | $0.86 | 19d | 1 | 0.09mi |
| 4004 Camelot Heights Dr Unit B El Paso, TX | 4.0 | 3.5 | 1708 | $2,350 | $1.38 | 24d | 1 | 0.39mi |
| 3408 Hixson St El Paso, TX | 3.0 | 2.0 | 1260 | $2,600 | $2.06 | 44d | 1 | 0.75mi |
| 294 Vaquero Ln Unit B El Paso, TX | 2.0 | 2.5 | 1786 | $2,250 | $1.26 | 14d | 1 | 0.81mi |
| 4704 Pistolero Ln Unit A El Paso, TX | 3.0 | 2.5 | 1856 | $1,900 | $1.02 | 14d | 1 | 0.83mi |
| 108 Vaquero Ln El Paso, TX | 1.0–3.0 | 1.0–2.0 | 1020 | $1,330 | $1.30 | 44d | 10 | 0.88mi |
| 4800 N Stanton St El Paso, TX | 2.0–3.0 | 2.0–3.5 | 1504 | $2,100 | $1.40 | 24d | 2 | 0.94mi |
| 4800 N Stanton St Unit 183 El Paso, TX | 3.0 | 3.5 | 1936 | $2,100 | $1.08 | 21d | 1 | 0.94mi |
| 923 McKelligon Dr El Paso, TX | 3.0 | 2.0 | 2186 | $2,500 | $1.14 | 44d | 1 | 1.01mi |
| 1104 Madeline Dr El Paso, TX | 3.0 | 2.0 | 1584 | $2,500 | $1.58 | 44d | 1 | 1.18mi |
| 310 E Baltimore Dr Unit 1 El Paso, TX | 2.0 | 2.0 | 1400 | $1,700 | $1.21 | 44d | 1 | 1.21mi |
| 461 Vin Benicarlo Pl El Paso, TX | 2.0 | 2.5 | 1734 | $2,450 | $1.41 | 24d | 1 | 1.26mi |
| 611 New York Ave El Paso, TX | 3.0 | 2.0 | 1555 | $1,795 | $1.15 | 14d | 1 | 1.39mi |
Listing history 2 events
-
2026-06-19remarks 48-char remark
-
2026-06-19$99,000 Pending
ⓘ Source: listings_history table (triggers on properties + properties_extension) + one-shot
backfill from property_details.listing_events for pre-trigger history.
Climate risk First Street
- Flood 1/10 Low FEMA zone X · 0% chance over 30 yrs
- Wildfire 1/10 Low
- Heat 6/10 Major 6 d/yr ≥100°F today · 21 d/yr by 30 yrs out
- Wind 1/10 Low
- Air quality 2/10 Low 1 unhealthy d/yr today · 1 by 30 yrs out
Nearby sold comps map
Loading sold comps map…
Walkable amenities ~0.75 mi
Loading nearby amenities…
Taxation est. · year 1
- Rental income
- $23,494
- − Mortgage interest
- −$5,546
- − Property taxes
- −$1,485
- − Insurance
- −$495
- − Repairs & maintenance
- −$1,880
- − Management
- −$1,880
- − Depreciation
- −$2,880
- Taxable income
- $9,330
- Est. tax owed @ 24.0%
- −$2,239
- After-tax cash flow
- $8,111/yr
For passive investors: Depreciation is non-cash, so a rental often shows a tax loss while cash-flowing — sheltering income. Rental losses are passive: they offset passive income freely, and up to $25,000/yr can offset ordinary (W-2) income if you actively participate and your MAGI is under $100k (phasing out to $0 by $150k); unused losses carry forward. On sale, claimed depreciation is recaptured at up to 25%, and gains may owe capital-gains tax (a 1031 exchange can defer both). Figures are a year-1 estimate at your 24.0% rate — not tax advice; consult a CPA.
Schools (NCES district)
- District
- El Paso ISD
- NCES district ID
- 4818300
- Math proficiency
- 27% ▼ -24.00%
- Reading proficiency
- 37% ▼ -7.00%
- Median HH income
- $38,704
- Composite
- 26.75/100
- National rank
- #7138
- State rank
- #591 of 826 in TX
Livability — El Paso
- Score
- 81/100
- State rank
- #23
- US rank
- #1375
Category grades
Schools grade is shown separately in the Schools card above.
Census & demographics
- Census place
- El Paso, TX
- County
- El Paso County · 761,266 people
- City population
- 630,223
- Metro
- El Paso, TX
- Population (ZIP)
- 19,031
- Household income
- $50,873
- Rent vs Own
- Severe rent burden
- 1380.0
Population outlook (El Paso County) Hauer SSP2
- Today (2025)
- 897,899 people
- By 2030
- 922,694 · +2.8%
- By 2040
- 960,492 · +7.0%
- By 2050
- 982,919 · +9.5%
- By 2075
- 997,266 · +11.1%
- By 2100
- 900,630 · +0.3%
Race, ethnicity, and origin ACS 2023
- Neighborhood character
- Predominantly Hispanic (75%)
- Race & ethnicity
- Hispanic / Latino 75% Two or more races 40% White 19% Black 2% Asian 1% Native American 1%
- Hispanic origin (detail)
- Mexican 71%
- Common ancestry
- Slovak 1% American 1% Lithuanian 1%
- Foreign-born
- 24% · Canada, India, China
- Languages at home
- 33% English-only · Spanish 65% Other Asian/Pacific 1% Other Indo-European 1%
Political lean MEDSL · El Paso
- 2024 margin
- D (+15.1) · D 57.0% · R 41.8% · Other 1.2%
- 2008→2024 swing
- -17.4pp toward R · 2008: 32.5pp · 2024: 15.1pp
- All cycles
- 2024: D+15.1 2020: D+35.1 2016: D+43.2 2012: D+32.6 2008: D+32.5
Not yet ingested
- Civics
- —
Market trends
- HPI YoY
- ▼ -74.95%
- Current HPI
- 249.5804
- Rent YoY
- ▲ 5.25%
- Metro
- El Paso, TX
- State GDP YoY
- ▲ 3.95%
- F500 in state
- 110
Industry mix (Fortune 500 HQ in TX)
| Industry | F500 HQs | Revenue |
|---|---|---|
| Energy | 16 | $1,198B |
|
||
| Technology | 5 | $198B |
|
||
| Engineering / Construction | 4 | $72B |
|
||
| Energy Services | 3 | $60B |
|
||
| Utilities | 3 | $41B |
|
||
| Healthcare | 2 | $330B |
|
||
Price history
5 events — show timeline
- 2026-06-18 Listing Removed — GEPARMLS
- 2026-06-13 Listed $99,000 GEPARMLS
- 2026-04-08 Sold (Public Records) — Public Records
- 1984-03-21 Sold (Public Records) — Public Records
- 1976-08-01 Sold (Public Records) — Public Records
Property tax history
+4.4%/yrLatest (2025): $5,640 · +12.5% YoY. Source: county tax records.
Cash-flow waterfall
monthlySold comps — $/sqft
last 12 mo · ≤1 miLoading sold comps…