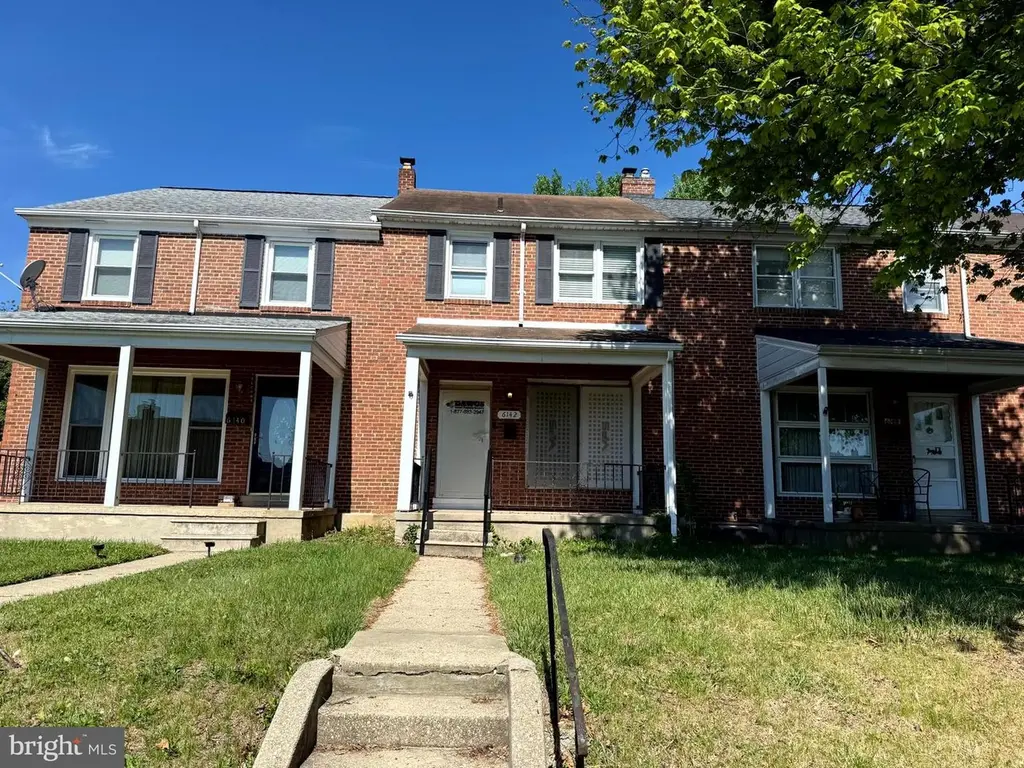
6142 Dunroming Rd · Baltimore, MD
Flood risk 1/10 · Minimal
- FEMA flood zone
- X (unshaded)
- Chance of flooding over 30 yrs
- 0.0%
- Est. flood insurance / yr
- $473 – $860
Fire risk 1/10 · Minimal
- Est. fire insurance / yr
- $755 – $1,403
Heat risk 7/10 · Major
- Hot days now (above 103°F)
- 7 days/yr
- Hot days in 30 yrs
- 15 days/yr
Wind risk 6/10 · Moderate
- Chance of severe wind over 30 yrs
- 27.0%
Air-quality risk 4/10 · Minor
- Unhealthy air days now
- 3 days/yr
- Unhealthy air days in 30 yrs
- 6 days/yr
Risk factors via First Street. Map © Google.
Why this score? — see what drove the C grade
The composite is a weighted blend of 9 inputs, each scored 0–100. Each bar is that input's sub-score; the figure is the points it added to the 100-point composite (weight × sub-score).
- Cash flow +20.5/30.0
- ARV discount +15.0/15.0
- DSCR +6.5/10.0
- 1% rule +5.9/10.0
- Livability +3.8/5.0
- Rent growth +3.2/5.0
- Condition / age +2.5/5.0
- Schools +1.0/10.0
- Appreciation +0.0/10.0
$179,900
🖨 Deal sheet (PDF) 📄 Offer letter ✓ Due diligence
Listing remarks
Charming home located in the community of Idlewood. This home has hardwood floors, separate dining room off kitchen, stainless steel appliances. Partially finished basement for storage or added living space. Fenced in rear yard. Close to schools, shopping and transportation. Don't miss out on the opportunity to own this home!
Key facts
- Separate dining room
- Fenced in rear yard
- Hardwood floors
Tags
Property features AI
Exterior
- Parking: On-street parking
- Utilities: Public water; Public sewer; Natural gas heating and hot water
- Home design: Interior townhouse/rowhouse
- Construction: Brick construction; Permanent foundation; Above-grade and below-grade structures
- Exterior features: No tidal water
Interior
- Bedrooms: Three bedrooms on the first upper level
- Bathrooms: One full bathroom; One half bathroom on a lower level
- Heating & cooling: Forced air heating; Electric cooling (other type); Natural gas hot water
- Interior features: Partially finished basement; Living area per assessor
Neighborhood map
What this means for you Summary
Snapshot
- This is a 3-bed/1.5-bath townhouse listed at $180k.
Deal economics
- At list price, monthly cash flow is $237 ($3k/yr) — positive.
- The deal already cash-flows at list — no discount required.
- Meets the 1% rule at list price ($2k rent vs $180k).
- Recommended offer: $177k (1.5% below list) — sets the bar for market timing.
- Cap rate 7.9% vs local median 6.0% in Baltimore — top-decile yield for the area; either an underpriced asset or a hidden risk that comps aren't pricing in. Stress-test before assuming the spread holds.
Location & tenants
- Location reads 76/100 on livability (#90 in MD, #3,396 nationally) — a middle-class / working-renter tenant base. Strengths: amenities A+, commute A+, housing A+; Watch: crime F.
- Baltimore City Public Schools (urban): math 7% / reading 16% proficiency, ranked #24 of 24 in MD (top 100%) — low school quality limits family demand, transient renter base, plan for 1-2y turnover; 79% free/reduced lunch — lower-income household profile, screen leases tightly.
- Zoned schools: Leith Walk Elementary/Middle (math 4% / reading 10%, grade F, #726 of 860 statewide, top 86%, 967 students, 76% FRL); Vanguard Collegiate Middle (math 3% / reading 15%, grade F, #212 of 225 statewide, top 95%, 343 students, 84% FRL); Baltimore Polytechnic Institute (math 71% / reading 84%, grade A-, #22 of 222 statewide, top 10%, 1,555 students, 43% FRL).
- Zoned-school proficiency averages 31% at this address vs 12% district-wide (+20 pts) — the actual schools serving this property are materially stronger than the Baltimore City Public Schools average implies; a family-tenant draw the district grade alone would hide.
- Market conditions: Rents rising (+2.9%/yr); 72 active listings in the ZIP; 40 comparable units currently listed for rent nearby; rentals at typical pace (median 25d on market — plan ~3-4 weeks tenant-placement turnaround); 1,273 units permitted in Baltimore city in 2024 (1,104 in 5+ unit buildings).
- This rent runs 38% of the median local income ($63k/yr) — at the standard rent-burdened threshold; future hikes will face affordability resistance.
Forward outlook
- Local home prices are declining (-3.0%/yr); year-one equity from $1k of loan paydown is wiped out by about $5k of value loss. Plan a longer hold.
- Baltimore County population projected to shrink 4% by 2050 — rents likely to lag national; underwrite the cash flow, not the appreciation.
Negotiation context
- It's been on market 17 days — a 2% lower offer ($177k) is reasonable based on typical stale-listing flexibility.
- 4 sale attempts since 27y ago with the ask held roughly flat each time — persistent listings suggest the price (not the market) is what's stuck; bring a comps-based counter.
Risks & watch-outs
- Watch-outs: built in 1955 — expect roof / HVAC / electrical / plumbing capex.
- Climate carrying-cost: major wind risk, 27% chance of damaging wind over 30y; extreme-heat days projected 7→15/yr by 2055 (HVAC capex compounding) — expect insurance premiums to compound above CPI over the hold.
Questions for the listing agent
- Built in 1955 — when were the roof, HVAC, electrical panel, plumbing, and water heater last replaced?
- Is there a deadline driving the sale (1031 exchange, divorce, estate, relocation)? That informs how much negotiation room exists.
- Schools are D-rated, which usually means shorter tenancies and higher turnover. Who's the typical renter profile here, and what's been the actual vacancy rate?
- Crime grade is F in this area — have there been break-ins, vandalism, or insurance claims at this property in the last 3 years? What carrier currently insures it and at what premium?
- What's the average days-on-market for RENTAL listings here right now (not sales)? A rising rental-DOM trend means longer vacancies and softer asking-rent achievability than the comps imply.
- What's the recent tenant-quality profile in this submarket — average credit score on applications, eviction rate, late-payment / NSF rate, and stable-employment percentage? A property-management company in the area should have these aggregated.
- How much new for-sale + rental construction is in the pipeline within 1–3 miles? Heavy new supply typically softens prices + rents 12–24 months out; constrained supply supports both.
Investment metrics
- 1% rule
- 1.09% ✓
- Cap rate
- 7.87%
- Cash-on-cash
- 5.64%
- DSCR
- 1.25
- GRM
- 7.6
CMA / ARV
- ARV (median comp)
- $253,981
- List price
- $179,900
- Delta
- -29.17%
- Verdict
- UNDERPRICED
- Comps
- 20 within 1.0 mi
Show comp detail 12 sales within ~0.75 mi
| Address | Dist | Beds/Ba | Sqft | Sold | Price | $/sf | Match |
|---|---|---|---|---|---|---|---|
| 1020 Dartmouth Rd | 0.30mi | 3/2.5 | 1,680 (+6%) | 2mo | $275,000 | $164 | 70 |
| 1371 E Northern Pkwy | 0.52mi | 3/2.0 | 1,567 (-1%) | 3mo | $269,900 | $172 | 70 |
| 853 Lenton Ave | 0.46mi | 4/2.0 (+1) | 1,540 (-2%) | 2mo | $240,000 | $156 | 66 |
| 837 Reverdy Rd | 0.52mi | 3/2.0 | 1,500 (-5%) | 2mo | $164,700 | $110 | 63 |
| 1506 Gleneagle Rd | 0.71mi | 3/2.0 | 1,520 (-4%) | 2mo | $300,000 | $197 | 58 |
| 1526 Wadsworth Way | 0.74mi | 4/2.0 (+1) | 1,600 (+1%) | 1mo | $279,900 | $175 | 56 |
| 5811 The Alameda | 0.43mi | 4/2.0 (+1) | 1,420 (-10%) | 1mo | $250,000 | $176 | 55 |
| 5906 Ayleshire Rd | 0.71mi | 3/1.5 | 1,690 (+7%) | 1mo | $155,900 | $92 | 54 |
| 6415 Falkirk Rd | 0.55mi | 3/2.0 | 1,408 (-11%) | 2mo | $215,000 | $153 | 52 |
| 5819 Leith Walk | 0.52mi | 4/2.0 (+1) | 1,767 (+12%) | 0mo | $284,900 | $161 | 49 |
| 912 Evesham Ave | 0.56mi | 3/2.0 | 1,352 (-14%) | 2mo | $224,900 | $166 | 46 |
| 830 Saint Dunstans Rd | 0.68mi | 3/1.0 | 1,394 (-12%) | 1mo | $161,000 | $115 | 45 |
Match score weights: distance 35% · size 25% · config 20% · recency 20%. Top-matched comps best support the ARV.
Projected returns pro-forma
-3.0% appreciation · 2.86% rent growth · sell at horizon
- IRR
- -7.7%
- Equity multiple
- 0.72×
- Total profit
- $-14,285
- Equity at exit
- $26,824
- IRR
- 1.7%
- Equity multiple
- 1.12×
- Total profit
- $6,132
- Equity at exit
- $15,554
Cash invested: $50,372 (down + closing). Projections, not guarantees.
Landlord ↔ Tenant lean methodology
- Overall (CITY)
- 12 Strongly Tenant-Friendly
- State Maryland
- 27 Tenant-Leaning · D+14
- County
- — inherits STATE
- City Baltimore
- 12 Strongly Tenant-Friendly · D+58
ZIP-level market 21239
- Rents YoY
- 2.9%
- Active inventory
- 72
- Price-to-rent
- 7.6×
Monthly cashflow live
- Estimated rent
- $1,961 high interval (Pro) →
- Mortgage (P&I)
- −$943
- Tax from tax record
- −$294 /mo · $3,530/yr
- Insurance
- −$75
- HOA
- −$0
- Vacancy / Maint / Mgmt
- −$412
- Net cashflow
- $237
Break-even live
Sensitivity live
| Price | -10% $338 | -5% $288 | +0% $237 | +5% $186 | +10% $135 |
|---|---|---|---|---|---|
| Rent | -10% $82 | -5% $159 | +0% $237 | +5% $314 | +10% $392 |
| Rate | -1.0pp $327 | -0.5pp $282 | base $237 | +0.5pp $190 | +1.0pp $143 |
UW: 25.0% down · 7.5% · 30yr · 1.5% tax · 5.0% vac · 8.0% maint · 8.0% mgmt
Financing live
Cash to close
- Down payment
- $44,975
- Closing costs
- $5,397
- Reserves months
- —
- Total cash needed
- —
Loan-product check · same deal, 3 products live
Conventional
25% down · 7.5% · 30yr
- Down + closing
- —
- Monthly P&I
- —
- Monthly cashflow
- —
- DSCR
- —
- Eligible?
- —
Personal DTI + credit; lowest rate.
DSCR
20% down · 8.5% · 30yr
- Down + closing
- —
- Monthly P&I
- —
- Monthly cashflow
- —
- DSCR
- —
- Eligible?
- —
No personal income docs; deal must DSCR.
Hard money
10% down · 12.0% · 12mo
- Down + closing
- —
- Monthly P&I
- —
- Monthly cashflow
- —
- DSCR
- —
- Eligible?
- —
Short-term bridge; refi at stabilization.
Rent comps 40 comps
| Address | Beds | Baths | Sqft | Rent | $/sqft | DOM | Units | Dist |
|---|---|---|---|---|---|---|---|---|
| 6149 Dunroming Rd Baltimore, MD | 3.0 | 1.5 | 1400 | $1,895 | $1.35 | 12d | 1 | 0.01mi |
| 1104 Meridene Dr Unit 1 Baltimore, MD | 2.0 | 1.0 | 1098 | $1,350 | $1.23 | 45d | 1 | 0.13mi |
| 6189 Northwood Dr Baltimore, MD | 4.0 | 2.0 | 1400 | $2,200 | $1.57 | 45d | 1 | 0.19mi |
| 6159 Parkway Dr Apt 1 Baltimore, MD | 4.0 | 2.0 | 1408 | $2,200 | $1.56 | 25d | 1 | 0.27mi |
| 6159 Parkway Dr Baltimore, MD | 4.0 | 2.0 | 1408 | $2,200 | $1.56 | 23d | 1 | 0.28mi |
| 1106 Gleneagle Rd Unit 2 Baltimore, MD | 2.0 | 1.0 | 1100 | $1,450 | $1.32 | 45d | 1 | 0.34mi |
| 1111 Gleneagle Rd Unit 2 Baltimore, MD | 2.0 | 1.0 | 1452 | $1,050 | $0.72 | 45d | 1 | 0.37mi |
| 1020 Dartmouth Glen Way Baltimore, MD | 3.0 | 2.5 | 1152 | $2,250 | $1.95 | 25d | 1 | 0.37mi |
| 917 Reverdy Rd Unit A Baltimore, MD | 3.0 | 1.0 | 1200 | $2,100 | $1.75 | 45d | 1 | 0.52mi |
| 1444 Meridene Dr Baltimore, MD | 3.0 | 1.5 | 1520 | $1,950 | $1.28 | 45d | 1 | 0.57mi |
| 6405 Loch Crest Rd Idlewylde, MD | 3.0 | 2.5 | 1440 | $2,257 | $1.57 | 45d | 1 | 0.61mi |
| 6008 Clearspring Rd Baltimore, MD | 4.0 | 2.5 | 1758 | $3,600 | $2.05 | 25d | 1 | 0.65mi |
| 828 Saint Dunstans Rd Baltimore, MD | 3.0 | 2.0 | 1544 | $2,000 | $1.30 | 25d | 1 | 0.69mi |
| 1508 Gleneagle Rd Baltimore, MD | 3.0 | 2.0 | 1824 | $2,180 | $1.20 | 6d | 1 | 0.69mi |
| 6101 Loch Raven Blvd Baltimore, MD | 1.0–2.0 | 1.0–2.0 | 1138 | $2,318 | $2.04 | 3d | 8 | 0.72mi |
| 5626 Midwood Ave Unit 2 Baltimore, MD | 2.0 | 1.0 | 1452 | $1,100 | $0.76 | 25d | 1 | 0.78mi |
| 5622 Midwood Ave Baltimore, MD | 3.0 | 2.0 | 1452 | $2,300 | $1.58 | 45d | 1 | 0.79mi |
| 6518 Loch Hill Ct Loch Hill, MD | 3.0 | 1.5 | 1580 | $2,050 | $1.30 | 25d | 1 | 0.80mi |
| 818 Bradhurst Rd Baltimore, MD | 2.0 | 1.0 | 1216 | $1,350 | $1.11 | 5d | 1 | 0.81mi |
| 818 Bradhurst Rd Baltimore, MD | 2.0 | 1.0 | 1216 | $1,250 | $1.03 | 45d | 1 | 0.81mi |
| 5520 Sagra Rd Baltimore, MD | 3.0 | 1.5 | 1650 | $1,900 | $1.15 | 45d | 1 | 0.89mi |
| 1008 Tunbridge Rd Baltimore, MD | 3.0 | 2.0 | 1732 | $2,050 | $1.18 | 25d | 1 | 0.91mi |
| 620 Harwood Ave Baltimore, MD | 2.0 | 1.0 | 2056 | $1,350 | $0.66 | 45d | 1 | 0.92mi |
| 1646 Wadsworth Way Baltimore, MD | 3.0 | 1.0 | 1520 | $2,100 | $1.38 | 12d | 1 | 0.94mi |
| 214 Overbrook Rd Baltimore, MD | 3.0 | 2.0 | 1896 | $2,900 | $1.53 | 5d | 1 | 1.07mi |
| 1726 E Belvedere Ave Baltimore, MD | 3.0 | 2.0 | 1140 | $1,895 | $1.66 | 23d | 1 | 1.12mi |
| 1221 Glenwood Ave Baltimore, MD | 3.0 | 2.0 | 1390 | $2,595 | $1.87 | 45d | 1 | 1.16mi |
| 1908 E Belvedere Ave Baltimore, MD | 4.0 | 2.0 | 1425 | $1,950 | $1.37 | 21d | 1 | 1.22mi |
| 5204 Kelway Rd Baltimore, MD | 3.0 | 2.0 | 1666 | $2,350 | $1.41 | 25d | 1 | 1.22mi |
| 372 Old Trail Rd Baltimore, MD | 3.0 | 1.5 | 1530 | $2,500 | $1.63 | 45d | 1 | 1.23mi |
| 5307 York Rd Baltimore, MD | 2.0 | 1.0 | 1120 | $1,200 | $1.07 | 45d | 1 | 1.25mi |
| 5200 Ready Ave Baltimore, MD | 3.0 | 1.5 | 1116 | $1,950 | $1.75 | 5d | 1 | 1.27mi |
| 711 1/2 McCabe Ave Baltimore, MD | 4.0 | 3.0 | 1204 | $2,350 | $1.95 | 6d | 1 | 1.29mi |
| 100 E Melrose Ave Baltimore, MD | 2.0–3.0 | 2.0–2.5 | 1750 | $3,345 | $1.91 | 6d | 2 | 1.29mi |
| 6906 Donachie Rd Baltimore, MD | 1.0–3.0 | 1.0–2.0 | 1102 | $2,363 | $2.14 | 0d | 34 | 1.30mi |
| 5781 Edgepark Rd Baltimore, MD | 3.0 | 2.0 | 1568 | $1,975 | $1.26 | 17d | 1 | 1.31mi |
| 1804 Winford Rd Baltimore, MD | 3.0 | 1.5 | 1600 | $2,100 | $1.31 | 25d | 1 | 1.33mi |
| 1224 Winston Ave Baltimore, MD | 3.0 | 2.0 | 1248 | $2,100 | $1.68 | 19d | 1 | 1.35mi |
| 308 Stevenson Ln Towson, MD | 1.0–2.0 | 1.0–2.0 | 954 | $1,939 | $2.03 | 0d | 5 | 1.36mi |
| 2028 Hillenwood Rd Baltimore, MD | 4.0 | 2.0 | 1820 | $2,100 | $1.15 | 23d | 1 | 1.39mi |
Listing history 13 events
-
2026-05-13status Pending 327-char remark
-
2026-04-26$179,900 Active 327-char remark
-
2025-07-02status Pending
-
2025-07-02historical
-
2025-06-05status Active
-
2025-04-02historical Active Under Contract
-
2025-02-27$189,900 Active
-
2008-07-01soldstatus $198,000
-
2006-04-07soldstatus $90,000
-
1999-06-17soldstatus $78,500
-
1999-04-30soldstatus $78,500
-
1999-01-23historical
-
1999-01-06$78,500
ⓘ Source: listings_history table (triggers on properties + properties_extension) + one-shot
backfill from property_details.listing_events for pre-trigger history.
Tax reassessment forecast MD · Partial reset (capped growth)
- Current annual tax
- $3,530 · $294/mo
- Projected year-2 tax
- $3,530 · $294/mo
- Expected delta
- $0/yr ($0/mo · 0.0%)
ⓘ Screening estimate from a state-policy table — verify with the county assessor before closing.
Climate risk First Street
- Flood 1/10 Low FEMA zone X (unshaded) · 0% chance over 30 yrs
- Wildfire 1/10 Low
- Heat 7/10 Severe 7 d/yr ≥103°F today · 15 d/yr by 30 yrs out
- Wind 6/10 Major 27% chance of damaging wind over 30 yrs
- Air quality 4/10 Moderate 3 unhealthy d/yr today · 6 by 30 yrs out
Nearby sold comps map
Loading sold comps map…
Walkable amenities ~0.75 mi
Loading nearby amenities…
Taxation est. · year 1
- Rental income
- $23,532
- − Mortgage interest
- −$10,077
- − Property taxes
- −$3,530
- − Insurance
- −$900
- − Repairs & maintenance
- −$1,883
- − Management
- −$1,883
- − Depreciation
- −$5,233
- Taxable income
- $26
- Est. tax owed @ 24.0%
- −$6
- After-tax cash flow
- $2,833/yr
For passive investors: Depreciation is non-cash, so a rental often shows a tax loss while cash-flowing — sheltering income. Rental losses are passive: they offset passive income freely, and up to $25,000/yr can offset ordinary (W-2) income if you actively participate and your MAGI is under $100k (phasing out to $0 by $150k); unused losses carry forward. On sale, claimed depreciation is recaptured at up to 25%, and gains may owe capital-gains tax (a 1031 exchange can defer both). Figures are a year-1 estimate at your 24.0% rate — not tax advice; consult a CPA.
Schools (NCES district)
- District
- Baltimore City Public Schools
- NCES district ID
- 2400090
- Math proficiency
- 7% ▼ -9.00%
- Reading proficiency
- 16% ▼ -5.00%
- Median HH income
- $42,108
- Composite
- 10.08/100
- National rank
- #9805
- State rank
- #24 of 24 in MD
Livability — Baltimore
- Score
- 76/100
- State rank
- #90
- US rank
- #3396
Category grades
Schools grade is shown separately in the Schools card above.
Census & demographics
- Census place
- Baltimore, MD
- County
- Baltimore City · 558,601 people
- City population
- 588,727
- Metro
- Baltimore-Columbia-Towson, MD
- Population (ZIP)
- 27,346
- Household income
- $62,650
- Rent vs Own
- Severe rent burden
- 1103.0
Population outlook (Baltimore County) Hauer SSP2
- Today (2025)
- 624,249 people
- By 2030
- 621,541 · -0.4%
- By 2040
- 609,756 · -2.3%
- By 2050
- 597,249 · -4.3%
- By 2075
- 552,236 · -11.5%
- By 2100
- 513,934 · -17.7%
Race, ethnicity, and origin ACS 2023
- Neighborhood character
- Predominantly Black (76%)
- Race & ethnicity
- Black 76% White 12% Asian 4% Hispanic / Latino 4% Two or more races 4%
- Common ancestry
- Lithuanian 1% Romanian 1% Russian 1%
- Foreign-born
- 10% · Canada, United Kingdom, China
- Languages at home
- 88% English-only · Other Indo-European 3% Spanish 2% French/Haitian/Cajun 2%
Political lean MEDSL · Baltimore
- 2024 margin
- Solid D (+73.0) · D 85.2% · R 12.2% · Other 2.6%
- 2008→2024 swing
- -2.5pp toward R · 2008: 75.5pp · 2024: 73.0pp
- All cycles
- 2024: D+73.0 2020: D+76.6 2016: D+74.6 2012: D+76.4 2008: D+75.5
Not yet ingested
- Civics
- —
Market trends
- HPI YoY
- ▼ -164.48%
- Current HPI
- 258.094
- Rent YoY
- ▲ 2.86%
- Metro
- Baltimore-Columbia-Towson, MD
- State GDP YoY
- ▲ 2.97%
- F500 in state
- 12
Industry mix (Fortune 500 HQ in MD)
| Industry | F500 HQs | Revenue |
|---|---|---|
| Aerospace / Defense | 1 | $71B |
|
||
| Utilities | 1 | $25B |
|
||
| Hotels | 1 | $24B |
|
||
| Consumer Goods | 1 | $7B |
|
||
| Real Estate | 1 | $6B |
|
||
| Chemicals | 1 | $2B |
|
||
Price history
+129.2% since first listed13 events — show timeline
- 2026-05-13 Pending — BRIGHT MLS
- 2026-04-26 Listed $179,900 BRIGHT MLS
- 2025-07-02 Pending — BRIGHT MLS
- 2025-07-02 Listing Removed — BRIGHT MLS
- 2025-06-05 Relisted — BRIGHT MLS
- 2025-04-02 Contingent — BRIGHT MLS
- 2025-02-27 Listed $189,900 BRIGHT MLS
- 2008-07-01 Sold (Public Records) $198,000 Public Records
- 2006-04-07 Sold (Public Records) $90,000 Public Records
- 1999-06-17 Sold (Public Records) $78,500 Public Records
- 1999-04-30 Sold (MLS) $78,500 MRIS
- 1999-01-23 Delisted — MRIS
- 1999-01-06 Listed $78,500 MRIS
Property tax history
+1.3%/yrLatest (2025): $3,530 · +6.6% YoY. Source: county tax records.
Cash-flow waterfall
monthlySold comps — $/sqft
last 12 mo · ≤1 miLoading sold comps…