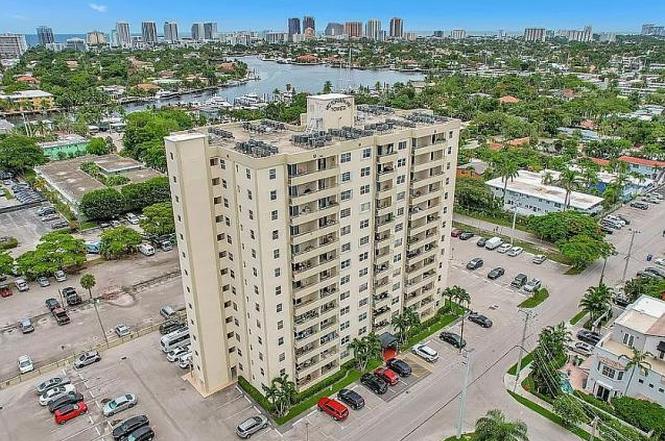
900 NE 18th Ave Apt 306 · Fort Lauderdale, FL
Flood risk 4/10 · Minor
- FEMA flood zone
- X (shaded)
- Chance of flooding over 30 yrs
- 0.21%
- Est. flood insurance / yr
- $507 – $1,088
Fire risk 1/10 · Minimal
- Est. fire insurance / yr
- $947 – $1,759
Heat risk 10/10 · Severe
- Hot days now (above 105°F)
- 7 days/yr
- Hot days in 30 yrs
- 27 days/yr
Wind risk 10/10 · Severe
- Chance of severe wind over 30 yrs
- 99.0%
Air-quality risk 2/10 · Minimal
- Unhealthy air days now
- 1 days/yr
- Unhealthy air days in 30 yrs
- 1 days/yr
Risk factors via First Street. Map © Google.
Why this score? — see what drove the F grade
The composite is a weighted blend of 9 inputs, each scored 0–100. Each bar is that input's sub-score; the figure is the points it added to the 100-point composite (weight × sub-score).
- ARV discount +7.5/15.0
- Cash flow +6.3/30.0
- 1% rule +5.5/10.0
- Schools +4.1/10.0
- Livability +4.1/5.0
- Rent growth +3.2/5.0
- Condition / age +2.5/5.0
- DSCR +0.6/10.0
- Appreciation +0.0/10.0
$219,000
🖨 Deal sheet (PDF) 📄 Offer letter ✓ Due diligence
Listing remarks
Spacious & amp; beautifully upgraded 2bed/1bath corner unit in desirable Victoria Park Towers. This bright southeast-facing unit is bathed in natural light. Cooks kitchen with granite counters, stainless appliances & amp; wood cabinets. Hardwood floors throughout. Balcony. Tons of storage in the unit as well as bonus large storage closet in hallway. Whole unit was repainted October 2025. Enjoy wonderful sunrises & amp; dining on your east facing balcony overlooking the sparkling heated pool. Assigned parking space right at front entrance! Shared Laundry. Everything you could want is nearby-Beach, Galleria, Las Olas, Starbucks, Publix & amp; Trader Joes, Gateway Theater, Rest
Key facts
- East facing balcony
- Cooks kitchen
- Stainless appliances
Tags
Neighborhood map
What this means for you Summary
Snapshot
- This is a 2-bed/1.0-bath condo listed at $219k.
Deal economics
- At list price, monthly cash flow is $-386 ($-5k/yr) — negative.
- The deal already cash-flows at list — no discount required.
- Meets the 1% rule at list price ($2k rent vs $219k).
- Recommended offer: $193k (12.0% below list) — sets the bar for market timing.
- Cap rate 4.2% vs local median 2.2% in Fort Lauderdale — top-decile yield for the area; either an underpriced asset or a hidden risk that comps aren't pricing in. Stress-test before assuming the spread holds.
Location & tenants
- Location reads 82/100 on livability (#78 in FL, #1,293 nationally) — a professional / high-income tenant draw. Strengths: crime A+, amenities A+, health & safety A+; Watch: cost of living D-.
- Broward (suburban): math 42% / reading 53% proficiency, ranked #46 of 73 in FL (top 63%) — families likely to look elsewhere, expect single-tenant / working-renter base with shorter leases.
- Market conditions: Rents rising (+2.8%/yr); 630 active listings in the ZIP; 40 comparable units currently listed for rent nearby; rentals at typical pace (median 24d on market — plan ~3-4 weeks tenant-placement turnaround); solid renter incomes; 2,111 units permitted in Broward County in 2024 (1,265 in 5+ unit buildings).
- This rent runs 32% of the median local income ($85k/yr) — at the standard rent-burdened threshold; future hikes will face affordability resistance.
Forward outlook
- Local home prices are declining (-3.0%/yr); year-one equity from $2k of loan paydown is wiped out by about $7k of value loss. Plan a longer hold.
- Broward County population projected at +34% by 2050 — long-run rental-demand tailwind backs the buy-and-hold thesis.
Negotiation context
- It's been on market 166 days — a 12% lower offer ($193k) is reasonable based on typical stale-listing flexibility.
- 8 sale attempts; this cycle's ask is 11426% above the opening price — seller raised mid-cycle; expect resistance to lowballs.
Risks & watch-outs
- Watch-outs: HOA is 26% of rent.
- Climate carrying-cost: severe wind risk, 99% chance of damaging wind over 30y; extreme-heat days projected 7→27/yr by 2055 (HVAC capex compounding) — expect insurance premiums to compound above CPI over the hold.
Questions for the listing agent
- What do current leases actually rent for vs. the listed asking? Can we see a recent rent roll and the last 12 months of T-12 income?
- It's been on market 166 days. Have you received any prior offers? Is the seller open to a 12% concession, seller financing, or rate buy-down credit?
- Built in 1970 — when were the roof, HVAC, electrical panel, plumbing, and water heater last replaced?
- What does the HOA fee cover, when was the last increase, and are there any pending special assessments or reserve-fund shortfalls?
- Any open or pending special assessments — roof, HVAC, plumbing, elevator, façade? What's the per-unit balance and payoff schedule, and is the seller paying it off at close or rolling it to the buyer?
- Why hasn't it sold? Are there any deal-killer items the seller is aware of (foundation, flood, title, zoning, code violations)?
- Is there a deadline driving the sale (1031 exchange, divorce, estate, relocation)? That informs how much negotiation room exists.
- Schools are B-rated — typically a magnet for longer-tenancy family renters. What's the average tenant stay here, and is there a school-zone premium baked into asking?
- The area grade is low — what's the realistic commute time and amenity access for the typical tenant pool here? Any planned neighborhood developments (good or bad) we should know about?
- What's the average days-on-market for RENTAL listings here right now (not sales)? A rising rental-DOM trend means longer vacancies and softer asking-rent achievability than the comps imply.
- What's the recent tenant-quality profile in this submarket — average credit score on applications, eviction rate, late-payment / NSF rate, and stable-employment percentage? A property-management company in the area should have these aggregated.
- How much new apartment / multifamily construction is in the pipeline within 1–3 miles? Heavy new supply (>2% of stock underway) typically softens rents 12–24 months out; light construction supports rent growth.
Investment metrics
- 1% rule
- 1.05% ✓
- Cap rate
- 4.18%
- Cash-on-cash
- -7.56%
- DSCR
- 0.66
- GRM
- 8.0
CMA / ARV
No comps found within radius.
Projected returns pro-forma
-3.0% appreciation · 2.75% rent growth · sell at horizon
- IRR
- -29.6%
- Equity multiple
- 0.02×
- Total profit
- $-60,205
- Equity at exit
- $32,654
- IRR
- -30.8%
- Equity multiple
- -0.38×
- Total profit
- $-84,598
- Equity at exit
- $18,935
Cash invested: $61,320 (down + closing). Projections, not guarantees.
Landlord ↔ Tenant lean methodology
- Overall (STATE)
- 87 Strongly Landlord-Friendly
- State Florida
- 87 Strongly Landlord-Friendly · R+3
- County
- — inherits STATE
- City
- — inherits STATE
ZIP-level market 33304
- Rents YoY
- 2.8%
- Active inventory
- 630
- Price-to-rent
- 8.0×
Monthly cashflow live
- Estimated rent
- $2,295 high interval (Pro) →
- Mortgage (P&I)
- −$1,148
- Tax from tax record
- −$359 /mo · $4,314/yr
- Insurance
- −$91
- HOA est. from 8 same-building comps
- −$600
- Vacancy / Maint / Mgmt
- −$482
- Net cashflow
- $-386
Break-even live
Sensitivity live
| Price | -10% $-262 | -5% $-324 | +0% $-386 | +5% $-448 | +10% $-510 |
|---|---|---|---|---|---|
| Rent | -10% $-568 | -5% $-477 | +0% $-386 | +5% $-296 | +10% $-205 |
| Rate | -1.0pp $-276 | -0.5pp $-331 | base $-386 | +0.5pp $-443 | +1.0pp $-501 |
UW: 25.0% down · 7.5% · 30yr · 1.5% tax · 5.0% vac · 8.0% maint · 8.0% mgmt
Financing live
Cash to close
- Down payment
- $54,750
- Closing costs
- $6,570
- Reserves months
- —
- Total cash needed
- —
Loan-product check · same deal, 3 products live
Conventional
25% down · 7.5% · 30yr
- Down + closing
- —
- Monthly P&I
- —
- Monthly cashflow
- —
- DSCR
- —
- Eligible?
- —
Personal DTI + credit; lowest rate.
DSCR
20% down · 8.5% · 30yr
- Down + closing
- —
- Monthly P&I
- —
- Monthly cashflow
- —
- DSCR
- —
- Eligible?
- —
No personal income docs; deal must DSCR.
Hard money
10% down · 12.0% · 12mo
- Down + closing
- —
- Monthly P&I
- —
- Monthly cashflow
- —
- DSCR
- —
- Eligible?
- —
Short-term bridge; refi at stabilization.
Rent comps 40 comps
| Address | Beds | Baths | Sqft | Rent | $/sqft | DOM | Units | Dist |
|---|---|---|---|---|---|---|---|---|
| 801 NE 19th Ave Unit B Fort Lauderdale, FL | 2.0 | 1.0 | 1000 | $2,000 | $2.00 | 25d | 1 | 0.08mi |
| 1911 NE 8th Ct Fort Lauderdale, FL | 1.0 | 1.0 | 650 | $1,650 | $2.54 | 25d | 1 | 0.10mi |
| 824 NE 17th Ter Unit 6 Fort Lauderdale, FL | 1.0 | 1.0 | 650 | $1,625 | $2.50 | 25d | 1 | 0.16mi |
| 1704 NE 9th St Fort Lauderdale, FL | 1.0 | 1.0 | 650 | $1,800 | $2.77 | 12d | 1 | 0.22mi |
| 828 NE 17th Ave Unit 2 Fort Lauderdale, FL | 2.0 | 2.0 | 850 | $2,250 | $2.65 | 25d | 1 | 0.22mi |
| 832 NE 17th Ave Fort Lauderdale, FL | 1.0 | 1.0 | 850 | $2,250 | $2.65 | 25d | 1 | 0.22mi |
| 1020 N Victoria Park Rd Unit 26 Fort Lauderdale, FL | 1.0 | 1.0 | 700 | $2,095 | $2.99 | 25d | 1 | 0.23mi |
| 815 Middle River Dr Fort Lauderdale, FL | 1.0 | 1.0 | 555 | $1,850 | $3.33 | 0d | 2 | 0.24mi |
| 815 Middle River Dr #203 Fort Lauderdale, FL | 1.0 | 1.0 | 660 | $1,900 | $2.88 | 21d | 1 | 0.25mi |
| 1160 N Federal Hwy #315 Fort Lauderdale, FL | 1.0 | 1.0 | 900 | $1,950 | $2.17 | 25d | 1 | 0.27mi |
| 1620 NE 8th St Fort Lauderdale, FL | 2.0 | 1.0 | 1100 | $3,500 | $3.18 | 16d | 1 | 0.28mi |
| 746 NE 16th Ter Fort Lauderdale, FL | 2.0 | 2.0 | 1000 | $5,500 | $5.50 | 22d | 1 | 0.29mi |
| 1640 E Sunrise Blvd Fort Lauderdale, FL | 1.0–2.0 | 1.0–2.0 | 1034 | $3,139 | $3.04 | 0d | 12 | 0.30mi |
| 1101 NE 18th Ave Unit 8 Fort Lauderdale, FL | 1.0 | 1.0 | 600 | $2,000 | $3.33 | 25d | 1 | 0.31mi |
| 1015 NE 17th Ave Unit 203 Fort Lauderdale, FL | 2.0 | 1.0 | 725 | $1,995 | $2.75 | 15d | 1 | 0.33mi |
| 1715 NE 11th St Fort Lauderdale, FL | 1.0 | 1.0 | 600 | $1,900 | $3.17 | 25d | 1 | 0.35mi |
| 1713 NE 11th St Unit A Fort Lauderdale, FL | 1.0 | 1.0 | 600 | $1,750 | $2.92 | 25d | 1 | 0.36mi |
| 847 NE 16th Ave Unit 1369651P Fort Lauderdale, FL | 1.0 | 1.0 | 645 | $3,364 | $5.22 | 6d | 1 | 0.36mi |
| 1614 NE 7th St Fort Lauderdale, FL | 1.0 | 1.0 | 879 | $2,200 | $2.50 | 23d | 1 | 0.37mi |
| 737 NE 16th Ave Unit 4 Fort Lauderdale, FL | 2.0 | 2.0 | 1029 | $2,300 | $2.24 | 6d | 1 | 0.38mi |
| 917 NE 16th Ave #16 Fort Lauderdale, FL | 2.0 | 2.0 | 960 | $2,350 | $2.45 | 15d | 1 | 0.39mi |
| 917 NE 16th Ave #16 Fort Lauderdale, FL | 2.0 | 2.0 | 960 | $2,250 | $2.34 | 25d | 1 | 0.39mi |
| 717 NE 16th Ave Unit 717A Fort Lauderdale, FL | 1.0 | 1.0 | 705 | $1,800 | $2.55 | 25d | 1 | 0.39mi |
| 727 NE 16th Ave Unit 727D Fort Lauderdale, FL | 1.0 | 1.0 | 705 | $1,750 | $2.48 | 0d | 1 | 0.39mi |
| 727 NE 16th Ave Unit 727D Fort Lauderdale, FL | 1.0 | 1.0 | 705 | $1,850 | $2.62 | 25d | 1 | 0.39mi |
| 719 NE 16th Ave Unit 719B Fort Lauderdale, FL | 2.0 | 1.0 | 936 | $2,200 | $2.35 | 0d | 1 | 0.39mi |
| 1136 NE 17th Way Fort Lauderdale, FL | 2.0 | 1.0 | 820 | $2,000 | $2.44 | 6d | 1 | 0.40mi |
| 701 NE 16th Ave Fort Lauderdale, FL | 1.0–2.0 | 1.0 | 656 | $1,999 | $3.05 | 16d | 4 | 0.40mi |
| 701 NE 16th Ave Fort Lauderdale, FL | 1.0–2.0 | 1.0 | 641 | $1,889 | $2.95 | 4d | 2 | 0.40mi |
| 701 NE 16th Ave Fort Lauderdale, FL | 2.0 | 1.0 | 725 | $1,869 | $2.58 | 4d | 2 | 0.40mi |
| 701 NE 16th Ave Fort Lauderdale, FL | 2.0 | 1.0 | 725 | $1,944 | $2.68 | 5d | 2 | 0.40mi |
| 1108 NE 16th Ter Apt 1 Fort Lauderdale, FL | 2.0 | 1.0 | 700 | $1,950 | $2.79 | 25d | 1 | 0.42mi |
| 1119 NE 17th Ave Fort Lauderdale, FL | 2.0 | 2.0 | 900 | $2,400 | $2.67 | 25d | 1 | 0.42mi |
| 716 NE 14th Ave Unit 4 Fort Lauderdale, FL | 1.0 | 1.0 | 600 | $1,775 | $2.96 | 25d | 1 | 0.47mi |
| 501 NE 17th Ave Fort Lauderdale, FL | 2.0 | 1.0 | 750 | $2,099 | $2.80 | 22d | 1 | 0.48mi |
| 501 NE 17th Ave Unit 3 Fort Lauderdale, FL | 2.0 | 1.0 | 750 | $2,099 | $2.80 | 23d | 1 | 0.48mi |
| 2424 NE 9th St Fort Lauderdale, FL | 1.0–2.0 | 1.5–2.0 | 1000 | $2,950 | $2.95 | 0d | 2 | 0.51mi |
| 2424 NE 9th St Fort Lauderdale, FL | 1.0–2.0 | 1.5–2.0 | 1000 | $2,950 | $2.95 | 4d | 3 | 0.51mi |
| 2424 NE 9th St Fort Lauderdale, FL | 1.0–2.0 | 1.5–2.0 | 1000 | $2,950 | $2.95 | 25d | 3 | 0.51mi |
| 1508 NE 6th St Unit A Fort Lauderdale, FL | 2.0 | 1.0 | 804 | $3,500 | $4.35 | 25d | 1 | 0.51mi |
HOA detail condo
- Monthly dues
- $0 · $0/yr
- Likely covers
- poolparking
- Assessments
- None detected in remarks — confirm with the listing agent.
Listing history 34 events
-
2026-06-21days on market $219,000 Active 166 DOM
-
2026-06-18days on market $219,000 Active 163 DOM
-
2026-06-17days on market $219,000 Active 162 DOM
-
2026-06-16days on market $219,000 Active 161 DOM
-
2026-06-15days on market $219,000 Active 160 DOM
-
2026-06-13days on market $219,000 Active 158 DOM
-
2026-06-09days on market $219,000 Active 154 DOM
-
2026-06-07days on market $219,000 Active 152 DOM
-
2026-06-04days on market $219,000 Active 149 DOM
-
2026-06-03days on market $219,000 Active 148 DOM
-
2026-06-02days on market $219,000 Active 147 DOM
-
2026-06-01days on market $219,000 Active 146 DOM
-
2026-05-31days on market $219,000 Active 145 DOM
-
2026-05-05historical
-
2026-03-28historical Active Under Contract
-
2026-02-18historical $1,900
-
2026-02-09$1,900
-
2026-02-07$215,000 Active
-
2026-01-05$219,000 Active
-
2025-10-14historical $1,800
-
2025-10-08$1,800
-
2025-09-29historical $1,895
-
2025-09-13$1,895
-
2025-08-06historical $2,000
-
2025-07-14$2,000
-
2025-07-08historical $2,000
-
2025-05-09$2,000
-
2025-04-16historical $2,100
-
2025-03-31price $2,100
-
2025-03-12price $2,200
-
2025-02-20$2,300
-
2005-11-21soldstatus $276,000
-
2005-11-21soldstatus $276,000
-
2002-03-20soldstatus $97,500
ⓘ Source: listings_history table (triggers on properties + properties_extension) + one-shot
backfill from property_details.listing_events for pre-trigger history.
Tax reassessment forecast FL · Resets to sale price
- Current annual tax
- $4,314 · $359/mo
- Projected year-2 tax
- $4,314 · $359/mo
- Expected delta
- $0/yr ($0/mo · 0.0%)
ⓘ Screening estimate from a state-policy table — verify with the county assessor before closing.
Climate risk First Street
- Flood 4/10 Moderate FEMA zone X (shaded) · 21% chance over 30 yrs
- Wildfire 1/10 Low
- Heat 10/10 Extreme 7 d/yr ≥105°F today · 27 d/yr by 30 yrs out
- Wind 10/10 Extreme 99% chance of damaging wind over 30 yrs
- Air quality 2/10 Low 1 unhealthy d/yr today · 1 by 30 yrs out
Nearby sold comps map
Loading sold comps map…
Walkable amenities ~0.75 mi
Loading nearby amenities…
Taxation est. · year 1
- Rental income
- $27,539
- − Mortgage interest
- −$12,267
- − Property taxes
- −$4,314
- − Insurance
- −$1,095
- − Repairs & maintenance
- −$2,203
- − Management
- −$2,203
- − HOA
- −$7,200
- − Depreciation
- −$6,371
- Taxable loss
- −$8,114
- Est. tax savings @ 24.0%
- +$1,947
- After-tax cash flow
- $-2,687/yr
For passive investors: Depreciation is non-cash, so a rental often shows a tax loss while cash-flowing — sheltering income. Rental losses are passive: they offset passive income freely, and up to $25,000/yr can offset ordinary (W-2) income if you actively participate and your MAGI is under $100k (phasing out to $0 by $150k); unused losses carry forward. On sale, claimed depreciation is recaptured at up to 25%, and gains may owe capital-gains tax (a 1031 exchange can defer both). Figures are a year-1 estimate at your 24.0% rate — not tax advice; consult a CPA.
Schools (NCES district)
- District
- Broward
- NCES district ID
- 1200180
- Math proficiency
- 42% ▼ -18.00%
- Reading proficiency
- 53% ▼ -5.00%
- Median HH income
- $52,139
- Composite
- 40.88/100
- National rank
- #3621
- State rank
- #46 of 73 in FL
Livability — Fort Lauderdale
- Score
- 82/100
- State rank
- #78
- US rank
- #1293
Category grades
Schools grade is shown separately in the Schools card above.
Census & demographics
- Census place
- Fort Lauderdale, FL
- County
- Broward County · 1,963,430 people
- City population
- 235,769
- Metro
- Miami-Fort Lauderdale-Pompano Beach, FL
- Population (ZIP)
- 18,332
- Household income
- $84,920
- Rent vs Own
- Severe rent burden
- 1534.0
Population outlook (Broward County) Hauer SSP2
- Today (2025)
- 2,207,033 people
- By 2030
- 2,360,704 · +7.0%
- By 2040
- 2,661,208 · +20.6%
- By 2050
- 2,946,698 · +33.5%
- By 2075
- 3,602,273 · +63.2%
- By 2100
- 3,970,984 · +79.9%
Race, ethnicity, and origin ACS 2023
- Neighborhood character
- Diverse neighborhood (Simpson 0.63)
- Race & ethnicity
- White 56% Hispanic / Latino 19% Two or more races 17% Black 13% Asian 4%
- Hispanic origin (detail)
- Mexican 2% Puerto Rican 4% Cuban 3%
- Common ancestry
- Hispanic 5% Scotch-Irish 3% Romanian 2%
- Foreign-born
- 32% · Canada, Jamaica, Vietnam
- Languages at home
- 61% English-only · Spanish 20% Other Indo-European 6% French/Haitian/Cajun 5%
Political lean MEDSL · Broward
- 2024 margin
- D (+17.0) · D 58.0% · R 41.0%
- 2008→2024 swing
- -17.8pp toward R · 2008: 34.7pp · 2024: 17.0pp
- All cycles
- 2024: D+17.0 2020: D+29.8 2016: D+35.0 2012: D+34.9 2008: D+34.7
Not yet ingested
- Civics
- —
Market trends
- HPI YoY
- ▼ -522.22%
- Current HPI
- 348.0065
- Rent YoY
- ▲ 2.75%
- Metro
- Miami-Fort Lauderdale-Pompano Beach, FL
- State GDP YoY
- ▲ 3.28%
- F500 in state
- 36
Industry mix (Fortune 500 HQ in FL)
| Industry | F500 HQs | Revenue |
|---|---|---|
| Industrial Technology | 2 | $29B |
|
||
| Insurance | 2 | $17B |
|
||
| Retail | 1 | $60B |
|
||
| Technology Distribution | 1 | $58B |
|
||
| Homebuilding | 1 | $35B |
|
||
| Technology Manufacturing | 1 | $35B |
|
||
Price history
-98.1% since first listed21 events — show timeline
- 2026-05-05 Listing Removed — MARMLS
- 2026-03-28 Contingent — MARMLS
- 2026-02-18 Rental Removed $1,900 MARMLS
- 2026-02-09 Listed for Rent $1,900 MARMLS
- 2026-02-07 Listed $215,000 MARMLS
- 2026-01-05 Listed $219,000 Fizber.com
- 2025-10-14 Rental Removed $1,800 GFLMLS
- 2025-10-08 Listed for Rent $1,800 GFLMLS
- 2025-09-29 Rental Removed $1,895 GFLMLS
- 2025-09-13 Listed for Rent $1,895 GFLMLS
- 2025-08-06 Rental Removed $2,000 GFLMLS
- 2025-07-14 Listed for Rent $2,000 GFLMLS
- 2025-07-08 Rental Removed $2,000 GFLMLS
- 2025-05-09 Listed for Rent $2,000 GFLMLS
- 2025-04-16 Rental Removed $2,100 GFLMLS
- 2025-03-31 Price Changed $2,100 GFLMLS
- 2025-03-12 Price Changed $2,200 GFLMLS
- 2025-02-20 Listed for Rent $2,300 GFLMLS
- 2005-11-21 Sold (Public Records) $276,000 Public Records
- 2005-11-21 Sold (Public Records) $276,000 Public Records
- 2002-03-20 Sold (Public Records) $97,500 Public Records
Property tax history
+9.6%/yrLatest (2025): $4,314 · +0.1% YoY. Source: county tax records.
Cash-flow waterfall
monthlySold comps — $/sqft
last 12 mo · ≤1 miLoading sold comps…