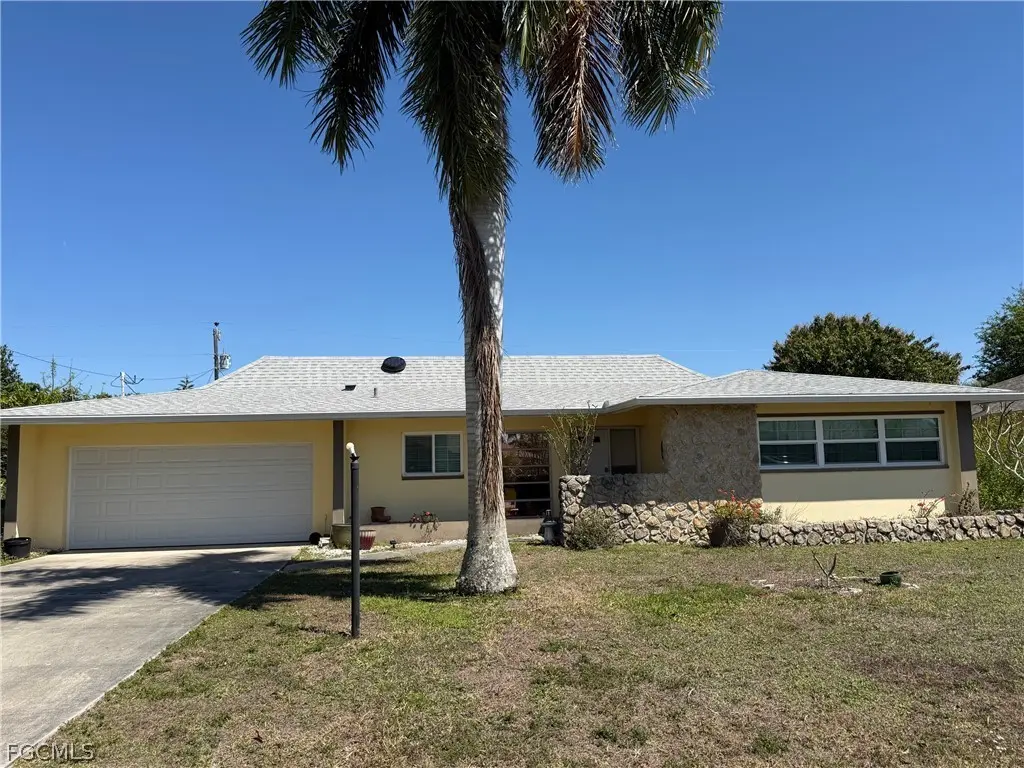
3109 SE 8th Pl · Cape Coral, FL
Flood risk 7/10 · Major
- FEMA flood zone
- X (shaded)
- Chance of flooding over 30 yrs
- 0.76%
- Est. flood insurance / yr
- $507 – $1,088
Fire risk 1/10 · Minimal
- Est. fire insurance / yr
- $947 – $1,759
Heat risk 10/10 · Severe
- Hot days now (above 107°F)
- 7 days/yr
- Hot days in 30 yrs
- 30 days/yr
Wind risk 10/10 · Severe
- Chance of severe wind over 30 yrs
- 99.0%
Air-quality risk 2/10 · Minimal
- Unhealthy air days now
- 1 days/yr
- Unhealthy air days in 30 yrs
- 1 days/yr
Risk factors via First Street. Map © Google.
Why this score? — see what drove the C- grade
The composite is a weighted blend of 9 inputs, each scored 0–100. Each bar is that input's sub-score; the figure is the points it added to the 100-point composite (weight × sub-score).
- Cash flow +17.3/30.0
- ARV discount +15.0/15.0
- DSCR +5.4/10.0
- Schools +4.1/10.0
- Livability +3.9/5.0
- 1% rule +3.7/10.0
- Condition / age +2.5/5.0
- Rent growth +1.1/5.0
- Appreciation +0.0/10.0
$235,000
🖨 Deal sheet (PDF) 📄 Offer letter ✓ Due diligence
Listing remarks
This home features 3 bedrooms, 2 baths, screened in lanai, new windows 10-4-2021 except sliding glass door and two widows on each side of the front door, new hurricane garage door, newer roof 7-26-2024, no flooding, large yard room for a pool. Kitchen has quarts counter tops and stainless-steel appliances, quiet neighborhood, easy access to shopping, restaurants, Fort Myers, Fort Myers Beach, Sanibel Island, Pine Island and RSW International Airport. Ready for its new owners!
Key facts
- Quarts counter tops
- Newer roof
- Large yard
Tags
Property features AI
Finance
- Other: Irrigation included in assessment; Public maintained road
- Financial info: Pets allowed
- HOA & community: Non-gated community; Association fee: $0
Exterior
- Parking: Attached 2-car garage; 2 covered spaces
- Security: Smoke detector(s)
- Utilities: Cable available; Sewer assessment paid; Water assessment paid
- Home design: Single-story; Resale; Faces west; Zoned R1
- Construction: Block, concrete and stucco construction; Shingle roof; Built on standard foundation
- Exterior features: Room for pool; Lanai; Porch; Screened porch; East exposure
Interior
- Kitchen: Dishwasher; Disposal; Microwave; Self-cleaning oven; Refrigerator
- Bedrooms: Screened porch; Great room
- Flooring: Terrazzo; Tile
- Bathrooms: 2 full bathrooms
- Heating & cooling: Central heating (electric); Central air conditioning (electric); Ceiling fan(s)
- Interior features: Entrance foyer; Living/dining room; Split bedrooms; Separate shower; Shower only; Sliding windows; Impact glass windows; Unfurnished
- Laundry & utility: Washer hookup; Dryer hookup; Washer; Dryer
Neighborhood map
What this means for you Summary
Snapshot
- This is a 3-bed/2.0-bath single-family listed at $235k.
Deal economics
- At list price, monthly cash flow is $107 ($1k/yr) — positive.
- The deal already cash-flows at list — no discount required.
- To meet the 1% rule (rent ≥ 1% of price), the offer needs to be $205k (12.7% below list).
- Recommended offer: $205k (12.7% below list) — sets the bar for 1% rule.
- Cap rate 7.2% vs local median 3.1% in Cape Coral — top-decile yield for the area; either an underpriced asset or a hidden risk that comps aren't pricing in. Stress-test before assuming the spread holds.
Location & tenants
- Location reads 77/100 on livability (#208 in FL, #3,098 nationally) — a middle-class / working-renter tenant base. Strengths: housing A+, health & safety A+, amenities B+; Watch: commute F.
- Lee (suburban): math 47% / reading 50% proficiency, ranked #42 of 73 in FL (top 58%) — families likely to look elsewhere, expect single-tenant / working-renter base with shorter leases.
- Zoned schools: Gulf Elementary School (math 70% / reading 65%, grade B+, #435 of 2,144 statewide, top 21%, 1,231 students, 38% FRL); Challenger Middle School (math 59% / reading 56%, grade B, #157 of 571 statewide, top 28%, 1,124 students, 50% FRL); Ida S. Baker High School (math 44% / reading 47%, grade D-, #223 of 667 statewide, top 34%, 1,933 students, 39% FRL) — zoned schools average 42% FRL vs 57% district-wide (15 pts lower); this property's tenant base skews higher-income than the district average.
- Market conditions: Rents falling (-5.5%/yr); 823 active listings in the ZIP; 40 comparable units currently listed for rent nearby; rentals at typical pace (median 26d on market — plan ~3-4 weeks tenant-placement turnaround); 15,411 units permitted in Lee County in 2024 (4,686 in 5+ unit buildings).
- This rent runs 35% of the median local income ($71k/yr) — at the standard rent-burdened threshold; future hikes will face affordability resistance.
Forward outlook
- Local home prices are declining (-3.0%/yr); year-one equity from $2k of loan paydown is wiped out by about $7k of value loss. Plan a longer hold.
- Lee County population projected at +44% by 2050 — long-run rental-demand tailwind backs the buy-and-hold thesis.
Negotiation context
- It's been on market 75 days — a 6% lower offer ($221k) is reasonable based on typical stale-listing flexibility.
- 2 sale attempts with the ask held roughly flat each time — persistent listings suggest the price (not the market) is what's stuck; bring a comps-based counter.
- Current owner paid $45k; list at $235k implies a 422% gain — meaningful room to come down on a strong offer.
Risks & watch-outs
- Watch-outs: flood insurance adds $66/mo.
- Climate carrying-cost: major flood risk; severe wind risk, 99% chance of damaging wind over 30y; extreme-heat days projected 7→30/yr by 2055 (HVAC capex compounding) — expect insurance premiums to compound above CPI over the hold.
Questions for the listing agent
- It's been on market 75 days. Have you received any prior offers? Is the seller open to a 13% concession, seller financing, or rate buy-down credit?
- Built in 1968 — when were the roof, HVAC, electrical panel, plumbing, and water heater last replaced?
- What's the actual annual flood-insurance premium (NFIP or private), and is the property in a SFHA with mandatory coverage?
- Why hasn't it sold? Are there any deal-killer items the seller is aware of (foundation, flood, title, zoning, code violations)?
- Is there a deadline driving the sale (1031 exchange, divorce, estate, relocation)? That informs how much negotiation room exists.
- Schools are B-rated — typically a magnet for longer-tenancy family renters. What's the average tenant stay here, and is there a school-zone premium baked into asking?
- What's the average days-on-market for RENTAL listings here right now (not sales)? A rising rental-DOM trend means longer vacancies and softer asking-rent achievability than the comps imply.
- What's the recent tenant-quality profile in this submarket — average credit score on applications, eviction rate, late-payment / NSF rate, and stable-employment percentage? A property-management company in the area should have these aggregated.
- How much new for-sale + rental construction is in the pipeline within 1–3 miles? Heavy new supply typically softens prices + rents 12–24 months out; constrained supply supports both.
Investment metrics
- 1% rule
- 0.87% ✗
- Cap rate
- 7.18%
- Cash-on-cash
- 3.17%
- DSCR
- 1.14
- GRM
- 9.5
CMA / ARV
- ARV (on-the-fly)
- $309,246
- Comps found
- 12
Show comp detail 12 sales within ~0.75 mi
| Address | Dist | Beds/Ba | Sqft | Sold | Price | $/sf | Match |
|---|---|---|---|---|---|---|---|
| 3011 SE 8th Pl | 0.09mi | 3/2.0 | 1,529 (+10%) | 4mo | $340,000 | $222 | 76 |
| 2727 SE 8th Ave | 0.45mi | 3/2.0 | 1,381 (-1%) | 4mo | $185,000 | $134 | 74 |
| 2931 SE 5th Ave | 0.48mi | 3/2.0 | 1,425 (+2%) | 2mo | $320,000 | $225 | 72 |
| 918 SE 28th Ter | 0.33mi | 3/2.0 | 1,525 (+10%) | 1mo | $329,900 | $216 | 68 |
| 632 SE 35th St | 0.53mi | 2/2.0 (-1) | 1,359 (-2%) | 1mo | $140,000 | $103 | 65 |
| 3034 SE 10th Pl | 0.25mi | 3/2.0 | 1,568 (+13%) | 4mo | $450,000 | $287 | 64 |
| 1116 SE 30th Ter | 0.47mi | 3/2.0 | 1,260 (-10%) | 2mo | $320,000 | $254 | 61 |
| 2825 SE 8th Pl | 0.30mi | 3/2.0 | 1,212 (-13%) | 5mo | $319,000 | $263 | 60 |
| 933 SE 26th St | 0.68mi | 3/2.0 | 1,324 (-5%) | 3mo | $258,000 | $195 | 57 |
| 1315 SE 33rd St | 0.69mi | 3/2.0 | 1,539 (+10%) | 2mo | $235,000 | $153 | 49 |
| 1306 Shelby Pkwy | 0.73mi | 3/2.0 | 1,562 (+12%) | 3mo | $500,000 | $320 | 43 |
| 1319 SE 33rd Ter | 0.73mi | 2/2.0 (-1) | 1,258 (-10%) | 3mo | $265,000 | $211 | 42 |
Match score weights: distance 35% · size 25% · config 20% · recency 20%. Top-matched comps best support the ARV.
Projected returns pro-forma
-3.0% appreciation · 0.0% rent growth · sell at horizon
- IRR
- -16.4%
- Equity multiple
- 0.43×
- Total profit
- $-37,284
- Equity at exit
- $35,039
- IRR
- -14.2%
- Equity multiple
- 0.29×
- Total profit
- $-47,041
- Equity at exit
- $20,319
Cash invested: $65,800 (down + closing). Projections, not guarantees.
Landlord ↔ Tenant lean methodology
- Overall (STATE)
- 87 Strongly Landlord-Friendly
- State Florida
- 87 Strongly Landlord-Friendly · R+3
- County
- — inherits STATE
- City
- — inherits STATE
ZIP-level market 33904
- Rents YoY
- -5.5%
- Active inventory
- 823
- Price-to-rent
- 9.5×
Monthly cashflow live
- Estimated rent
- $2,052 high interval (Pro) →
- Mortgage (P&I)
- −$1,232
- Tax from tax record
- −$117 /mo · $1,403/yr
- Insurance
- −$98
- Flood insurance flood zone
- −$66 /mo · $798/yr
- HOA
- −$0
- Vacancy / Maint / Mgmt
- −$431
- Net cashflow
- $107
Break-even live
Sensitivity live
| Price | -10% $241 | -5% $174 | +0% $107 | +5% $41 | +10% $-26 |
|---|---|---|---|---|---|
| Rent | -10% $-55 | -5% $26 | +0% $107 | +5% $189 | +10% $270 |
| Rate | -1.0pp $226 | -0.5pp $167 | base $107 | +0.5pp $47 | +1.0pp $-15 |
UW: 25.0% down · 7.5% · 30yr · 1.5% tax · 5.0% vac · 8.0% maint · 8.0% mgmt
Financing live
Cash to close
- Down payment
- $58,750
- Closing costs
- $7,050
- Reserves months
- —
- Total cash needed
- —
Loan-product check · same deal, 3 products live
Conventional
25% down · 7.5% · 30yr
- Down + closing
- —
- Monthly P&I
- —
- Monthly cashflow
- —
- DSCR
- —
- Eligible?
- —
Personal DTI + credit; lowest rate.
DSCR
20% down · 8.5% · 30yr
- Down + closing
- —
- Monthly P&I
- —
- Monthly cashflow
- —
- DSCR
- —
- Eligible?
- —
No personal income docs; deal must DSCR.
Hard money
10% down · 12.0% · 12mo
- Down + closing
- —
- Monthly P&I
- —
- Monthly cashflow
- —
- DSCR
- —
- Eligible?
- —
Short-term bridge; refi at stabilization.
Rent comps 40 comps
| Address | Beds | Baths | Sqft | Rent | $/sqft | DOM | Units | Dist |
|---|---|---|---|---|---|---|---|---|
| 1038 SE 30th St Cape Coral, FL | 3.0 | 2.0 | 1754 | $2,400 | $1.37 | 23d | 1 | 0.31mi |
| 618 W Archer Pkwy Cape Coral, FL | 3.0 | 2.0 | 1554 | $5,135 | $3.30 | 25d | 1 | 0.42mi |
| 1124 SE 29th St Cape Coral, FL | 3.0 | 2.0 | 1578 | $1,500 | $0.95 | 25d | 1 | 0.45mi |
| 1128 SE 29th Ter Cape Coral, FL | 3.0 | 2.0 | 1534 | $2,250 | $1.47 | 25d | 1 | 0.52mi |
| 3425 SE 10th Ave Cape Coral, FL | 3.0 | 2.0 | 1706 | $2,500 | $1.47 | 25d | 1 | 0.54mi |
| 3410 SE 11th Pl Cape Coral, FL | 3.0 | 2.0 | 1368 | $2,500 | $1.83 | 25d | 1 | 0.55mi |
| 922 SE 26th Ter Cape Coral, FL | 2.0 | 2.0 | 1323 | $1,700 | $1.28 | 21d | 1 | 0.56mi |
| 327 SE 31st Ter Cape Coral, FL | 3.0 | 2.0 | 1408 | $1,725 | $1.23 | 5d | 1 | 0.58mi |
| 922 SE 25th Ln Cape Coral, FL | 3.0 | 2.0 | 1516 | $2,250 | $1.48 | 25d | 1 | 0.67mi |
| 1235 Shelby Pkwy Cape Coral, FL | 3.0 | 2.0 | 1479 | $2,200 | $1.49 | 5d | 1 | 0.69mi |
| 1410 SE 31st Ter Cape Coral, FL | 3.0 | 2.0 | 1792 | $5,600 | $3.12 | 25d | 1 | 0.71mi |
| 3609 SE 9th Pl Unit 1 Cape Coral, FL | 2.0 | 2.0 | 914 | $1,200 | $1.31 | 25d | 1 | 0.71mi |
| 3609 SE 9th Pl Unit 1 Cape Coral, FL | 2.0 | 2.0 | 914 | $1,200 | $1.31 | 5d | 1 | 0.71mi |
| 506 SE 26th St Cape Coral, FL | 2.0 | 1.0 | 1680 | $1,500 | $0.89 | 25d | 1 | 0.73mi |
| 3619 SE 9th Pl Cape Coral, FL | 2.0 | 2.0 | 1090 | $1,250 | $1.15 | 25d | 1 | 0.74mi |
| 2509 Academy Blvd Cape Coral, FL | 3.0 | 2.0 | 1252 | $2,200 | $1.76 | 25d | 1 | 0.75mi |
| 1402 SE 34th St Cape Coral, FL | 3.0 | 2.0 | 1613 | $1,899 | $1.18 | 13d | 1 | 0.77mi |
| 310 SE 27th Ter Cape Coral, FL | 3.0 | 2.0 | 1378 | $3,700 | $2.69 | 25d | 1 | 0.78mi |
| 310 SE 27th Ter Cape Coral, FL | 3.0 | 2.0 | 1378 | $3,700 | $2.69 | 23d | 1 | 0.78mi |
| 2605 SE 4th Ave Cape Coral, FL | 3.0 | 2.0 | 1756 | $1,790 | $1.02 | 5d | 1 | 0.82mi |
| 3708 SE 12th Ave #201 Cape Coral, FL | 2.0 | 2.0 | 1111 | $1,800 | $1.62 | 25d | 1 | 0.83mi |
| 3705 Country Club Blvd Unit 1 Cape Coral, FL | 2.0 | 1.0 | 900 | $1,300 | $1.44 | 25d | 1 | 0.83mi |
| 1502 SE 33rd St Cape Coral, FL | 3.0 | 2.0 | 1430 | $2,100 | $1.47 | 5d | 1 | 0.86mi |
| 3722 SE 12th Ave Unit 1F Cape Coral, FL | 2.0 | 2.0 | 1410 | $2,150 | $1.52 | 25d | 1 | 0.87mi |
| 3527 SE 3rd Ave Cape Coral, FL | 3.0 | 2.0 | 1758 | $2,115 | $1.20 | 25d | 1 | 0.87mi |
| 1426 SE 34th Ter Cape Coral, FL | 3.0 | 2.0 | 1740 | $7,103 | $4.08 | 25d | 1 | 0.88mi |
| 1322 SE 35th Ter Cape Coral, FL | 4.0 | 2.0 | 1803 | $2,850 | $1.58 | 25d | 1 | 0.88mi |
| 2328 Country Club Blvd Cape Coral, FL | 3.0 | 2.0 | 1476 | $1,750 | $1.19 | 25d | 1 | 0.90mi |
| 2927 SE 15th Pl Unit 4 Cape Coral, FL | 2.0 | 1.0 | 945 | $1,350 | $1.43 | 16d | 1 | 0.92mi |
| 3813 SE 11th Pl #1214 Cape Coral, FL | 2.0 | 2.0 | 1008 | $1,725 | $1.71 | 5d | 1 | 0.94mi |
| 3801 Country Club Blvd Unit 1 Cape Coral, FL | 2.0 | 1.0 | 950 | $1,400 | $1.47 | 25d | 1 | 0.95mi |
| 1320 SE 25th Ln Cape Coral, FL | 3.0 | 2.0 | 1752 | $2,700 | $1.54 | 5d | 1 | 0.96mi |
| 3325 SE 15th Pl #202 Cape Coral, FL | 2.0 | 2.0 | 908 | $1,295 | $1.43 | 17d | 1 | 0.97mi |
| 3325 SE 15th Pl #202 Cape Coral, FL | 2.0 | 2.0 | 908 | $1,295 | $1.43 | 25d | 1 | 0.97mi |
| 136 Kamal Pkwy Cape Coral, FL | 3.0 | 2.0 | 1679 | $8,500 | $5.06 | 5d | 1 | 0.98mi |
| 3020 SE Santa Barbara Pl Cape Coral, FL | 3.0 | 2.0 | 1348 | $1,800 | $1.34 | 25d | 1 | 1.01mi |
| 3106 SE Santa Barbara Pl Cape Coral, FL | 3.0 | 2.0 | 1250 | $1,660 | $1.33 | 25d | 1 | 1.02mi |
| 3032 SE Santa Barbara Pl Unit 2 Cape Coral, FL | 2.0 | 2.0 | 1015 | $1,700 | $1.67 | 25d | 1 | 1.02mi |
| 3808 SE 11th Ave Unit A Cape Coral, FL | 2.0 | 2.0 | 1121 | $1,600 | $1.43 | 25d | 1 | 1.02mi |
| 3509 SE 15th Pl Unit 3 Cape Coral, FL | 2.0 | 2.0 | 1070 | $1,395 | $1.30 | 13d | 1 | 1.04mi |
Listing history 12 events
-
2026-06-13statusdays on market $235,000 Pending 75 DOM
-
2026-06-10days on market $235,000 Active 74 DOM
-
2026-06-09days on market $235,000 Active 73 DOM
-
2026-06-07days on market $235,000 Active 71 DOM
-
2026-06-03days on market $235,000 Active 67 DOM
-
2026-06-02days on market $235,000 Active 66 DOM
-
2026-06-01days on market $235,000 Active 65 DOM
-
2026-06-01days on market $235,000 Active 64 DOM
-
2026-04-26status Active
-
2026-04-21status Pending
-
2026-03-21$235,000 Active
-
1983-11-01soldstatus $45,000
ⓘ Source: listings_history table (triggers on properties + properties_extension) + one-shot
backfill from property_details.listing_events for pre-trigger history.
Tax reassessment forecast FL · Resets to sale price
- Current annual tax
- $1,403 · $117/mo
- Projected year-2 tax
- $1,950 · $163/mo
- Expected delta
- +$548/yr (+$46/mo · 39.0%)
ⓘ Screening estimate from a state-policy table — verify with the county assessor before closing.
Climate risk First Street
- Flood 7/10 Severe FEMA zone X (shaded) · 76% chance over 30 yrs
- Wildfire 1/10 Low
- Heat 10/10 Extreme 7 d/yr ≥107°F today · 30 d/yr by 30 yrs out
- Wind 10/10 Extreme 99% chance of damaging wind over 30 yrs
- Air quality 2/10 Low 1 unhealthy d/yr today · 1 by 30 yrs out
Nearby sold comps map
Loading sold comps map…
Walkable amenities ~0.75 mi
Loading nearby amenities…
Taxation est. · year 1
- Rental income
- $24,625
- − Mortgage interest
- −$13,164
- − Property taxes
- −$1,403
- − Insurance
- −$1,972
- − Repairs & maintenance
- −$1,970
- − Management
- −$1,970
- − Depreciation
- −$6,836
- Taxable loss
- −$2,690
- Est. tax savings @ 24.0%
- +$646
- After-tax cash flow
- $1,936/yr
For passive investors: Depreciation is non-cash, so a rental often shows a tax loss while cash-flowing — sheltering income. Rental losses are passive: they offset passive income freely, and up to $25,000/yr can offset ordinary (W-2) income if you actively participate and your MAGI is under $100k (phasing out to $0 by $150k); unused losses carry forward. On sale, claimed depreciation is recaptured at up to 25%, and gains may owe capital-gains tax (a 1031 exchange can defer both). Figures are a year-1 estimate at your 24.0% rate — not tax advice; consult a CPA.
Schools (NCES district)
- District
- Lee
- NCES district ID
- 1201080
- Math proficiency
- 47% ▼ -11.00%
- Reading proficiency
- 50% ▼ -4.00%
- Median HH income
- $49,518
- Composite
- 41.49/100
- National rank
- #3458
- State rank
- #42 of 73 in FL
Livability — Cape Coral
- Score
- 77/100
- State rank
- #208
- US rank
- #3098
Category grades
Schools grade is shown separately in the Schools card above.
Census & demographics
- Census place
- Cape Coral, FL
- County
- Lee County · 788,662 people
- City population
- 217,388
- Metro
- Cape Coral-Fort Myers, FL
- Population (ZIP)
- 33,599
- Household income
- $71,190
- Rent vs Own
- Severe rent burden
- 1182.0
Population outlook (Lee County) Hauer SSP2
- Today (2025)
- 871,946 people
- By 2030
- 955,468 · +9.6%
- By 2040
- 1,113,587 · +27.7%
- By 2050
- 1,256,891 · +44.1%
- By 2075
- 1,560,270 · +78.9%
- By 2100
- 1,726,848 · +98.0%
Race, ethnicity, and origin ACS 2023
- Neighborhood character
- Predominantly White (76%)
- Race & ethnicity
- White 76% Hispanic / Latino 16% Two or more races 11% Black 3% Asian 2%
- Hispanic origin (detail)
- Mexican 2% Puerto Rican 2% Cuban 9%
- Common ancestry
- Romanian 4% Lithuanian 2% Slovak 2%
- Foreign-born
- 14% · Canada, China, Jamaica
- Languages at home
- 82% English-only · Spanish 13% Other Indo-European 1% Chinese 1%
Political lean MEDSL · Lee
- 2024 margin
- Strong R (+28.4) · D 35.5% · R 63.9%
- 2008→2024 swing
- -18.0pp toward R · 2008: -10.4pp · 2024: -28.4pp
- All cycles
- 2024: R+28.4 2020: R+19.2 2016: R+20.4 2012: R+16.6 2008: R+10.4
Not yet ingested
- Civics
- —
Market trends
- HPI YoY
- ▼ -190.05%
- Current HPI
- 266.3458
- Rent YoY
- ▼ -5.48%
- Metro
- Cape Coral-Fort Myers, FL
- State GDP YoY
- ▲ 3.28%
- F500 in state
- 36
Industry mix (Fortune 500 HQ in FL)
| Industry | F500 HQs | Revenue |
|---|---|---|
| Industrial Technology | 2 | $29B |
|
||
| Insurance | 2 | $17B |
|
||
| Retail | 1 | $60B |
|
||
| Technology Distribution | 1 | $58B |
|
||
| Homebuilding | 1 | $35B |
|
||
| Technology Manufacturing | 1 | $35B |
|
||
Price history
+422.2% since first listed4 events — show timeline
- 2026-04-26 Relisted — FORTMLS
- 2026-04-21 Pending — FORTMLS
- 2026-03-21 Listed $235,000 FORTMLS
- 1983-11-01 Sold (Public Records) $45,000 Public Records
Property tax history
+4.5%/yrLatest (2025): $1,403 · +11.2% YoY. Source: county tax records.
Cash-flow waterfall
monthlySold comps — $/sqft
last 12 mo · ≤1 miLoading sold comps…