1912 Oak Valley Rd · Candler-McAfee, GA
Flood risk 4/10 · Minor
- FEMA flood zone
- X (unshaded)
- Chance of flooding over 30 yrs
- 0.22%
- Est. flood insurance / yr
- $507 – $1,088
Fire risk 3/10 · Minor
- Est. fire insurance / yr
- $963 – $1,789
Heat risk 5/10 · Moderate
- Hot days now (above 104°F)
- 7 days/yr
- Hot days in 30 yrs
- 17 days/yr
Wind risk 6/10 · Moderate
- Chance of severe wind over 30 yrs
- 27.0%
Air-quality risk 5/10 · Moderate
- Unhealthy air days now
- 7 days/yr
- Unhealthy air days in 30 yrs
- 10 days/yr
Risk factors via First Street. Map © Google.
Why this score? — see what drove the F grade
The composite is a weighted blend of 9 inputs, each scored 0–100. Each bar is that input's sub-score; the figure is the points it added to the 100-point composite (weight × sub-score).
- Cash flow +15.6/30.0
- DSCR +4.8/10.0
- 1% rule +3.7/10.0
- Rent growth +2.7/5.0
- Livability +2.5/5.0
- Condition / age +2.5/5.0
- Schools +2.1/10.0
- ARV discount +0.0/15.0
- Appreciation +0.0/10.0
$190,000
🖨 Deal sheet 📄 Offer letter ✓ Due diligence
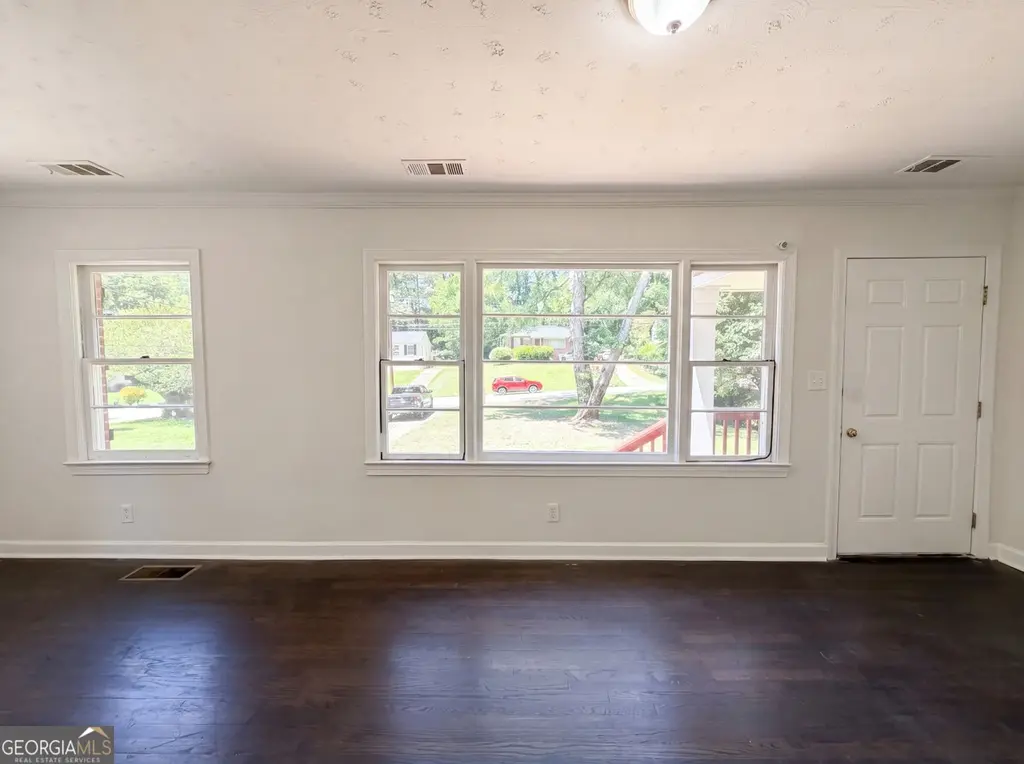
Listing remarks MLS
WONDERFUL MOVE IN CONDITION.WOOD FLRS & NEUTRAL COLORS. NEW CENTRAL AIR W/DEHUMIDY FREATURE.HUE CRAWLSPACE/BSMNT AREA FOR STORAGE.
Key facts
- Modern updates
- Spacious deck
- 0.26 acre lot
Tags
Property features AI
Finance
- Other: Listing accepts Cash, Conventional, and VA financing
- HOA & community: No homeowners association
Exterior
- Parking: No designated parking
- Utilities: Public water; Public sewer; Electricity available
- Home design: Single-family residence; House structure; Resale property
- Construction: Built in 1954; Brick and vinyl siding exterior; Composition roof
- Exterior features: Chain link fenced yard; Fenced
Interior
- Kitchen: Microwave
- Bedrooms: Three bedrooms on the main level
- Flooring: Hardwood floors
- Bathrooms: Two full bathrooms (main level)
- Heating & cooling: Central heating; Central air conditioning
- Interior features: One-level living; Public records list living area as 950; Crawl space foundation; Other interior features
- Laundry & utility: Laundry: other features
Neighborhood map
What this means for you Summary
Snapshot
- This is a 3-bed/1.0-bath single-family listed at $190k.
Deal economics
- At list price, monthly cash flow is $81 ($968/yr) — positive.
- The deal already cash-flows at list — no discount required.
- To meet the 1% rule (rent ≥ 1% of price), the offer needs to be $165k (13.0% below list).
- Recommended offer: $165k (13.0% below list) — sets the bar for 1% rule.
- Cap rate 6.8% vs local median 4.2% in Candler-McAfee — top-decile yield for the area; either an underpriced asset or a hidden risk that comps aren't pricing in. Stress-test before assuming the spread holds.
Location & tenants
- Location reads: area grade F — affects rentability + tenant quality, not the cash-flow math above.
- Dekalb County (suburban): math 19% / reading 28% proficiency, ranked #125 of 174 in GA (top 72%) — low school quality limits family demand, transient renter base, plan for 1-2y turnover; 68% free/reduced lunch — lower-income household profile, screen leases tightly.
- Zoned schools: Canby Lane Elementary School (math 8% / reading 17%, grade F, #1,032 of 1,228 statewide, top 85%, 461 students, 100% FRL); Mary Mcleod Bethune Middle School (math 4% / reading 13%, grade F, #439 of 470 statewide, top 94%, 718 students, 100% FRL); Towers High School (math 2% / reading 12%, grade F, #385 of 424 statewide, top 92%, 764 students, 100% FRL) — zoned schools average 100% FRL vs 68% district-wide (32 pts higher); higher-poverty schools than district average — tighter screening recommended.
- Zoned-school proficiency averages 9% at this address vs 24% district-wide (-14 pts) — the specific schools serving this property underperform the Dekalb County average; the district grade overstates school quality for this exact location.
- Market conditions: Rents flat; 180 active listings in the ZIP; 13 comparable units currently listed for rent nearby; rentals lingering (median 44d on market — plan ~5-8 weeks vacancy on turnover, expect pricing pressure); 62% of comp listings sitting > 30 days — soft ceiling on asking rent; 1,240 units permitted in DeKalb County in 2024 (385 in 5+ unit buildings).
Forward outlook
- Local home prices are declining (-3.0%/yr); year-one equity from $1k of loan paydown is wiped out by about $6k of value loss. Plan a longer hold.
- DeKalb County population projected at +28% by 2050 — long-run rental-demand tailwind backs the buy-and-hold thesis.
Negotiation context
- Only 9 days on market — expect competitive offers; lowballing is unlikely to land.
- 2 sale attempts since 20y ago with the ask held roughly flat each time — persistent listings suggest the price (not the market) is what's stuck; bring a comps-based counter.
Risks & watch-outs
- Watch-outs: built in 1954 — expect roof / HVAC / electrical / plumbing capex.
- Climate carrying-cost: major wind risk, 27% chance of damaging wind over 30y; extreme-heat days projected 7→17/yr by 2055 (HVAC capex compounding) — expect insurance premiums to compound above CPI over the hold.
Questions for the listing agent
- Built in 1954 — when were the roof, HVAC, electrical panel, plumbing, and water heater last replaced?
- Is there a deadline driving the sale (1031 exchange, divorce, estate, relocation)? That informs how much negotiation room exists.
- The area grade is low — what's the realistic commute time and amenity access for the typical tenant pool here? Any planned neighborhood developments (good or bad) we should know about?
- What's the average days-on-market for RENTAL listings here right now (not sales)? A rising rental-DOM trend means longer vacancies and softer asking-rent achievability than the comps imply.
- What's the recent tenant-quality profile in this submarket — average credit score on applications, eviction rate, late-payment / NSF rate, and stable-employment percentage? A property-management company in the area should have these aggregated.
- How much new for-sale + rental construction is in the pipeline within 1–3 miles? Heavy new supply typically softens prices + rents 12–24 months out; constrained supply supports both.
Investment metrics
- 1% rule
- 0.87% ✗
- Cap rate
- 6.80%
- Cash-on-cash
- 1.82%
- DSCR
- 1.08
- GRM
- 9.6
CMA / ARV
- ARV (on-the-fly)
- $152,950
- Comps found
- 12
Show comp detail 12 sales within ~0.75 mi
| Address | Dist | Beds/Ba | Sqft | Sold | Price | $/sf | Match |
|---|---|---|---|---|---|---|---|
| 1969 Oak Valley Rd | 0.14mi | 3/1.0 | 950 (0%) | 6mo | $130,000 | $137 | 88 |
| 4206 Sherwood Ave | 0.09mi | 3/1.0 | 950 (0%) | 11mo | $158,000 | $166 | 86 |
| 1876 Selwyn Dr | 0.11mi | 3/1.0 | 950 (0%) | 11mo | $138,500 | $146 | 86 |
| 4195 Hanes Dr | 0.18mi | 2/1.0 (-1) | 1,008 (+6%) | 1mo | $139,900 | $139 | 76 |
| 4125 Lindsey Dr | 0.24mi | 3/1.0 | 1,008 (+6%) | 6mo | $162,000 | $161 | 74 |
| 4252 Lamar St | 0.44mi | 2/1.0 (-1) | 972 (+2%) | 3mo | $171,500 | $176 | 68 |
| 1802 Elaine Dr | 0.27mi | 2/1.0 (-1) | 1,008 (+6%) | 10mo | $115,000 | $114 | 64 |
| 3932 Lindsey Dr | 0.25mi | 3/1.5 | 1,058 (+11%) | 5mo | $160,500 | $152 | 64 |
| 4439 Highland Rd | 0.66mi | 3/1.0 | 1,008 (+6%) | 4mo | $77,000 | $76 | 56 |
| 1981 Lindsey Ln | 0.29mi | 3/2.0 | 1,056 (+11%) | 12mo | $208,000 | $197 | 54 |
| 2003 Glenwood Downs Dr | 0.58mi | 3/2.0 | 992 (+4%) | 13mo | $175,000 | $176 | 51 |
| 3963 Kirksford Dr | 0.62mi | 3/1.5 | 1,070 (+13%) | 1mo | $180,000 | $168 | 47 |
Match score weights: distance 35% · size 25% · config 20% · recency 20%. Top-matched comps best support the ARV.
Projected returns pro-forma
-3.0% appreciation · 0.87% rent growth · sell at horizon
- IRR
- -15.7%
- Equity multiple
- 0.45×
- Total profit
- $-29,148
- Equity at exit
- $28,330
- IRR
- -11.2%
- Equity multiple
- 0.39×
- Total profit
- $-32,525
- Equity at exit
- $16,428
Cash invested: $53,200 (down + closing). Projections, not guarantees.
Landlord ↔ Tenant lean methodology
- Overall (STATE)
- 90 Strongly Landlord-Friendly
- State Georgia
- 90 Strongly Landlord-Friendly · R+3
- County
- — inherits STATE
- City
- — inherits STATE
ZIP-level market 30035
- Home prices YoY
- -33.8%
- Rents YoY
- 0.9%
- Active inventory
- 180
- Price-to-rent
- 9.6×
Monthly cashflow live
- Estimated rent
- $1,654 high interval (Pro) →
- Mortgage (P&I)
- −$996
- Tax from tax record
- −$150 /mo · $1,802/yr
- Insurance
- −$79
- HOA
- −$0
- Vacancy / Maint / Mgmt
- −$347
- Net cashflow
- $81
Break-even live
UW: 25.0% down · 7.5% · 30yr · 1.5% tax · 5.0% vac · 8.0% maint · 8.0% mgmt
Financing live
Cash to close
- Down payment
- $47,500
- Closing costs
- $5,700
- Reserves months
- —
- Total cash needed
- —
Loan-product check · same deal, 3 products live
Conventional
25% down · 7.5% · 30yr
- Down + closing
- —
- Monthly P&I
- —
- Monthly cashflow
- —
- DSCR
- —
- Eligible?
- —
Personal DTI + credit; lowest rate.
DSCR
20% down · 8.5% · 30yr
- Down + closing
- —
- Monthly P&I
- —
- Monthly cashflow
- —
- DSCR
- —
- Eligible?
- —
No personal income docs; deal must DSCR.
Hard money
10% down · 12.0% · 12mo
- Down + closing
- —
- Monthly P&I
- —
- Monthly cashflow
- —
- DSCR
- —
- Eligible?
- —
Short-term bridge; refi at stabilization.
Rent comps 13 comps
| Address | Beds | Baths | Sqft | Rent | $/sqft | DOM | Units | Dist |
|---|---|---|---|---|---|---|---|---|
| 1802 Lee St Decatur, GA | 3.0 | 1.0 | 912 | $1,350 | $1.48 | 44d | 1 | 0.31mi |
| 1771 Ledo Ave Decatur, GA | 2.0 | 1.0 | 912 | $1,295 | $1.42 | 44d | 1 | 0.35mi |
| 4565 Covington Hwy Decatur, GA | 2.0–3.0 | 1.5 | 1200 | $1,439 | $1.20 | 3d | 8 | 0.58mi |
| 4433 Highland Rd Decatur, GA | 3.0 | 1.0 | 864 | $1,450 | $1.68 | 44d | 1 | 0.62mi |
| 1590 Agape Way Decatur, GA | 1.0–3.0 | 1.0–2.0 | 1022 | $1,400 | $1.37 | 44d | 1 | 0.85mi |
| 200 High Court Pl Decatur, GA | 1.0–3.0 | 1.0–2.0 | 1130 | $1,705 | $1.51 | 2d | 12 | 1.02mi |
| 4225 Wingfoot Ct Decatur, GA | 2.0 | 2.0 | 1120 | $1,600 | $1.43 | 24d | 1 | 1.03mi |
| 3692 Larkspur Ter Decatur, GA | 3.0 | 2.0 | 1100 | $1,700 | $1.55 | 44d | 1 | 1.17mi |
| 3907 Redwing Cir Decatur, GA | 1.0–2.0 | 1.0–2.0 | 836 | $1,149 | $1.37 | 44d | 18 | 1.22mi |
| 4371 Glenwood Rd Decatur, GA | 1.0–3.0 | 1.0–2.0 | 1100 | $1,525 | $1.39 | 44d | 6 | 1.27mi |
| 4371 Glenwood Rd Decatur, GA | 1.0–3.0 | 1.0–2.0 | 1100 | $1,525 | $1.39 | 2d | 9 | 1.27mi |
| 4711 Bishop Ming Blvd Stone Mountain, GA | 1.0–2.0 | 1.0 | 800 | $1,587 | $1.98 | 44d | 1 | 1.32mi |
| 3579 Tulip Dr Decatur, GA | 3.0 | 2.0 | 1075 | $1,550 | $1.44 | 24d | 1 | 1.40mi |
Listing history 15 events
-
2026-06-07status $190,000 Pending 9 DOM
-
2026-06-04days on market $190,000 Active 9 DOM
-
2026-06-03days on market $190,000 Active 8 DOM
-
2026-06-02days on market $190,000 Active 7 DOM
-
2026-06-01days on market $190,000 Active 6 DOM
-
2026-05-31days on market $190,000 Active 5 DOM
-
2026-05-25$190,000 New
-
2026-04-29soldstatus $167,200
-
2017-09-06soldstatus $125,000
-
2007-03-28soldstatus $76,000 134-char remark
Show marketing remark (134 chars)
WONDERFUL MOVE IN CONDITION.WOOD FLRS & NEUTRAL COLORS. NEW CENTRAL AIR W/DEHUMIDY FREATURE.HUE CRAWLSPACE/BSMNT AREA FOR STORAGE.
-
2006-09-06$79,900 134-char remark
Show marketing remark (134 chars)
WONDERFUL MOVE IN CONDITION.WOOD FLRS & NEUTRAL COLORS. NEW CENTRAL AIR W/DEHUMIDY FREATURE.HUE CRAWLSPACE/BSMNT AREA FOR STORAGE.
-
2005-10-04soldstatus $145,000
-
2005-09-07soldstatus $115,000
-
2004-08-02soldstatus $90,000
-
1987-07-08soldstatus $46,000
ⓘ Source: listings_history table (triggers on properties + properties_extension) + one-shot
backfill from property_details.listing_events for pre-trigger history.
Tax reassessment forecast GA · Resets to sale price
- Current annual tax
- $1,802 · $150/mo
- Projected year-2 tax
- $1,802 · $150/mo
- Expected delta
- $0/yr ($0/mo · 0.0%)
ⓘ Screening estimate from a state-policy table — verify with the county assessor before closing.
Climate risk First Street
- Flood 4/10 Moderate FEMA zone X (unshaded) · 22% chance over 30 yrs
- Wildfire 3/10 Moderate
- Heat 5/10 Major 7 d/yr ≥104°F today · 17 d/yr by 30 yrs out
- Wind 6/10 Major 27% chance of damaging wind over 30 yrs
- Air quality 5/10 Major 7 unhealthy d/yr today · 10 by 30 yrs out
Nearby sold comps map
Loading sold comps map…
Walkable amenities ~0.75 mi
Loading nearby amenities…
Taxation est. · year 1
- Rental income
- $19,844
- − Mortgage interest
- −$10,643
- − Property taxes
- −$1,802
- − Insurance
- −$950
- − Repairs & maintenance
- −$1,587
- − Management
- −$1,587
- − Depreciation
- −$5,527
- Taxable loss
- −$2,253
- Est. tax savings @ 24.0%
- +$541
- After-tax cash flow
- $1,509/yr
For passive investors: Depreciation is non-cash, so a rental often shows a tax loss while cash-flowing — sheltering income. Rental losses are passive: they offset passive income freely, and up to $25,000/yr can offset ordinary (W-2) income if you actively participate and your MAGI is under $100k (phasing out to $0 by $150k); unused losses carry forward. On sale, claimed depreciation is recaptured at up to 25%, and gains may owe capital-gains tax (a 1031 exchange can defer both). Figures are a year-1 estimate at your 24.0% rate — not tax advice; consult a CPA.
Schools (NCES district)
- District
- Dekalb County
- NCES district ID
- 1301740
- Math proficiency
- 19% ▼ -12.00%
- Reading proficiency
- 28% ▼ -7.00%
- Median HH income
- $51,448
- Composite
- 20.92/100
- National rank
- #8482
- State rank
- #125 of 174 in GA
Livability — Candler-McAfee
No livability data for this city. (Only ~50 U.S. cities are tracked.)
Census & demographics
- County
- Dekalb County · 782,738 people
- Metro
- Atlanta-Sandy Springs-Alpharetta, GA
- Population (ZIP)
- 21,569
- Household income
- $66,799
- Rent vs Own
- Severe rent burden
- 1304.0
Population outlook (DeKalb County) Hauer SSP2
- Today (2025)
- 839,977 people
- By 2030
- 891,768 · +6.2%
- By 2040
- 988,894 · +17.7%
- By 2050
- 1,074,583 · +27.9%
- By 2075
- 1,245,026 · +48.2%
- By 2100
- 1,303,135 · +55.1%
Race, ethnicity, and origin ACS 2023
- Neighborhood character
- Predominantly Black (91%)
- Race & ethnicity
- Black 91% White 4% Hispanic / Latino 4% Two or more races 3%
- Common ancestry
- Italian 1% Swiss 0%
- Foreign-born
- 12% · Canada, Jamaica
- Languages at home
- 86% English-only · Spanish 4% French/Haitian/Cajun 2%
Political lean MEDSL · DeKalb
- 2024 margin
- Solid D (+64.8) · D 81.9% · R 17.1% · Other 1.0%
- 2008→2024 swing
- +6.1pp toward D · 2008: 58.6pp · 2024: 64.8pp
- All cycles
- 2024: D+64.8 2020: D+67.4 2016: D+64.8 2012: D+56.8 2008: D+58.6
Not yet ingested
- Civics
- —
Market trends
- HPI YoY
- ▼ -111.60%
- Current HPI
- 218.8323
- Rent YoY
- ▲ 0.87%
- Metro
- Atlanta-Sandy Springs-Alpharetta, GA
- State GDP YoY
- ▲ 2.66%
- F500 in state
- 28
Industry mix (Fortune 500 HQ in GA)
| Industry | F500 HQs | Revenue |
|---|---|---|
| Paper / Packaging | 2 | $29B |
|
||
| Retail | 1 | $160B |
|
||
| Transportation / Logistics | 1 | $91B |
|
||
| Airlines | 1 | $62B |
|
||
| Consumer Goods | 1 | $47B |
|
||
| Utilities | 1 | $25B |
|
||
Price history
+313.0% since first listed9 events — show timeline
- 2026-05-25 Listed $190,000 GAMLS
- 2026-04-29 Sold (Public Records) $167,200 Public Records
- 2017-09-06 Sold (Public Records) $125,000 Public Records
- 2007-03-28 Sold (MLS) $76,000 FMLS
- 2006-09-06 Listed $79,900 FMLS
- 2005-10-04 Sold (Public Records) $145,000 Public Records
- 2005-09-07 Sold (Public Records) $115,000 Public Records
- 2004-08-02 Sold (Public Records) $90,000 Public Records
- 1987-07-08 Sold (Public Records) $46,000 Public Records
Property tax history
-0.3%/yrLatest (2025): $1,802 · -3.1% YoY. Source: county tax records.
Cash-flow waterfall
monthlySold comps — $/sqft
last 12 mo · ≤1 miLoading sold comps…