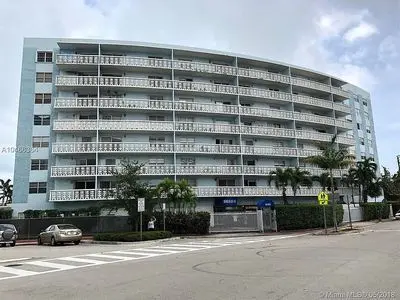
4141 Nautilus Dr · Miami Beach, FL
Flood risk 9/10 · Severe
- FEMA flood zone
- AE
- Chance of flooding over 30 yrs
- 0.99%
- Est. flood insurance / yr
- $1,737 – $8,500
Fire risk 4/10 · Minor
- Est. fire insurance / yr
- $947 – $1,759
Heat risk 10/10 · Severe
- Hot days now (above 101°F)
- 7 days/yr
- Hot days in 30 yrs
- 28 days/yr
Wind risk 10/10 · Severe
- Chance of severe wind over 30 yrs
- 99.0%
Air-quality risk 2/10 · Minimal
- Unhealthy air days now
- 1 days/yr
- Unhealthy air days in 30 yrs
- 1 days/yr
Risk factors via First Street. Map © Google.
Why this score? — see what drove the C- grade
The composite is a weighted blend of 9 inputs, each scored 0–100. Each bar is that input's sub-score; the figure is the points it added to the 100-point composite (weight × sub-score).
- Cash flow +14.6/30.0
- ARV discount +7.5/15.0
- 1% rule +5.9/10.0
- Appreciation +5.5/10.0
- DSCR +4.4/10.0
- Schools +4.2/10.0
- Livability +4.0/5.0
- Condition / age +3.8/5.0
- Rent growth +3.4/5.0
$345,000
🖨 Deal sheet 📄 Offer letter ✓ Due diligence
Listing remarks
Located between Mid-Beach and Biscayne Bay, Nautilus is a tranquil neighborhood in a beautiful waterfront locale. Nautilus is largely residential, featuring an array of houses and apartments available for rent along lush palm-tree-lined avenues. The neighborhood is also home to Mount Sinai Medical Center, making Nautilus a popular choice for many healthcare workers and their families. West 41st Street provides a variety of restaurants, banks, and shops for the community & acirc; & euro; & trade; s convenience. Gorgeous beaches are within close reach of Nautilus, as well as the Miami Beach Golf Club and La Gorce Golf Course. Commuting is a breeze with quick access to Miami Beach
Key facts
- Waterfront locale
- Variety of shops
- Built 1970
Tags
Property features AI
Exterior
- Home design: Built in 1970
- Exterior features: Located in the Nautilus subdivision
Neighborhood map
What this means for you Summary
Snapshot
- This is a 1-bed/2.0-bath condo listed at $345k. Condition is rated good.
Deal economics
- At list price, monthly cash flow is $-347 ($-4k/yr) — negative.
- The deal already cash-flows at list — no discount required.
- Meets the 1% rule at list price ($4k rent vs $345k).
- Cap rate 6.6% vs local median 1.5% in Miami Beach — top-decile yield for the area; either an underpriced asset or a hidden risk that comps aren't pricing in. Stress-test before assuming the spread holds.
Location & tenants
- Location reads 80/100 on livability (#108 in FL, #1,672 nationally) — a professional / high-income tenant draw. Strengths: crime A+, commute A+, health & safety A+; Watch: housing C-, amenities D-, cost of living F.
- Miami-Dade (suburban): math 45% / reading 54% proficiency, ranked #40 of 73 in FL (top 55%) — families likely to look elsewhere, expect single-tenant / working-renter base with shorter leases; 64% free/reduced lunch — lower-income household profile, screen leases tightly.
- Market conditions: Rents rising (+3.5%/yr); 670 active listings in the ZIP; 3 comparable units currently listed for rent nearby; rentals at typical pace (median 20d on market — plan ~3-4 weeks tenant-placement turnaround); solid renter incomes; 10,051 units permitted in Miami-Dade County in 2024 (7,758 in 5+ unit buildings).
- This rent runs 42% of the median local income ($107k/yr) — at the standard rent-burdened threshold; future hikes will face affordability resistance.
Forward outlook
- In year one you build about $6k of equity ($2k loan paydown + $3k appreciation (1.0% local appreciation)).
- Miami-Dade County population projected at +28% by 2050 — long-run rental-demand tailwind backs the buy-and-hold thesis.
- By year 6, paydown + projected appreciation supports a ~$33k cash-out refi (75% LTV) — recoverable capital for the next deal without selling this one.
Negotiation context
- Only 1 days on market — expect competitive offers; lowballing is unlikely to land.
Risks & watch-outs
- Watch-outs: flood insurance adds $427/mo.
- Climate carrying-cost: in FEMA flood zone AE (mandatory federal flood insurance); severe wind risk, 99% chance of damaging wind over 30y; extreme-heat days projected 7→28/yr by 2055 (HVAC capex compounding) — expect insurance premiums to compound above CPI over the hold.
Questions for the listing agent
- What do current leases actually rent for vs. the listed asking? Can we see a recent rent roll and the last 12 months of T-12 income?
- Built in 1970 — when were the roof, HVAC, electrical panel, plumbing, and water heater last replaced?
- What's the actual annual flood-insurance premium (NFIP or private), and is the property in a SFHA with mandatory coverage?
- What does the HOA fee cover, when was the last increase, and are there any pending special assessments or reserve-fund shortfalls?
- Any open or pending special assessments — roof, HVAC, plumbing, elevator, façade? What's the per-unit balance and payoff schedule, and is the seller paying it off at close or rolling it to the buyer?
- Is there a deadline driving the sale (1031 exchange, divorce, estate, relocation)? That informs how much negotiation room exists.
- Schools are A-rated — typically a magnet for longer-tenancy family renters. What's the average tenant stay here, and is there a school-zone premium baked into asking?
- What's the average days-on-market for RENTAL listings here right now (not sales)? A rising rental-DOM trend means longer vacancies and softer asking-rent achievability than the comps imply.
- What's the recent tenant-quality profile in this submarket — average credit score on applications, eviction rate, late-payment / NSF rate, and stable-employment percentage? A property-management company in the area should have these aggregated.
- How much new apartment / multifamily construction is in the pipeline within 1–3 miles? Heavy new supply (>2% of stock underway) typically softens rents 12–24 months out; light construction supports rent growth.
Investment metrics
- 1% rule
- 1.09% ✓
- Cap rate
- 6.57%
- Cash-on-cash
- 0.99%
- DSCR
- 1.04
- GRM
- 7.6
CMA / ARV
No comps found within radius.
Projected returns pro-forma
0.96% appreciation · 3.52% rent growth · sell at horizon
- IRR
- -2.8%
- Equity multiple
- 0.86×
- Total profit
- $-13,604
- Equity at exit
- $117,148
- IRR
- 2.9%
- Equity multiple
- 1.36×
- Total profit
- $34,559
- Equity at exit
- $155,194
Cash invested: $96,600 (down + closing). Projections, not guarantees.
Landlord ↔ Tenant lean methodology
- Overall (STATE)
- 87 Strongly Landlord-Friendly
- State Florida
- 87 Strongly Landlord-Friendly · R+3
- County
- — inherits STATE
- City
- — inherits STATE
ZIP-level market 33140
- Home prices YoY
- 0.3%
- Rents YoY
- 3.5%
- Active inventory
- 670
- Price-to-rent
- 7.6×
Monthly cashflow live
- Estimated rent
- $3,762 medium interval (Pro) →
- Mortgage (P&I)
- −$1,809
- Tax est. 1.5%
- −$431 /mo · $5,175/yr
- Insurance
- −$144
- Flood insurance flood zone
- −$427 /mo · $5,118/yr
- HOA est. from 2 same-building comps
- −$508
- Vacancy / Maint / Mgmt
- −$790
- Net cashflow
- $-347
Break-even live
UW: 25.0% down · 7.5% · 30yr · 1.5% tax · 5.0% vac · 8.0% maint · 8.0% mgmt
Financing live
Cash to close
- Down payment
- $86,250
- Closing costs
- $10,350
- Reserves months
- —
- Total cash needed
- —
Loan-product check · same deal, 3 products live
Conventional
25% down · 7.5% · 30yr
- Down + closing
- —
- Monthly P&I
- —
- Monthly cashflow
- —
- DSCR
- —
- Eligible?
- —
Personal DTI + credit; lowest rate.
DSCR
20% down · 8.5% · 30yr
- Down + closing
- —
- Monthly P&I
- —
- Monthly cashflow
- —
- DSCR
- —
- Eligible?
- —
No personal income docs; deal must DSCR.
Hard money
10% down · 12.0% · 12mo
- Down + closing
- —
- Monthly P&I
- —
- Monthly cashflow
- —
- DSCR
- —
- Eligible?
- —
Short-term bridge; refi at stabilization.
Rent comps 3 comps
| Address | Beds | Baths | Sqft | Rent | $/sqft | DOM | Units | Dist |
|---|---|---|---|---|---|---|---|---|
| 102 24th St Miami Beach, FL | 1.0–3.0 | 1.0–3.0 | 1479 | $19,000 | $12.85 | 19d | 9 | 1.10mi |
| 102 24th St Miami Beach, FL | 1.0–3.0 | 1.0–3.0 | 1479 | $19,000 | $12.85 | 10d | 9 | 1.10mi |
| 2201 Collins Ave Miami Beach, FL | 1.0–3.0 | 1.0–2.0 | 1121 | $22,000 | $19.62 | 24d | 2 | 1.20mi |
HOA detail condo
- Monthly dues
- $0 · $0/yr
- Likely covers
- water
- Assessments
- None detected in remarks — confirm with the listing agent.
Listing history 1 events
-
2026-05-26$345,000 Active
ⓘ Source: listings_history table (triggers on properties + properties_extension) + one-shot
backfill from property_details.listing_events for pre-trigger history.
Climate risk First Street
- Flood 9/10 Extreme FEMA zone AE · 99% chance over 30 yrs
- Wildfire 4/10 Moderate
- Heat 10/10 Extreme 7 d/yr ≥101°F today · 28 d/yr by 30 yrs out
- Wind 10/10 Extreme 99% chance of damaging wind over 30 yrs
- Air quality 2/10 Low 1 unhealthy d/yr today · 1 by 30 yrs out
Nearby sold comps map
Loading sold comps map…
Walkable amenities ~0.75 mi
Loading nearby amenities…
Taxation est. · year 1
- Rental income
- $45,147
- − Mortgage interest
- −$19,325
- − Property taxes
- −$5,175
- − Insurance
- −$6,844
- − Repairs & maintenance
- −$3,612
- − Management
- −$3,612
- − HOA
- −$6,096
- − Depreciation
- −$10,036
- Taxable loss
- −$9,553
- Est. tax savings @ 24.0%
- +$2,293
- After-tax cash flow
- $-1,866/yr
For passive investors: Depreciation is non-cash, so a rental often shows a tax loss while cash-flowing — sheltering income. Rental losses are passive: they offset passive income freely, and up to $25,000/yr can offset ordinary (W-2) income if you actively participate and your MAGI is under $100k (phasing out to $0 by $150k); unused losses carry forward. On sale, claimed depreciation is recaptured at up to 25%, and gains may owe capital-gains tax (a 1031 exchange can defer both). Figures are a year-1 estimate at your 24.0% rate — not tax advice; consult a CPA.
Condition & rehab AI · 1 photo
This condo is in good condition with minimal repairs needed. It offers a good investment opportunity with potential for value enhancement through cosmetic updates and improvements.
Value-add opportunities
- Both Painting the exterior and interior walls — Fresh paint can enhance the curb appeal and interior aesthetics, making the property more attractive to buyers and renters.
- Both Updating the flooring — New flooring can improve the overall look and feel of the property, making it more appealing to both buyers and renters.
- Both Upgrading the HVAC system — A new or upgraded HVAC system can improve comfort and energy efficiency, which is beneficial for both resale and rental value.
- Both Landscaping improvements — Enhancing the landscaping can increase the property's curb appeal and attract more potential buyers and renters.
- Both Interior updates — Updating the interior with modern fixtures and finishes can make the property more attractive and increase its value for both resale and rental purposes.
Renovation cost estimate screening
Value-add ROI direction
- Both Painting the exterior and interior walls — Fresh paint can enhance the curb appeal and interior aesthetics, making the property more attractive to buyers and renters. ↑
- Both Updating the flooring — New flooring can improve the overall look and feel of the property, making it more appealing to both buyers and renters. ↑
- Both Upgrading the HVAC system — A new or upgraded HVAC system can improve comfort and energy efficiency, which is beneficial for both resale and rental value. ↑
- Both Landscaping improvements — Enhancing the landscaping can increase the property's curb appeal and attract more potential buyers and renters. ↑
- Both Interior updates — Updating the interior with modern fixtures and finishes can make the property more attractive and increase its value for both resale and rental purposes. ↑
ⓘ Cost ranges are severity-bucket heuristics (US national rule-of-thumb). Get contractor quotes + a written scope before underwriting a rehab budget.
Schools (NCES district)
- District
- Miami-Dade
- NCES district ID
- 1200390
- Math proficiency
- 45% ▼ -16.00%
- Reading proficiency
- 54% ▼ -5.00%
- Median HH income
- $43,928
- Composite
- 41.76/100
- National rank
- #3397
- State rank
- #40 of 73 in FL
Livability — Miami Beach
- Score
- 80/100
- State rank
- #108
- US rank
- #1672
Category grades
Schools grade is shown separately in the Schools card above.
Census & demographics
- Census place
- Miami Beach, FL
- County
- Miami-Dade County · 2,697,751 people
- City population
- 90,533
- Metro
- Miami-Fort Lauderdale-Pompano Beach, FL
- Population (ZIP)
- 20,342
- Household income
- $107,063
- Rent vs Own
- Severe rent burden
- 870.0
Population outlook (Miami-Dade County) Hauer SSP2
- Today (2025)
- 3,126,439 people
- By 2030
- 3,325,765 · +6.4%
- By 2040
- 3,697,561 · +18.3%
- By 2050
- 4,012,134 · +28.3%
- By 2075
- 4,605,612 · +47.3%
- By 2100
- 4,866,598 · +55.7%
Race, ethnicity, and origin ACS 2023
- Neighborhood character
- Diverse neighborhood (Simpson 0.59)
- Race & ethnicity
- White 46% Hispanic / Latino 44% Two or more races 23% Black 3% Asian 2%
- Hispanic origin (detail)
- Mexican 2% Puerto Rican 2% Cuban 19% Salvadoran 6%
- Common ancestry
- Scotch-Irish 5% Romanian 3% Italian 3%
- Foreign-born
- 44% · Canada, Dominican Republic, Jamaica
- Languages at home
- 43% English-only · Spanish 45% Other Indo-European 6% French/Haitian/Cajun 2%
Political lean MEDSL · Miami-Dade
- 2024 margin
- R (+11.4) · D 43.9% · R 55.4%
- 2008→2024 swing
- -27.6pp toward R · 2008: 16.1pp · 2024: -11.4pp
- All cycles
- 2024: R+11.4 2020: D+7.3 2016: D+29.6 2012: D+23.7 2008: D+16.1
Not yet ingested
- Civics
- —
Market trends
- HPI YoY
- ▲ 0.96%
- Current HPI
- 302.8514
- Rent YoY
- ▲ 3.52%
- Metro
- Miami-Fort Lauderdale-Pompano Beach, FL
- State GDP YoY
- ▲ 3.28%
- F500 in state
- 36
Industry mix (Fortune 500 HQ in FL)
| Industry | F500 HQs | Revenue |
|---|---|---|
| Industrial Technology | 2 | $29B |
|
||
| Insurance | 2 | $17B |
|
||
| Retail | 1 | $60B |
|
||
| Technology Distribution | 1 | $58B |
|
||
| Homebuilding | 1 | $35B |
|
||
| Technology Manufacturing | 1 | $35B |
|
||
Price history
1 event — show timeline
- 2026-05-26 Listed $345,000 FSBO.com
Cash-flow waterfall
monthlySold comps — $/sqft
last 12 mo · ≤1 miLoading sold comps…