35390 Heron Rd · Long Neck, DE
Flood risk 7/10 · Major
- FEMA flood zone
- AE
- Chance of flooding over 30 yrs
- 0.95%
- Est. flood insurance / yr
- $2,026 – $9,024
Fire risk 2/10 · Minimal
- Est. fire insurance / yr
- $476 – $884
Heat risk 8/10 · Major
- Hot days now (above 100°F)
- 7 days/yr
- Hot days in 30 yrs
- 18 days/yr
Wind risk 8/10 · Major
- Chance of severe wind over 30 yrs
- 80.0%
Air-quality risk 2/10 · Minimal
- Unhealthy air days now
- 1 days/yr
- Unhealthy air days in 30 yrs
- 1 days/yr
Risk factors via First Street. Map © Google.
Why this score? — see what drove the C+ grade
The composite is a weighted blend of 9 inputs, each scored 0–100. Each bar is that input's sub-score; the figure is the points it added to the 100-point composite (weight × sub-score).
- Cash flow +30.0/30.0
- 1% rule +10.0/10.0
- DSCR +10.0/10.0
- Livability +3.5/5.0
- Schools +2.9/10.0
- Rent growth +2.5/5.0
- Condition / age +2.5/5.0
- ARV discount +0.0/15.0
- Appreciation +0.0/10.0
$80,000
🖨 Deal sheet (PDF) 📄 Offer letter ✓ Due diligence
Listing remarks
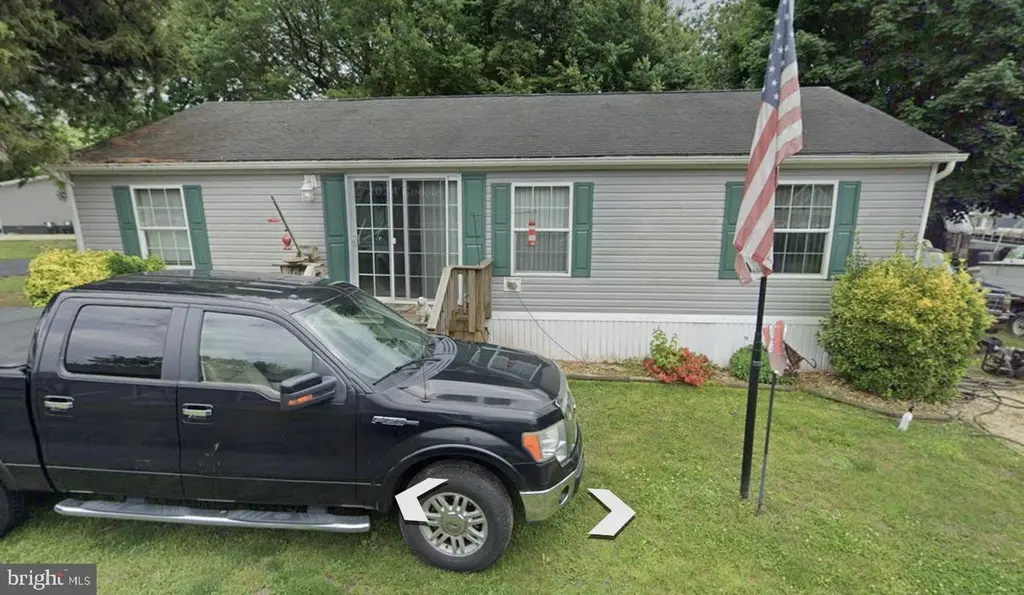
Located in the desirable waterfront community of White House Beach in Millsboro, this 3-bedroom, 2-bath home at 35390 Heron Road presents an affordable opportunity to enjoy the relaxed coastal lifestyle that so many buyers seek. Nestled on a quiet street within the community, the property offers a peaceful setting while still being conveniently close to the Indian River Bay, the community marina, public water access, restaurants, shopping, and the Delaware beaches. Whether you enjoy boating, fishing, kayaking, or simply spending time near the water, this location provides easy access to it all. The home itself is in overall good condition and offers a functional floor plan with comfortable
Key facts
- 332.36 acre lot
- 4 parking spots
- Built 2007
Property features AI
Finance
- Other: Property is land lease ownership interest; Located outside city limits; Park name: White House Beach
- HOA & community: HOA fee $25 annually; Land lease $781 per month (1 year remaining)
Exterior
- Parking: Driveway parking (4 spaces total)
- Utilities: Public water; Public sewer; Propane utility for heating (leased); Electric hot water
- Home design: Manufactured double-wide home; Vinyl siding exterior; North-facing entry
- Construction: Manufactured structure; Asphalt roof; Estimated year built; Made by REDMAN
- Exterior features: Not in a federal flood zone; Other structures both above and below grade
Interior
- Bedrooms: Three bedrooms on the main level
- Flooring: Partially carpeted; Laminate flooring
- Bathrooms: Two full bathrooms (both on the main level)
- Heating & cooling: 90% forced air heating; Propane heating (leased); Central air conditioning (electric)
- Interior features: Partially carpeted and laminated flooring; No basement; Average condition; Main entrance faces north
- Laundry & utility: Washer/dryer hookup
Neighborhood map
What this means for you Summary
Snapshot
- This is a 3-bed/2.0-bath manufactured listed at $80k.
Deal economics
- At list price, monthly cash flow is $846 ($10k/yr) — positive.
- The deal already cash-flows at list — no discount required.
- Meets the 1% rule at list price ($2k rent vs $80k).
- Recommended offer: $78k (3.0% below list) — sets the bar for market timing.
- Cap rate 25.9% vs local median 3.3% in Long Neck — top-decile yield for the area; either an underpriced asset or a hidden risk that comps aren't pricing in. Stress-test before assuming the spread holds.
Location & tenants
- Location reads 69/100 on livability (#30 in DE) — a middle-class / working-renter tenant base. Strengths: cost of living A+, housing A+, crime A-; Watch: employment D+, schools F, amenities F.
- Indian River School District (rural): math 25% / reading 41% proficiency, ranked #14 of 26 in DE (top 54%) — families likely to look elsewhere, expect single-tenant / working-renter base with shorter leases.
- Market conditions: 870 active listings in the ZIP; 1 comparable units currently listed for rent nearby; solid renter incomes; 4,354 units permitted in Sussex County in 2024 (344 in 5+ unit buildings).
- This rent runs 34% of the median local income ($78k/yr) — at the standard rent-burdened threshold; future hikes will face affordability resistance.
Forward outlook
- Local home prices are declining (-3.0%/yr); year-one equity from $553 of loan paydown is wiped out by about $2k of value loss. Plan a longer hold.
- Sussex County population projected at +25% by 2050 — long-run rental-demand tailwind backs the buy-and-hold thesis.
- At projected returns (-3.0% appreciation + 3.0% rent growth), your $22k cash investment doubles in ~3 years — after that, you're playing with house money.
Negotiation context
- It's been on market 38 days — a 3% lower offer ($78k) is reasonable based on typical stale-listing flexibility.
Risks & watch-outs
- Watch-outs: flood insurance adds $460/mo.
- Climate carrying-cost: in FEMA flood zone AE (mandatory federal flood insurance); severe wind risk, 80% chance of damaging wind over 30y; extreme-heat days projected 7→18/yr by 2055 (HVAC capex compounding) — expect insurance premiums to compound above CPI over the hold.
Questions for the listing agent
- It's been on market 38 days. Have you received any prior offers? Is the seller open to a 3% concession, seller financing, or rate buy-down credit?
- What's the actual annual flood-insurance premium (NFIP or private), and is the property in a SFHA with mandatory coverage?
- What does the HOA fee cover, when was the last increase, and are there any pending special assessments or reserve-fund shortfalls?
- Is there a deadline driving the sale (1031 exchange, divorce, estate, relocation)? That informs how much negotiation room exists.
- Schools are F-rated, which usually means shorter tenancies and higher turnover. Who's the typical renter profile here, and what's been the actual vacancy rate?
- What's the average days-on-market for RENTAL listings here right now (not sales)? A rising rental-DOM trend means longer vacancies and softer asking-rent achievability than the comps imply.
- What's the recent tenant-quality profile in this submarket — average credit score on applications, eviction rate, late-payment / NSF rate, and stable-employment percentage? A property-management company in the area should have these aggregated.
- How much new for-sale + rental construction is in the pipeline within 1–3 miles? Heavy new supply typically softens prices + rents 12–24 months out; constrained supply supports both.
Investment metrics
- 1% rule
- 2.81% ✓
- Cap rate
- 25.89%
- Cash-on-cash
- 70.01%
- DSCR
- 4.11
- GRM
- 3.0
CMA / ARV
- ARV (median comp)
- $56,265
- List price
- $80,000
- Delta
- 42.19%
- Verdict
- OVERPRICED
- Comps
- 4 within 1.0 mi
Show comp detail 4 sales within ~0.75 mi
| Address | Dist | Beds/Ba | Sqft | Sold | Price | $/sf | Match |
|---|---|---|---|---|---|---|---|
| 27299 Dinghy Rd #1348 | 0.27mi | 3/2.0 | 1,200 (-3%) | 10mo | $69,000 | $58 | 75 |
| 27287 Seabreeze Rd #5643 | 0.35mi | 2/2.0 (-1) | 1,320 (+7%) | 6mo | $125,000 | $95 | 62 |
| 35317 Fishermans Rd #5751 | 0.25mi | 2/1.5 (-1) | 1,300 (+6%) | 19mo | $62,000 | $48 | 57 |
| 35468 Joann Dr #11511 | 0.57mi | 3/1.0 | 1,260 (+2%) | 11mo | $52,000 | $41 | 56 |
Match score weights: distance 35% · size 25% · config 20% · recency 20%. Top-matched comps best support the ARV.
Projected returns pro-forma
-3.0% appreciation · 3.0% rent growth · sell at horizon
- IRR
- 42.6%
- Equity multiple
- 2.84×
- Total profit
- $41,207
- Equity at exit
- $11,928
- IRR
- 48.8%
- Equity multiple
- 5.75×
- Total profit
- $106,373
- Equity at exit
- $6,917
Cash invested: $22,400 (down + closing). Projections, not guarantees.
Landlord ↔ Tenant lean methodology
- Overall (STATE)
- 70 Landlord-Friendly
- State Delaware
- 70 Landlord-Friendly · D+7
- County
- — inherits STATE
- City
- — inherits STATE
ZIP-level market 19966
- Home prices YoY
- -6.4%
- Active inventory
- 870
- Price-to-rent
- 3.0×
Monthly cashflow live
- Estimated rent
- $2,249 medium interval (Pro) →
- Mortgage (P&I)
- −$420
- Tax from tax record
- −$15 /mo · $183/yr
- Insurance
- −$33
- Flood insurance flood zone
- −$460 /mo · $5,525/yr
- HOA
- −$2
- Vacancy / Maint / Mgmt
- −$472
- Net cashflow
- $846
Break-even live
Sensitivity live
| Price | -10% $892 | -5% $869 | +0% $846 | +5% $824 | +10% $801 |
|---|---|---|---|---|---|
| Rent | -10% $669 | -5% $758 | +0% $846 | +5% $935 | +10% $1,024 |
| Rate | -1.0pp $887 | -0.5pp $867 | base $846 | +0.5pp $826 | +1.0pp $805 |
UW: 25.0% down · 7.5% · 30yr · 1.5% tax · 5.0% vac · 8.0% maint · 8.0% mgmt
Financing live
Cash to close
- Down payment
- $20,000
- Closing costs
- $2,400
- Reserves months
- —
- Total cash needed
- —
Loan-product check · same deal, 3 products live
Conventional
25% down · 7.5% · 30yr
- Down + closing
- —
- Monthly P&I
- —
- Monthly cashflow
- —
- DSCR
- —
- Eligible?
- —
Personal DTI + credit; lowest rate.
DSCR
20% down · 8.5% · 30yr
- Down + closing
- —
- Monthly P&I
- —
- Monthly cashflow
- —
- DSCR
- —
- Eligible?
- —
No personal income docs; deal must DSCR.
Hard money
10% down · 12.0% · 12mo
- Down + closing
- —
- Monthly P&I
- —
- Monthly cashflow
- —
- DSCR
- —
- Eligible?
- —
Short-term bridge; refi at stabilization.
Rent comps 1 comps
| Address | Beds | Baths | Sqft | Rent | $/sqft | DOM | Units | Dist |
|---|---|---|---|---|---|---|---|---|
| 35829 S Gloucester Cir Unit 35829 Long Neck, DE | 3.0 | 2.5 | 1500 | $1,995 | $1.33 | 15d | 1 | 0.39mi |
HOA detail
- Monthly dues
- $2 · $24/yr
- Likely covers
- water
Listing history 17 events
-
2026-06-21days on market $80,000 Active 38 DOM
-
2026-06-18days on market $80,000 Active 35 DOM
-
2026-06-17days on market $80,000 Active 34 DOM
-
2026-06-16days on market $80,000 Active 33 DOM
-
2026-06-15days on market $80,000 Active 32 DOM
-
2026-06-14days on market $80,000 Active 30 DOM
-
2026-06-13days on market $80,000 Active 29 DOM
-
2026-06-10days on market $80,000 Active 27 DOM
-
2026-06-09days on market $80,000 Active 26 DOM
-
2026-06-08days on market $80,000 Active 25 DOM
-
2026-06-07pricedays on market $80,000 Active 24 DOM
-
2026-06-02days on market $85,000 Active 19 DOM
-
2026-06-01days on market $85,000 Active 18 DOM
-
2026-05-31days on market $85,000 Active 17 DOM
-
2026-05-30days on market $85,000 Active 16 DOM
-
2026-05-15$85,000 Active 814-char remark
-
2026-05-03historical $85,000 814-char remark
ⓘ Source: listings_history table (triggers on properties + properties_extension) + one-shot
backfill from property_details.listing_events for pre-trigger history.
Tax reassessment forecast DE · Partial reset (capped growth)
- Current annual tax
- $183 · $15/mo
- Projected year-2 tax
- $323 · $27/mo
- Expected delta
- +$141/yr (+$12/mo · 77.1%)
ⓘ Screening estimate from a state-policy table — verify with the county assessor before closing.
Climate risk First Street
- Flood 7/10 Severe FEMA zone AE · 95% chance over 30 yrs
- Wildfire 2/10 Low
- Heat 8/10 Severe 7 d/yr ≥100°F today · 18 d/yr by 30 yrs out
- Wind 8/10 Severe 80% chance of damaging wind over 30 yrs
- Air quality 2/10 Low 1 unhealthy d/yr today · 1 by 30 yrs out
Nearby sold comps map
Loading sold comps map…
Walkable amenities ~0.75 mi
Loading nearby amenities…
Taxation est. · year 1
- Rental income
- $26,990
- − Mortgage interest
- −$4,481
- − Property taxes
- −$183
- − Insurance
- −$5,925
- − Repairs & maintenance
- −$2,159
- − Management
- −$2,159
- − HOA
- −$24
- − Depreciation
- −$2,327
- Taxable income
- $9,731
- Est. tax owed @ 24.0%
- −$2,336
- After-tax cash flow
- $7,821/yr
For passive investors: Depreciation is non-cash, so a rental often shows a tax loss while cash-flowing — sheltering income. Rental losses are passive: they offset passive income freely, and up to $25,000/yr can offset ordinary (W-2) income if you actively participate and your MAGI is under $100k (phasing out to $0 by $150k); unused losses carry forward. On sale, claimed depreciation is recaptured at up to 25%, and gains may owe capital-gains tax (a 1031 exchange can defer both). Figures are a year-1 estimate at your 24.0% rate — not tax advice; consult a CPA.
Schools (NCES district)
- District
- Indian River School District
- NCES district ID
- 1000680
- Math proficiency
- 25% ▼ -27.00%
- Reading proficiency
- 41% ▼ -17.00%
- Median HH income
- $53,838
- Composite
- 28.99/100
- National rank
- #6620
- State rank
- #14 of 26 in DE
Livability — Long Neck
- Score
- 69/100
- State rank
- #30
- US rank
- #8720
Category grades
Schools grade is shown separately in the Schools card above.
Census & demographics
- Census place
- Long Neck, DE
- County
- Sussex County · 82,708 people
- Metro
- Salisbury, MD-DE
- Population (ZIP)
- 35,884
- Household income
- $78,305
- Rent vs Own
- Severe rent burden
- 464.0
Population outlook (Sussex County) Hauer SSP2
- Today (2025)
- 248,853 people
- By 2030
- 264,464 · +6.3%
- By 2040
- 290,980 · +16.9%
- By 2050
- 311,259 · +25.1%
- By 2075
- 352,488 · +41.6%
- By 2100
- 367,406 · +47.6%
Race, ethnicity, and origin ACS 2023
- Neighborhood character
- Predominantly White (74%)
- Race & ethnicity
- White 74% Hispanic / Latino 11% Black 8% Two or more races 7% Native American 3% Asian 1%
- Hispanic origin (detail)
- Mexican 3%
- Common ancestry
- Romanian 4% Slovak 2% Serbian 1%
- Foreign-born
- 8% · Canada, China
- Languages at home
- 88% English-only · Spanish 9% Other Indo-European 1%
Political lean MEDSL · Sussex
- 2024 margin
- R (+11.0) · D 43.9% · R 54.9% · Other 1.2%
- 2008→2024 swing
- -2.4pp toward R · 2008: -8.6pp · 2024: -11.0pp
- All cycles
- 2024: R+11.0 2020: R+11.2 2016: R+22.0 2012: R+13.0 2008: R+8.6
Not yet ingested
- Civics
- —
Market trends
- HPI YoY
- ▼ -18.26%
- Current HPI
- 268.5609
- Rent YoY
- —
- Metro
- Salisbury, MD-DE
- State GDP YoY
- —
- F500 in state
- 0
Price history
-5.9% since first listed3 events — show timeline
- 2026-06-06 Price Changed $80,000 BRIGHT MLS
- 2026-05-15 Listed $85,000 BRIGHT MLS
- 2026-05-03 Coming Soon $85,000 BRIGHT MLS
Property tax history
-1.7%/yrLatest (2025): $183 · -23.1% YoY. Source: county tax records.
Cash-flow waterfall
monthlySold comps — $/sqft
last 12 mo · ≤1 miLoading sold comps…