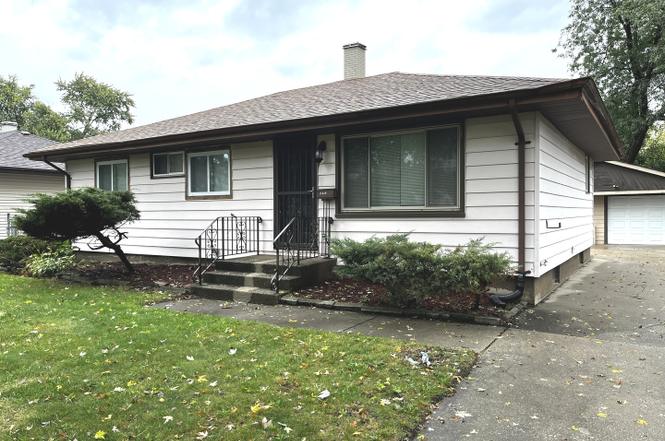
15439 Elm St · South Holland, IL
Flood risk 1/10 · Minimal
- FEMA flood zone
- X (unshaded)
- Chance of flooding over 30 yrs
- 0.0%
- Est. flood insurance / yr
- $473 – $860
Fire risk 1/10 · Minimal
- Est. fire insurance / yr
- $804 – $1,492
Heat risk 3/10 · Minor
- Hot days now (above 101°F)
- 7 days/yr
- Hot days in 30 yrs
- 15 days/yr
Wind risk 2/10 · Minimal
- Chance of severe wind over 30 yrs
- —
Air-quality risk 4/10 · Minor
- Unhealthy air days now
- 4 days/yr
- Unhealthy air days in 30 yrs
- 5 days/yr
Risk factors via First Street. Map © Google.
Why this score? — see what drove the B grade
The composite is a weighted blend of 9 inputs, each scored 0–100. Each bar is that input's sub-score; the figure is the points it added to the 100-point composite (weight × sub-score).
- Cash flow +30.0/30.0
- ARV discount +15.0/15.0
- 1% rule +10.0/10.0
- DSCR +10.0/10.0
- Livability +3.9/5.0
- Rent growth +2.5/5.0
- Condition / age +2.5/5.0
- Schools +0.7/10.0
- Appreciation +0.0/10.0
$162,000
🖨 Deal sheet 📄 Offer letter ✓ Due diligence
Listing remarks
Come see this charming and well-kept 4-bedroom, 2-bath ranch-style home offering comfort, space, and convenience all on one level! The layout features a large living area and an updated kitchen with granite countertops and plenty of cabinet space. The home also includes a partially finished basement ready for your finishing touches for additional living space, a home office, or recreation area. Enjoy year-round comfort with central A/C, a fenced backyard, and the convenience of a 1-car detached garage. Located near shopping, dining, parks, and major expressways, this home combines move-in-ready condition with a great location.
Key facts
- Great location
- Ranch-style home
- Updated kitchen
Tags
Property features AI
Finance
- Other: Fee simple ownership; Interstate access nearby
- HOA & community: No master association fee required
Exterior
- Parking: Detached garage (1 garage space; 1 total parking space)
- Utilities: Public water; Public sewer
- Home design: Detached single-family home; One-story
- Construction: Built 71–80 years ago; Built before 1978
- Exterior features: Aluminum siding; Lot less than 0.25 acre
Interior
- Kitchen: Kitchen on main level (approx. 10 x 15)
- Bedrooms: 4 bedrooms (all on the main level); Bedroom dimensions include 11 x 18 (master), 10 x 12, and two 8 x 10 rooms
- Flooring: Carpet in bedrooms and master
- Bathrooms: 2 full bathrooms
- Heating & cooling: Natural gas forced-air heating; Central air conditioning
- Interior features: Partially finished full basement; 6 total rooms
- Laundry & utility: Dedicated laundry room
Neighborhood map
What this means for you Summary
Snapshot
- This is a 4-bed/1.5-bath single-family listed at $162k.
Deal economics
- At list price, monthly cash flow is $903 ($11k/yr) — positive.
- The deal already cash-flows at list — no discount required.
- Meets the 1% rule at list price ($3k rent vs $162k).
- Cap rate 13.0% vs local median 8.4% in South Holland — top-decile yield for the area; either an underpriced asset or a hidden risk that comps aren't pricing in. Stress-test before assuming the spread holds.
Location & tenants
- Location reads 77/100 on livability (#167 in IL, #3,071 nationally) — a middle-class / working-renter tenant base. Strengths: commute A+, housing A+, cost of living A; Watch: crime C-, amenities C-, schools D+.
- Thornton Twp Hsd 205 (suburban): math 7% / reading 8% proficiency, ranked #594 of 620 in IL (top 96%) — low school quality limits family demand, transient renter base, plan for 1-2y turnover.
- Market conditions: 135 active listings in the ZIP; 10 comparable units currently listed for rent nearby; rentals at typical pace (median 19d on market — plan ~3-4 weeks tenant-placement turnaround); 6,272 units permitted in Cook County in 2024 (4,658 in 5+ unit buildings).
Forward outlook
- Local home prices are declining (-3.0%/yr); year-one equity from $1k of loan paydown is wiped out by about $5k of value loss. Plan a longer hold.
- At projected returns (-3.0% appreciation + 3.0% rent growth), your $45k cash investment doubles in ~6 years — after that, you're playing with house money.
Negotiation context
- Only 7 days on market — expect competitive offers; lowballing is unlikely to land.
- 6 sale attempts since 3y ago; this cycle's ask has dropped $52k (24%) from the opening price — seller is motivated, your offer sets the floor, not the list.
Risks & watch-outs
- Watch-outs: property tax is 4.9% of price; built in 1955 — expect roof / HVAC / electrical / plumbing capex.
Questions for the listing agent
- Built in 1955 — when were the roof, HVAC, electrical panel, plumbing, and water heater last replaced?
- Property tax is high relative to price — has the assessment been appealed recently, and will the sale trigger a re-assessment?
- Is there a deadline driving the sale (1031 exchange, divorce, estate, relocation)? That informs how much negotiation room exists.
- Schools are D-rated, which usually means shorter tenancies and higher turnover. Who's the typical renter profile here, and what's been the actual vacancy rate?
- What's the average days-on-market for RENTAL listings here right now (not sales)? A rising rental-DOM trend means longer vacancies and softer asking-rent achievability than the comps imply.
- What's the recent tenant-quality profile in this submarket — average credit score on applications, eviction rate, late-payment / NSF rate, and stable-employment percentage? A property-management company in the area should have these aggregated.
- How much new for-sale + rental construction is in the pipeline within 1–3 miles? Heavy new supply typically softens prices + rents 12–24 months out; constrained supply supports both.
Investment metrics
- 1% rule
- 1.94% ✓
- Cap rate
- 12.98%
- Cash-on-cash
- 23.88%
- DSCR
- 2.06
- GRM
- 4.3
CMA / ARV
- ARV (on-the-fly)
- $195,075
- Comps found
- 12
Show comp detail 12 sales within ~0.75 mi
| Address | Dist | Beds/Ba | Sqft | Sold | Price | $/sf | Match |
|---|---|---|---|---|---|---|---|
| 15518 Maple St | 0.07mi | 4/2.0 | 1,345 (+6%) | 1mo | $120,000 | $89 | 85 |
| 615 E 156th Pl | 0.37mi | 3/2.0 (-1) | 1,300 (+2%) | 2mo | $198,650 | $153 | 71 |
| 618 E 159th Pl | 0.65mi | 4/2.0 | 1,294 (+2%) | 2mo | $236,000 | $182 | 64 |
| 619 E 152nd St | 0.32mi | 3/1.5 (-1) | 1,146 (-10%) | 1mo | $153,000 | $134 | 62 |
| 15505 Drexel Ave | 0.56mi | 4/2.0 | 1,200 (-6%) | 2mo | $205,000 | $171 | 60 |
| 15444 State St | 0.60mi | 3/2.5 (-1) | 1,254 (-2%) | 2mo | $207,000 | $165 | 58 |
| 746 E 157th St | 0.46mi | 4/2.0 | 1,403 (+10%) | 3mo | $180,000 | $128 | 57 |
| 717 E 154th St | 0.33mi | 3/1.0 (-1) | 1,120 (-12%) | 2mo | $177,000 | $158 | 56 |
| 64 E 158th Pl | 0.66mi | 3/2.5 (-1) | 1,250 (-2%) | 3mo | $185,000 | $148 | 55 |
| 15265 Drexel Ave | 0.66mi | 3/2.0 (-1) | 1,344 (+5%) | 2mo | $155,000 | $115 | 51 |
| 34 E 159th St | 0.75mi | 3/1.5 (-1) | 1,378 (+8%) | 2mo | $244,900 | $178 | 45 |
| 15061 Wabash Ave | 0.69mi | 3/1.5 (-1) | 1,116 (-12%) | 2mo | $150,000 | $134 | 40 |
Match score weights: distance 35% · size 25% · config 20% · recency 20%. Top-matched comps best support the ARV.
Projected returns pro-forma
-3.0% appreciation · 3.0% rent growth · sell at horizon
- IRR
- 17.2%
- Equity multiple
- 1.70×
- Total profit
- $31,578
- Equity at exit
- $24,155
- IRR
- 25.8%
- Equity multiple
- 3.27×
- Total profit
- $102,876
- Equity at exit
- $14,007
Cash invested: $45,360 (down + closing). Projections, not guarantees.
Landlord ↔ Tenant lean methodology
- Overall (STATE)
- 43 Moderately Tenant-Leaning
- State Illinois
- 43 Moderately Tenant-Leaning · D+7
- County
- — inherits STATE
- City
- — inherits STATE
ZIP-level market 60473
- Active inventory
- 135
- Price-to-rent
- 4.3×
Monthly cashflow live
- Estimated rent
- $3,141 high interval (Pro) →
- Mortgage (P&I)
- −$850
- Tax from tax record
- −$661 /mo · $7,936/yr
- Insurance
- −$68
- HOA
- −$0
- Vacancy / Maint / Mgmt
- −$660
- Net cashflow
- $903
Break-even live
UW: 25.0% down · 7.5% · 30yr · 1.5% tax · 5.0% vac · 8.0% maint · 8.0% mgmt
Financing live
Cash to close
- Down payment
- $40,500
- Closing costs
- $4,860
- Reserves months
- —
- Total cash needed
- —
Loan-product check · same deal, 3 products live
Conventional
25% down · 7.5% · 30yr
- Down + closing
- —
- Monthly P&I
- —
- Monthly cashflow
- —
- DSCR
- —
- Eligible?
- —
Personal DTI + credit; lowest rate.
DSCR
20% down · 8.5% · 30yr
- Down + closing
- —
- Monthly P&I
- —
- Monthly cashflow
- —
- DSCR
- —
- Eligible?
- —
No personal income docs; deal must DSCR.
Hard money
10% down · 12.0% · 12mo
- Down + closing
- —
- Monthly P&I
- —
- Monthly cashflow
- —
- DSCR
- —
- Eligible?
- —
Short-term bridge; refi at stabilization.
Rent comps 10 comps
| Address | Beds | Baths | Sqft | Rent | $/sqft | DOM | Units | Dist |
|---|---|---|---|---|---|---|---|---|
| 15509 Park Ln South Holland, IL | 4.0 | 1.5 | 1200 | $3,400 | $2.83 | 24d | 1 | 0.16mi |
| 15509 Park Ln South Holland, IL | 4.0 | 1.5 | 1200 | $3,400 | $2.83 | 7d | 1 | 0.16mi |
| 14916 Langley Ave Dolton, IL | 3.0 | 1.5 | 1418 | $2,500 | $1.76 | 24d | 1 | 0.73mi |
| 15231 Hastings Dr Dolton, IL | 4.0 | 1.5 | 1487 | $2,146 | $1.44 | 7d | 1 | 1.03mi |
| 14844 Wabash Ave Dolton, IL | 3.0 | 1.5 | 1277 | $2,320 | $1.82 | 24d | 1 | 1.07mi |
| 16001 Avalon Ave South Holland, IL | 3.0 | 2.0 | 1136 | $3,330 | $2.93 | 6d | 1 | 1.19mi |
| 16246 Dobson Ave South Holland, IL | 3.0 | 2.0 | 1250 | $3,170 | $2.54 | 2d | 1 | 1.22mi |
| 15707 Dante Dr South Holland, IL | 3.0 | 2.0 | 1800 | $2,950 | $1.64 | 2d | 1 | 1.26mi |
| 14305 Irving Ave Unit 2 Dolton, IL | 3.0 | 1.0 | 1100 | $2,200 | $2.00 | 24d | 1 | 1.46mi |
| 14716 Dorchester Ave Dolton, IL | 3.0 | 2.0 | 1250 | $2,800 | $2.24 | 19d | 1 | 1.49mi |
Listing history 50 events
-
2026-06-18price $162,000 Active 7 DOM
-
2026-06-18days on market $167,000 Active 7 DOM
-
2026-06-17days on market $167,000 Active 6 DOM
-
2026-06-16days on market $167,000 Active 5 DOM
-
2026-06-15days on market $167,000 Active 4 DOM
-
2026-06-13days on market $167,000 Active 2 DOM
-
2026-06-13days on market $167,000 Active 1 DOM
-
2026-06-09days on market $167,000 Active 229 DOM
-
2026-06-08days on market $167,000 Active 228 DOM
-
2026-06-07days on market $167,000 Active 227 DOM
-
2026-06-04days on market $167,000 Active 224 DOM
-
2026-06-03days on market $167,000 Active 223 DOM
-
2026-06-02days on market $167,000 Active 222 DOM
-
2026-06-01days on market $167,000 Active 221 DOM
-
2026-05-31days on market $167,000 Active 220 DOM
-
2026-05-22price $167,000
-
2026-04-24price $172,000
-
2026-03-27price $176,000
-
2026-02-27price $181,000
-
2026-01-30price $187,000
-
2026-01-09price $193,000
-
2025-12-05price $199,000
-
2025-11-14price $205,000
-
2025-10-23$214,000 Active
-
2025-08-22historical $1,970
-
2025-08-20$1,970
-
2024-01-14historical $1,345
-
2024-01-12historical $1,345
-
2024-01-10price $1,345
-
2024-01-07price $1,395
-
2024-01-06price $1,395
-
2023-12-28price $1,420
-
2023-12-28price $1,420
-
2023-12-14price $1,485
-
2023-12-07price $1,485
-
2023-11-30price $1,540
-
2023-11-30price $1,540
-
2023-11-16$1,595
-
2023-11-16$1,595
-
2023-10-29historical $1,595
-
2023-10-26historical $1,595
-
2023-10-21price $1,595
-
2023-10-21price $1,595
-
2023-10-20price $2,035
-
2023-10-17price $2,035
-
2023-10-14price $2,095
-
2023-10-13price $2,095
-
2023-10-11price $2,075
-
2023-10-10price $2,075
-
2023-10-07price $1,885
ⓘ Source: listings_history table (triggers on properties + properties_extension) + one-shot
backfill from property_details.listing_events for pre-trigger history.
Tax reassessment forecast IL · Partial reset (capped growth)
- Current annual tax
- $7,936 · $661/mo
- Projected year-2 tax
- $7,936 · $661/mo
- Expected delta
- $0/yr ($0/mo · 0.0%)
ⓘ Screening estimate from a state-policy table — verify with the county assessor before closing.
Climate risk First Street
- Flood 1/10 Low FEMA zone X (unshaded) · 0% chance over 30 yrs
- Wildfire 1/10 Low
- Heat 3/10 Moderate 7 d/yr ≥101°F today · 15 d/yr by 30 yrs out
- Wind 2/10 Low
- Air quality 4/10 Moderate 4 unhealthy d/yr today · 5 by 30 yrs out
Nearby sold comps map
Loading sold comps map…
Walkable amenities ~0.75 mi
Loading nearby amenities…
Taxation est. · year 1
- Rental income
- $37,689
- − Mortgage interest
- −$9,075
- − Property taxes
- −$7,936
- − Insurance
- −$810
- − Repairs & maintenance
- −$3,015
- − Management
- −$3,015
- − Depreciation
- −$4,713
- Taxable income
- $9,125
- Est. tax owed @ 24.0%
- −$2,190
- After-tax cash flow
- $8,644/yr
For passive investors: Depreciation is non-cash, so a rental often shows a tax loss while cash-flowing — sheltering income. Rental losses are passive: they offset passive income freely, and up to $25,000/yr can offset ordinary (W-2) income if you actively participate and your MAGI is under $100k (phasing out to $0 by $150k); unused losses carry forward. On sale, claimed depreciation is recaptured at up to 25%, and gains may owe capital-gains tax (a 1031 exchange can defer both). Figures are a year-1 estimate at your 24.0% rate — not tax advice; consult a CPA.
Schools (NCES district)
- District
- Thornton Twp Hsd 205
- NCES district ID
- 1738970
- Math proficiency
- 7% ▬ 0.00%
- Reading proficiency
- 8% ▼ -2.00%
- Median HH income
- $43,392
- Composite
- 6.92/100
- National rank
- #9976
- State rank
- #594 of 620 in IL
Livability — South Holland
- Score
- 77/100
- State rank
- #167
- US rank
- #3071
Category grades
Schools grade is shown separately in the Schools card above.
Census & demographics
- Census place
- South Holland, IL
- City population
- 21,407
- Population (ZIP)
- 21,407
Population outlook (Cook County) Hauer SSP2
- Today (2025)
- 5,347,519 people
- By 2030
- 5,357,703 · +0.2%
- By 2040
- 5,324,924 · -0.4%
- By 2050
- 5,230,762 · -2.2%
- By 2075
- 4,785,735 · -10.5%
- By 2100
- 4,188,836 · -21.7%
Race, ethnicity, and origin ACS 2023
- Neighborhood character
- Predominantly Black (75%)
- Race & ethnicity
- Black 75% White 10% Hispanic / Latino 10% Two or more races 3% Asian 1%
- Hispanic origin (detail)
- Mexican 9% Puerto Rican 1%
- Common ancestry
- Iranian 3% Romanian 2%
- Foreign-born
- 6% · Canada, China
- Languages at home
- 87% English-only · Spanish 8% Other Asian/Pacific 1% Russian/Polish/Slavic 1%
Political lean MEDSL · Cook
- 2024 margin
- Solid D (+42.0) · D 70.4% · R 28.4% · Other 1.2%
- 2008→2024 swing
- -11.4pp toward R · 2008: 53.4pp · 2024: 42.0pp
- All cycles
- 2024: D+42.0 2020: D+50.3 2016: D+53.0 2012: D+49.4 2008: D+53.4
Not yet ingested
- Civics
- —
Market trends
- HPI YoY
- ▼ -114.36%
- Current HPI
- 201.2479
- Rent YoY
- —
- Metro
- —
- State GDP YoY
- ▲ 1.59%
- F500 in state
- 60
Industry mix (Fortune 500 HQ in IL)
| Industry | F500 HQs | Revenue |
|---|---|---|
| Insurance | 4 | $201B |
|
||
| Consumer Goods | 4 | $87B |
|
||
| Industrial Machinery | 3 | $64B |
|
||
| Healthcare | 2 | $55B |
|
||
| Retail / Pharmacy | 1 | $148B |
|
||
| Agriculture / Food | 1 | $86B |
|
||
Price history
+156.9% since first listed46 events — show timeline
- 2026-05-22 Price Changed $167,000 MRED as Distributed by MLS Grid
- 2026-04-24 Price Changed $172,000 MRED as Distributed by MLS Grid
- 2026-03-27 Price Changed $176,000 MRED as Distributed by MLS Grid
- 2026-02-27 Price Changed $181,000 MRED as Distributed by MLS Grid
- 2026-01-30 Price Changed $187,000 MRED as Distributed by MLS Grid
- 2026-01-09 Price Changed $193,000 MRED as Distributed by MLS Grid
- 2025-12-05 Price Changed $199,000 MRED as Distributed by MLS Grid
- 2025-11-14 Price Changed $205,000 MRED as Distributed by MLS Grid
- 2025-10-23 Listed $214,000 MRED as Distributed by MLS Grid
- 2025-08-22 Rental Removed $1,970 RENTLY
- 2025-08-20 Listed for Rent $1,970 RENTLY
- 2024-01-14 Rental Removed $1,345 RENTLY
- 2024-01-12 Rental Removed $1,345 RENT.
- 2024-01-10 Price Changed $1,345 RENTLY
- 2024-01-07 Price Changed $1,395 RENTLY
- 2024-01-06 Price Changed $1,395 RENT.
- 2023-12-28 Price Changed $1,420 RENTLY
- 2023-12-28 Price Changed $1,420 RENT.
- 2023-12-14 Price Changed $1,485 RENTLY
- 2023-12-07 Price Changed $1,485 RENT.
- 2023-11-30 Price Changed $1,540 RENTLY
- 2023-11-30 Price Changed $1,540 RENT.
- 2023-11-16 Listed for Rent $1,595 RENT.
- 2023-11-16 Listed for Rent $1,595 RENTLY
- 2023-10-29 Rental Removed $1,595 RENTLY
- 2023-10-26 Rental Removed $1,595 RENT.
- 2023-10-21 Price Changed $1,595 RENT.
- 2023-10-21 Price Changed $1,595 RENTLY
- 2023-10-20 Price Changed $2,035 RENTLY
- 2023-10-17 Price Changed $2,035 RENT.
- 2023-10-14 Price Changed $2,095 RENTLY
- 2023-10-13 Price Changed $2,095 RENT.
- 2023-10-11 Price Changed $2,075 RENTLY
- 2023-10-10 Price Changed $2,075 RENT.
- 2023-10-07 Price Changed $1,885 RENTLY
- 2023-10-06 Price Changed $1,885 RENT.
- 2023-10-05 Price Changed $1,945 RENTLY
- 2023-10-04 Price Changed $1,945 RENT.
- 2023-09-29 Price Changed $2,085 RENT.
- 2023-09-29 Price Changed $2,085 RENTLY
- 2023-09-27 Price Changed $2,125 RENTLY
- 2023-09-26 Price Changed $2,125 RENT.
- 2023-09-23 Listed for Rent $2,053 RENTLY
- 2023-09-22 Listed for Rent $2,053 RENT.
- 2018-11-08 Sold (Public Records) $1,510,500 Public Records
- 2014-10-06 Sold (Public Records) $65,000 Public Records
Property tax history
+12.8%/yrLatest (2023): $7,936 · +42.2% YoY. Source: county tax records.
Cash-flow waterfall
monthlySold comps — $/sqft
last 12 mo · ≤1 miLoading sold comps…