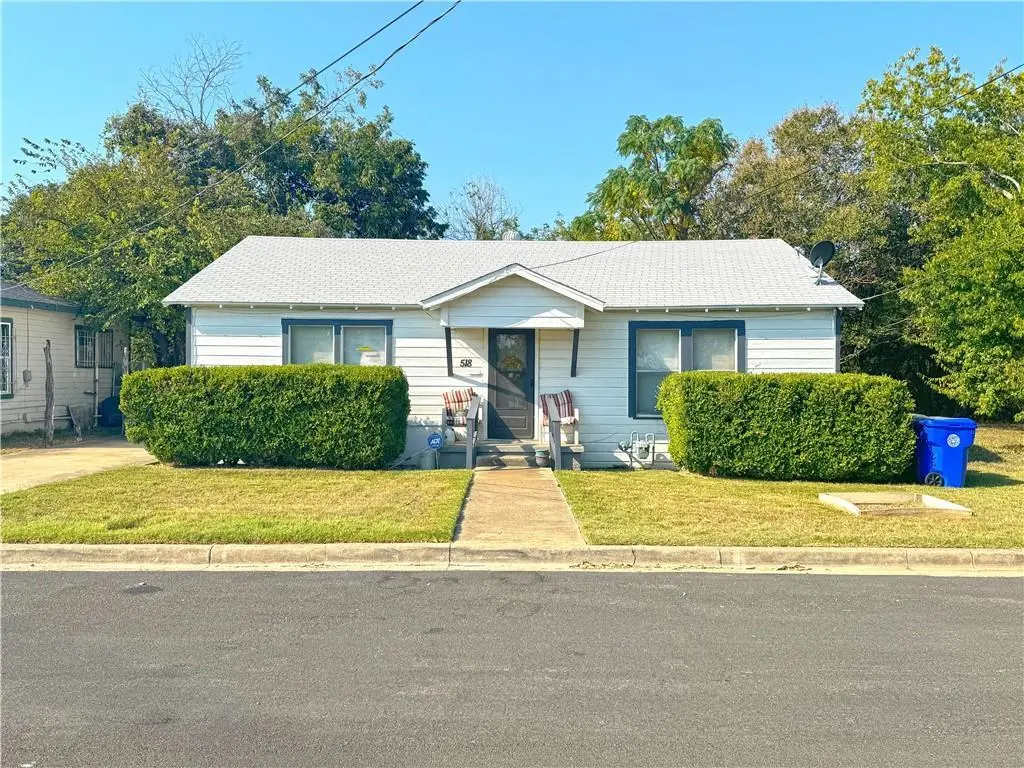
518 Walker St · Waco, TX
Flood risk 6/10 · Moderate
- FEMA flood zone
- X (unshaded)
- Chance of flooding over 30 yrs
- 0.74%
- Est. flood insurance / yr
- $507 – $1,088
Fire risk 5/10 · Moderate
- Est. fire insurance / yr
- $1,222 – $2,270
Heat risk 7/10 · Major
- Hot days now (above 109°F)
- 7 days/yr
- Hot days in 30 yrs
- 25 days/yr
Wind risk 6/10 · Moderate
- Chance of severe wind over 30 yrs
- 56.0%
Air-quality risk 2/10 · Minimal
- Unhealthy air days now
- 0 days/yr
- Unhealthy air days in 30 yrs
- 1 days/yr
Risk factors via First Street. Map © Google.
Why this score? — see what drove the C+ grade
The composite is a weighted blend of 9 inputs, each scored 0–100. Each bar is that input's sub-score; the figure is the points it added to the 100-point composite (weight × sub-score).
- Cash flow +25.7/30.0
- DSCR +8.6/10.0
- ARV discount +6.9/15.0
- 1% rule +6.7/10.0
- Livability +3.7/5.0
- Appreciation +2.5/10.0
- Rent growth +2.5/5.0
- Condition / age +2.5/5.0
- Schools +1.8/10.0
$109,000
🖨 Deal sheet (PDF) 📄 Offer letter ✓ Due diligence
Listing remarks MLS
This 3/1 has great potential for maximizing rental income. Property has a long-term tenant. This property can be sold as a one-off or grouped with other properties as an investment package. For further details, please ask.
Key facts
- 7,841 sq ft lot
- Built 1945
- Listed 432 days
Neighborhood map
What this means for you Summary
Snapshot
- This is a 2-bed/1.0-bath single-family listed at $109k.
Deal economics
- At list price, monthly cash flow is $261 ($3k/yr) — positive.
- The deal already cash-flows at list — no discount required.
- Meets the 1% rule at list price ($1k rent vs $109k).
- Recommended offer: $96k (12.0% below list) — sets the bar for market timing.
- Cap rate 9.2% vs local median 3.9% in Waco — top-decile yield for the area; either an underpriced asset or a hidden risk that comps aren't pricing in. Stress-test before assuming the spread holds.
Location & tenants
- Location reads 74/100 on livability (#166 in TX, #4,378 nationally) — a middle-class / working-renter tenant base. Strengths: cost of living A+, housing A+, health & safety A+; Watch: schools D, crime D, commute F.
- Waco ISD (urban): math 20% / reading 24% proficiency, ranked #773 of 826 in TX (top 94%) — low school quality limits family demand, transient renter base, plan for 1-2y turnover; 81% free/reduced lunch — lower-income household profile, screen leases tightly.
- Market conditions: 86 active listings in the ZIP; 23 comparable units currently listed for rent nearby; rentals at typical pace (median 15d on market — plan ~3-4 weeks tenant-placement turnaround); lower-income renter base — watch delinquency; 1,014 units permitted in McLennan County in 2024 (200 in 5+ unit buildings).
- At $1,279/mo this rent would consume 51% of the median local household income ($30k/yr) (locally 603% of renters already pay >50% of income on rent) — very limited rent-growth headroom before tenants either downsize or default.
Forward outlook
- Local home prices are declining (-3.0%/yr); year-one equity from $754 of loan paydown is wiped out by about $3k of value loss. Plan a longer hold.
- McLennan County population projected at +17% by 2050 — long-run rental-demand tailwind backs the buy-and-hold thesis.
Negotiation context
- It's been on market 433 days — a 12% lower offer ($96k) is reasonable based on typical stale-listing flexibility.
- 4 sale attempts since 6y ago with the ask held roughly flat each time — persistent listings suggest the price (not the market) is what's stuck; bring a comps-based counter.
- Current owner paid $51k; list at $109k implies a 114% gain — meaningful room to come down on a strong offer.
Risks & watch-outs
- Watch-outs: built in 1945 — expect roof / HVAC / electrical / plumbing capex.
- Climate carrying-cost: major flood risk; major wind risk, 56% chance of damaging wind over 30y; moderate wildfire risk; extreme-heat days projected 7→25/yr by 2055 (HVAC capex compounding) — expect insurance premiums to compound above CPI over the hold.
Questions for the listing agent
- It's been on market 433 days. Have you received any prior offers? Is the seller open to a 12% concession, seller financing, or rate buy-down credit?
- Built in 1945 — when were the roof, HVAC, electrical panel, plumbing, and water heater last replaced?
- Why hasn't it sold? Are there any deal-killer items the seller is aware of (foundation, flood, title, zoning, code violations)?
- Is there a deadline driving the sale (1031 exchange, divorce, estate, relocation)? That informs how much negotiation room exists.
- Schools are D-rated, which usually means shorter tenancies and higher turnover. Who's the typical renter profile here, and what's been the actual vacancy rate?
- Crime grade is D in this area — have there been break-ins, vandalism, or insurance claims at this property in the last 3 years? What carrier currently insures it and at what premium?
- What's the average days-on-market for RENTAL listings here right now (not sales)? A rising rental-DOM trend means longer vacancies and softer asking-rent achievability than the comps imply.
- What's the recent tenant-quality profile in this submarket — average credit score on applications, eviction rate, late-payment / NSF rate, and stable-employment percentage? A property-management company in the area should have these aggregated.
- How much new for-sale + rental construction is in the pipeline within 1–3 miles? Heavy new supply typically softens prices + rents 12–24 months out; constrained supply supports both.
Investment metrics
- 1% rule
- 1.17% ✓
- Cap rate
- 9.17%
- Cash-on-cash
- 10.28%
- DSCR
- 1.46
- GRM
- 7.1
CMA / ARV
- ARV (median comp)
- $107,452
- List price
- $109,000
- Delta
- 1.44%
- Verdict
- FAIR
- Comps
- 20 within 1.0 mi
Show comp detail 12 sales within ~0.75 mi
| Address | Dist | Beds/Ba | Sqft | Sold | Price | $/sf | Match |
|---|---|---|---|---|---|---|---|
| 518 Hatton St | 0.07mi | 3/2.0 (+1) | 1,061 (-0%) | 2mo | $179,000 | $169 | 86 |
| 625 Walker St | 0.16mi | 3/2.0 (+1) | 1,028 (-3%) | 6mo | $209,900 | $204 | 73 |
| 325 Phillips St | 0.20mi | 3/1.0 (+1) | 1,036 (-3%) | 11mo | $129,000 | $125 | 72 |
| 1222 Chestnut St | 0.32mi | 3/1.5 (+1) | 1,080 (+2%) | 9mo | $115,000 | $106 | 68 |
| 504 Garrison St | 0.55mi | 2/1.0 | 1,032 (-3%) | 6mo | $69,900 | $68 | 64 |
| 604 Garrison St | 0.57mi | 2/1.0 | 960 (-10%) | 0mo | $114,900 | $120 | 57 |
| 1317 Seley St | 0.43mi | 3/2.0 (+1) | 1,100 (+3%) | 12mo | $199,900 | $182 | 56 |
| 1130 Kellum St | 0.46mi | 2/2.0 | 926 (-13%) | 4mo | $160,000 | $173 | 50 |
| 1144 Faulkner Ln | 0.64mi | 3/1.0 (+1) | 972 (-9%) | 8mo | $162,000 | $167 | 44 |
| 1124 Texas St | 0.42mi | 3/2.0 (+1) | 1,216 (+14%) | 6mo | $230,000 | $189 | 42 |
| 1106 Chestnut St | 0.51mi | 3/1.0 (+1) | 1,204 (+13%) | 9mo | $165,000 | $137 | 42 |
| 521 E Lee St | 0.59mi | 2/2.0 | 1,200 (+13%) | 9mo | $139,900 | $117 | 40 |
Match score weights: distance 35% · size 25% · config 20% · recency 20%. Top-matched comps best support the ARV.
Projected returns pro-forma
-3.0% appreciation · 3.0% rent growth · sell at horizon
- IRR
- -0.9%
- Equity multiple
- 0.97×
- Total profit
- $-997
- Equity at exit
- $16,252
- IRR
- 8.8%
- Equity multiple
- 1.68×
- Total profit
- $20,638
- Equity at exit
- $9,424
Cash invested: $30,520 (down + closing). Projections, not guarantees.
Landlord ↔ Tenant lean methodology
- Overall (STATE)
- 87 Strongly Landlord-Friendly
- State Texas
- 87 Strongly Landlord-Friendly · R+5
- County
- — inherits STATE
- City
- — inherits STATE
ZIP-level market 76704
- Home prices YoY
- -2.7%
- Active inventory
- 86
- Price-to-rent
- 7.1×
Monthly cashflow live
- Estimated rent
- $1,279 high interval (Pro) →
- Mortgage (P&I)
- −$572
- Tax from tax record
- −$132 /mo · $1,579/yr
- Insurance
- −$45
- HOA
- −$0
- Vacancy / Maint / Mgmt
- −$268
- Net cashflow
- $261
Break-even live
Sensitivity live
| Price | -10% $323 | -5% $292 | +0% $261 | +5% $231 | +10% $200 |
|---|---|---|---|---|---|
| Rent | -10% $160 | -5% $211 | +0% $261 | +5% $312 | +10% $362 |
| Rate | -1.0pp $316 | -0.5pp $289 | base $261 | +0.5pp $233 | +1.0pp $204 |
UW: 25.0% down · 7.5% · 30yr · 1.5% tax · 5.0% vac · 8.0% maint · 8.0% mgmt
Financing live
Cash to close
- Down payment
- $27,250
- Closing costs
- $3,270
- Reserves months
- —
- Total cash needed
- —
Loan-product check · same deal, 3 products live
Conventional
25% down · 7.5% · 30yr
- Down + closing
- —
- Monthly P&I
- —
- Monthly cashflow
- —
- DSCR
- —
- Eligible?
- —
Personal DTI + credit; lowest rate.
DSCR
20% down · 8.5% · 30yr
- Down + closing
- —
- Monthly P&I
- —
- Monthly cashflow
- —
- DSCR
- —
- Eligible?
- —
No personal income docs; deal must DSCR.
Hard money
10% down · 12.0% · 12mo
- Down + closing
- —
- Monthly P&I
- —
- Monthly cashflow
- —
- DSCR
- —
- Eligible?
- —
Short-term bridge; refi at stabilization.
Rent comps 23 comps
| Address | Beds | Baths | Sqft | Rent | $/sqft | DOM | Units | Dist |
|---|---|---|---|---|---|---|---|---|
| 413 Lottie St Unit B Waco, TX | 3.0 | 2.0 | 872 | $1,025 | $1.18 | 14d | 1 | 0.11mi |
| 1319 Tabor St Waco, TX | 3.0 | 1.5 | 1234 | $1,700 | $1.38 | 14d | 1 | 0.20mi |
| 1226 Chestnut St Unit A Waco, TX | 3.0 | 2.0 | 980 | $925 | $0.94 | 22d | 1 | 0.28mi |
| 923 Burgan St Unit A Waco, TX | 3.0 | 2.0 | 872 | $1,015 | $1.16 | 14d | 1 | 0.28mi |
| 925 Burgan St Unit A Waco, TX | 3.0 | 2.0 | 872 | $999 | $1.15 | 14d | 1 | 0.29mi |
| 916 Olive St Waco, TX | 3.0 | 2.0 | 1028 | $1,475 | $1.43 | 14d | 1 | 0.34mi |
| 1107 Chestnut St Waco, TX | 2.0 | 1.0 | 928 | $1,300 | $1.40 | 22d | 1 | 0.48mi |
| 932 Dawson St Waco, TX | 3.0 | 2.0 | 1028 | $1,449 | $1.41 | 14d | 1 | 0.51mi |
| 825 Garrison St Waco, TX | 3.0 | 2.0 | 1028 | $1,370 | $1.33 | 14d | 1 | 0.56mi |
| 1013 Earle Ave Waco, TX | 3.0 | 2.0 | 1028 | $1,525 | $1.48 | 22d | 1 | 0.70mi |
| 1008 E Pecan Ave Waco, TX | 3.0 | 1.0 | 1400 | $1,350 | $0.96 | 14d | 1 | 0.73mi |
| 1212 J J Flewellen Rd Waco, TX | 2.0 | 1.0 | 844 | $1,250 | $1.48 | 44d | 1 | 0.73mi |
| 804 Earle Ave Unit A Waco, TX | 3.0 | 2.0 | 872 | $1,035 | $1.19 | 14d | 1 | 0.87mi |
| 609 Sherman St Waco, TX | 3.0 | 2.0 | 1028 | $1,449 | $1.41 | 22d | 1 | 0.94mi |
| 1104 Sherman St Waco, TX | 2.0 | 1.0 | 1120 | $1,500 | $1.34 | 44d | 1 | 1.04mi |
| 1403 Strickland St Waco, TX | 3.0 | 2.0 | 1000 | $1,399 | $1.40 | 22d | 1 | 1.06mi |
| 108 Choctaw Ct Waco, TX | 3.0 | 2.0 | 1273 | $1,600 | $1.26 | 14d | 1 | 1.11mi |
| 2017 Broadway St Waco, TX | 3.0 | 1.0 | 1247 | $1,800 | $1.44 | 44d | 1 | 1.25mi |
| 1011 Kane St Waco, TX | 3.0 | 2.0 | 1228 | $1,695 | $1.38 | 44d | 1 | 1.27mi |
| 507 Dunbar St Waco, TX | 3.0 | 1.0 | 841 | $1,550 | $1.84 | 22d | 1 | 1.28mi |
| 507 Dunbar St Waco, TX | 3.0 | 1.0 | 852 | $1,450 | $1.70 | 14d | 1 | 1.28mi |
| 1324 Cherry St Waco, TX | 2.0 | 2.0 | 1200 | $1,700 | $1.42 | 14d | 1 | 1.29mi |
| 1130 Lewis St Waco, TX | 2.0 | 2.0 | 1092 | $1,450 | $1.33 | 22d | 1 | 1.44mi |
Listing history 30 events
-
2026-06-21days on market $109,000 Active 433 DOM
-
2026-06-18days on market $109,000 Active 430 DOM
-
2026-06-17days on market $109,000 Active 429 DOM
-
2026-06-16days on market $109,000 Active 428 DOM
-
2026-06-15days on market $109,000 Active 427 DOM
-
2026-06-14days on market $109,000 Active 425 DOM
-
2026-06-13days on market $109,000 Active 424 DOM
-
2026-06-10days on market $109,000 Active 422 DOM
-
2026-06-09days on market $109,000 Active 421 DOM
-
2026-06-08days on market $109,000 Active 420 DOM
-
2026-06-07days on market $109,000 Active 419 DOM
-
2026-06-05days on market $109,000 Active 416 DOM
-
2026-06-03days on market $109,000 Active 415 DOM
-
2026-06-02days on market $109,000 Active 414 DOM
-
2026-06-01days on market $109,000 Active 413 DOM
-
2026-05-31days on market $109,000 Active 412 DOM
-
2026-05-30days on market $109,000 Active 411 DOM
-
2024-10-08$109,000 Active 222-char remark
Show marketing remark (222 chars)
This 3/1 has great potential for maximizing rental income. Property has a long-term tenant. This property can be sold as a one-off or grouped with other properties as an investment package. For further details, please ask.
-
2024-03-22historical
-
2023-06-20$109,000
-
2022-09-22soldstatus
-
2022-09-19soldstatus
-
2022-08-18$72,500
-
2020-09-02soldstatus
-
2020-09-01soldstatus
-
2020-08-09$49,900
-
2014-04-07soldstatus $51,000
-
2007-08-31soldstatus
-
2005-12-22soldstatus
-
2004-03-11soldstatus
ⓘ Source: listings_history table (triggers on properties + properties_extension) + one-shot
backfill from property_details.listing_events for pre-trigger history.
Tax reassessment forecast TX · Resets to sale price
- Current annual tax
- $1,579 · $132/mo
- Projected year-2 tax
- $1,995 · $166/mo
- Expected delta
- +$415/yr (+$35/mo · 26.3%)
ⓘ Screening estimate from a state-policy table — verify with the county assessor before closing.
Climate risk First Street
- Flood 6/10 Major FEMA zone X (unshaded) · 74% chance over 30 yrs
- Wildfire 5/10 Major
- Heat 7/10 Severe 7 d/yr ≥109°F today · 25 d/yr by 30 yrs out
- Wind 6/10 Major 56% chance of damaging wind over 30 yrs
- Air quality 2/10 Low 0 unhealthy d/yr today · 1 by 30 yrs out
Nearby sold comps map
Loading sold comps map…
Walkable amenities ~0.75 mi
Loading nearby amenities…
Taxation est. · year 1
- Rental income
- $15,343
- − Mortgage interest
- −$6,106
- − Property taxes
- −$1,579
- − Insurance
- −$545
- − Repairs & maintenance
- −$1,227
- − Management
- −$1,227
- − Depreciation
- −$3,171
- Taxable income
- $1,487
- Est. tax owed @ 24.0%
- −$357
- After-tax cash flow
- $2,780/yr
For passive investors: Depreciation is non-cash, so a rental often shows a tax loss while cash-flowing — sheltering income. Rental losses are passive: they offset passive income freely, and up to $25,000/yr can offset ordinary (W-2) income if you actively participate and your MAGI is under $100k (phasing out to $0 by $150k); unused losses carry forward. On sale, claimed depreciation is recaptured at up to 25%, and gains may owe capital-gains tax (a 1031 exchange can defer both). Figures are a year-1 estimate at your 24.0% rate — not tax advice; consult a CPA.
Schools (NCES district)
- District
- Waco ISD
- NCES district ID
- 4844280
- Math proficiency
- 20% ▼ -14.00%
- Reading proficiency
- 24% ▼ -6.00%
- Median HH income
- $29,208
- Composite
- 17.57/100
- National rank
- #9043
- State rank
- #773 of 826 in TX
Livability — Waco
- Score
- 74/100
- State rank
- #166
- US rank
- #4378
Category grades
Schools grade is shown separately in the Schools card above.
Census & demographics
- Census place
- Waco, TX
- County
- McLennan County · 213,088 people
- City population
- 125,319
- Metro
- Waco, TX
- Population (ZIP)
- 7,018
- Household income
- $30,349
- Rent vs Own
- Severe rent burden
- 603.0
Population outlook (McLennan County) Hauer SSP2
- Today (2025)
- 264,191 people
- By 2030
- 273,578 · +3.6%
- By 2040
- 291,506 · +10.3%
- By 2050
- 308,044 · +16.6%
- By 2075
- 349,648 · +32.3%
- By 2100
- 364,779 · +38.1%
Race, ethnicity, and origin ACS 2023
- Neighborhood character
- Predominantly Black (67%)
- Race & ethnicity
- Black 67% Hispanic / Latino 19% Two or more races 11% White 10%
- Hispanic origin (detail)
- Mexican 17%
- Common ancestry
- Lithuanian 2%
- Foreign-born
- 6% · Canada
- Languages at home
- 86% English-only · Spanish 14%
Political lean MEDSL · McLennan
- 2024 margin
- Solid R (+30.9) · D 34.0% · R 64.9% · Other 1.0%
- 2008→2024 swing
- -7.0pp toward R · 2008: -23.9pp · 2024: -30.9pp
- All cycles
- 2024: R+30.9 2020: R+23.4 2016: R+27.1 2012: R+29.8 2008: R+23.9
Not yet ingested
- Civics
- —
Market trends
- HPI YoY
- ▼ -5.09%
- Current HPI
- 181.8051
- Rent YoY
- —
- Metro
- Waco, TX
- State GDP YoY
- ▲ 3.95%
- F500 in state
- 110
Industry mix (Fortune 500 HQ in TX)
| Industry | F500 HQs | Revenue |
|---|---|---|
| Energy | 16 | $1,198B |
|
||
| Technology | 5 | $198B |
|
||
| Engineering / Construction | 4 | $72B |
|
||
| Energy Services | 3 | $60B |
|
||
| Utilities | 3 | $41B |
|
||
| Healthcare | 2 | $330B |
|
||
Price history
+113.7% since first listed13 events — show timeline
- 2024-10-08 Listed $109,000 NTREIS
- 2024-03-22 Listing Removed — NTREIS
- 2023-06-20 Listed $109,000 NTREIS
- 2022-09-22 Sold (Public Records) — Public Records
- 2022-09-19 Sold (MLS) — NTREIS
- 2022-08-18 Listed $72,500 NTREIS
- 2020-09-02 Sold (Public Records) — Public Records
- 2020-09-01 Sold (MLS) — NTREIS
- 2020-08-09 Listed $49,900 NTREIS
- 2014-04-07 Sold (Public Records) $51,000 Public Records
- 2007-08-31 Sold (Public Records) — Public Records
- 2005-12-22 Sold (Public Records) — Public Records
- 2004-03-11 Sold (Public Records) — Public Records
Property tax history
+3.8%/yrLatest (2025): $1,579 · -0.3% YoY. Source: county tax records.
Cash-flow waterfall
monthlySold comps — $/sqft
last 12 mo · ≤1 miLoading sold comps…