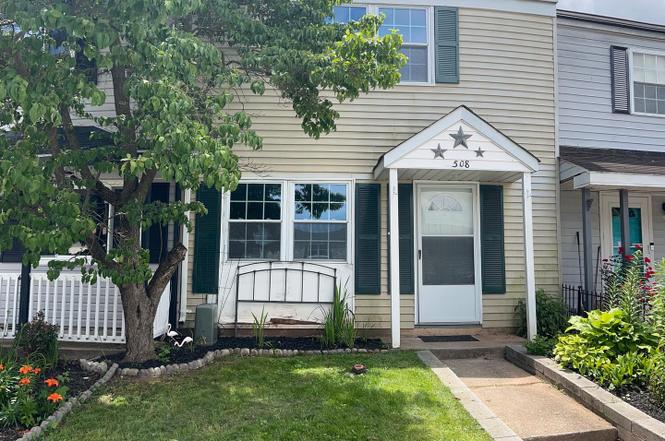
508 Daisy Dr · Taneytown, MD
Flood risk 1/10 · Minimal
- FEMA flood zone
- X (unshaded)
- Chance of flooding over 30 yrs
- 0.0%
- Est. flood insurance / yr
- $507 – $1,088
Fire risk 1/10 · Minimal
- Est. fire insurance / yr
- $755 – $1,403
Heat risk 6/10 · Moderate
- Hot days now (above 102°F)
- 7 days/yr
- Hot days in 30 yrs
- 15 days/yr
Wind risk 4/10 · Minor
- Chance of severe wind over 30 yrs
- 8.0%
Air-quality risk 2/10 · Minimal
- Unhealthy air days now
- 1 days/yr
- Unhealthy air days in 30 yrs
- 3 days/yr
Risk factors via First Street. Map © Google.
Why this score? — see what drove the D grade
The composite is a weighted blend of 9 inputs, each scored 0–100. Each bar is that input's sub-score; the figure is the points it added to the 100-point composite (weight × sub-score).
- Cash flow +14.6/30.0
- ARV discount +7.5/15.0
- DSCR +4.4/10.0
- 1% rule +3.7/10.0
- Schools +3.7/10.0
- Livability +3.6/5.0
- Rent growth +2.5/5.0
- Condition / age +2.5/5.0
- Appreciation +0.0/10.0
$229,999
🖨 Deal sheet (PDF) 📄 Offer letter ✓ Due diligence
Listing remarks MLS
This is not you typical local THS! Enjoy the multiple living areas of this home. Front living room with carpeting, vinyl foyer and coat closet and under stairs storage area. The dining room open into the kitchen that includes all appliances extra cabinet and has a combo laundry / pantry closet. Further back is the main level family room with carpeting, electric fireplace, ceiling fan and an exit to the yard. Exit out of the rear family room utility door onto the paver patio into your private landscaped yard with privacy fencing and a maintenance free shed. Front entrance way recently redone. This is possibly the largest THS currently for sale in Taneytown Village. Seller desires time to find HOC and possibly a short term rent back to coordinate moves.
Key facts
- Modern full bath
- Ceramic tiled floors
- No hoa
Tags
Property features AI
Exterior
- Parking: Parking lot and additional parking
- Utilities: Public water; Public sewer; Electric service
- Home design: Interior townhouse/rowhouse; Fee simple ownership
- Construction: Vinyl siding with frame construction; Architectural shingle roof; Slab foundation; Above-grade structures
- Exterior features: Wood fencing; No tidal water on the lot
Interior
- Bedrooms: Three bedrooms on the upper level
- Flooring: Bamboo flooring; Carpet; Ceramic tile
- Bathrooms: One full bathroom on upper level; One half bathroom on main level
- Heating & cooling: Heat pump heating; Central air conditioning; Electric heating and cooling systems; Electric hot water
- Interior features: Tub with shower; Ceiling fans; Family room adjacent to the kitchen
Neighborhood map
What this means for you Summary
Snapshot
- This is a 3-bed/1.5-bath townhouse listed at $230k.
Deal economics
- At list price, monthly cash flow is $53 ($637/yr) — positive.
- The deal already cash-flows at list — no discount required.
- To meet the 1% rule (rent ≥ 1% of price), the offer needs to be $199k (13.4% below list).
- Recommended offer: $199k (13.4% below list) — sets the bar for 1% rule.
- Cap rate 6.6% vs local median 1.9% in Taneytown — top-decile yield for the area; either an underpriced asset or a hidden risk that comps aren't pricing in. Stress-test before assuming the spread holds.
Location & tenants
- Location reads 71/100 on livability (#149 in MD) — a middle-class / working-renter tenant base. Strengths: housing A+, health & safety A+, employment A-; Watch: crime D+, amenities F, commute F.
- Carroll County Public Schools (suburban): math 32% / reading 47% proficiency, ranked #2 of 24 in MD (top 8%) — families likely to look elsewhere, expect single-tenant / working-renter base with shorter leases; only 16% free/reduced lunch — higher-income household profile.
- Zoned schools: Runnymede Elementary (math 29% / reading 24%, grade F, #238 of 860 statewide, top 29%, 592 students, 33% FRL); Northwest Middle (math 12% / reading 38%, grade F, #104 of 225 statewide, top 47%, 637 students, 44% FRL); Francis Scott Key High (math 47% / reading 67%, grade C, #80 of 222 statewide, top 37%, 944 students, 41% FRL) — zoned schools average 39% FRL vs 16% district-wide (24 pts higher); higher-poverty schools than district average — tighter screening recommended.
- Market conditions: 56 active listings in the ZIP; 5 comparable units currently listed for rent nearby; rentals at typical pace (median 15d on market — plan ~3-4 weeks tenant-placement turnaround); 156 units permitted in Carroll County in 2024 (12 in 5+ unit buildings).
Forward outlook
- Local home prices are declining (-3.0%/yr); year-one equity from $2k of loan paydown is wiped out by about $7k of value loss. Plan a longer hold.
- Carroll County population projected to shrink 7% by 2050 — rents likely to lag national; underwrite the cash flow, not the appreciation.
Negotiation context
- Only 3 days on market — expect competitive offers; lowballing is unlikely to land.
- 7 sale attempts since 22y ago with the ask held roughly flat each time — persistent listings suggest the price (not the market) is what's stuck; bring a comps-based counter.
- Current owner paid $185k; 24% above their basis — modest negotiation headroom, anchor on the comps not their cost.
Risks & watch-outs
- Climate carrying-cost: extreme-heat days projected 7→15/yr by 2055 (HVAC capex compounding) — expect insurance premiums to compound above CPI over the hold.
Questions for the listing agent
- Built in 1978 — when were the roof, HVAC, electrical panel, plumbing, and water heater last replaced?
- Is there a deadline driving the sale (1031 exchange, divorce, estate, relocation)? That informs how much negotiation room exists.
- Crime grade is D in this area — have there been break-ins, vandalism, or insurance claims at this property in the last 3 years? What carrier currently insures it and at what premium?
- The area grade is low — what's the realistic commute time and amenity access for the typical tenant pool here? Any planned neighborhood developments (good or bad) we should know about?
- What's the average days-on-market for RENTAL listings here right now (not sales)? A rising rental-DOM trend means longer vacancies and softer asking-rent achievability than the comps imply.
- What's the recent tenant-quality profile in this submarket — average credit score on applications, eviction rate, late-payment / NSF rate, and stable-employment percentage? A property-management company in the area should have these aggregated.
- How much new for-sale + rental construction is in the pipeline within 1–3 miles? Heavy new supply typically softens prices + rents 12–24 months out; constrained supply supports both.
Investment metrics
- 1% rule
- 0.87% ✗
- Cap rate
- 6.57%
- Cash-on-cash
- 0.99%
- DSCR
- 1.04
- GRM
- 9.6
CMA / ARV
- ARV (on-the-fly)
- $229,824
- Comps found
- 9
Show comp detail 9 sales within ~0.75 mi
| Address | Dist | Beds/Ba | Sqft | Sold | Price | $/sf | Match |
|---|---|---|---|---|---|---|---|
| 545 Daisy Dr | 0.07mi | 3/1.5 | 1,332 (-3%) | 4mo | $170,000 | $128 | 89 |
| 408 Red Tulip Ct | 0.12mi | 3/1.5 | 1,368 (0%) | 21mo | $227,000 | $166 | 77 |
| 334 E Baltimore St | 0.27mi | 3/1.5 | 1,447 (+6%) | 2mo | $280,000 | $194 | 76 |
| 8 Courtland St | 0.34mi | 2/1.0 (-1) | 1,408 (+3%) | 6mo | $207,000 | $147 | 67 |
| 138 Grand Dr | 0.47mi | 3/1.5 | 1,305 (-5%) | 7mo | $227,000 | $174 | 64 |
| 449 Red Tulip Ct | 0.10mi | 4/1.5 (+1) | 1,240 (-9%) | 15mo | $240,000 | $194 | 62 |
| 3 Courtland St | 0.35mi | 2/1.0 (-1) | 1,208 (-12%) | 3mo | $216,000 | $179 | 55 |
| 149 Grand Dr | 0.51mi | 3/1.5 | 1,188 (-13%) | 7mo | $200,000 | $168 | 48 |
| 11 Courtland St | 0.34mi | 2/1.0 (-1) | 1,258 (-8%) | 21mo | $203,000 | $161 | 46 |
Match score weights: distance 35% · size 25% · config 20% · recency 20%. Top-matched comps best support the ARV.
Projected returns pro-forma
-3.0% appreciation · 3.0% rent growth · sell at horizon
- IRR
- -14.7%
- Equity multiple
- 0.47×
- Total profit
- $-33,900
- Equity at exit
- $34,294
- IRR
- -6.1%
- Equity multiple
- 0.61×
- Total profit
- $-25,213
- Equity at exit
- $19,886
Cash invested: $64,400 (down + closing). Projections, not guarantees.
Landlord ↔ Tenant lean methodology
- Overall (STATE)
- 27 Tenant-Leaning
- State Maryland
- 27 Tenant-Leaning · D+14
- County
- — inherits STATE
- City
- — inherits STATE
ZIP-level market 21787
- Home prices YoY
- -34.0%
- Active inventory
- 56
- Price-to-rent
- 9.6×
Monthly cashflow live
- Estimated rent
- $1,992 high interval (Pro) →
- Mortgage (P&I)
- −$1,206
- Tax from tax record
- −$219 /mo · $2,628/yr
- Insurance
- −$96
- HOA
- −$0
- Vacancy / Maint / Mgmt
- −$418
- Net cashflow
- $53
Break-even live
Sensitivity live
| Price | -10% $183 | -5% $118 | +0% $53 | +5% $-12 | +10% $-77 |
|---|---|---|---|---|---|
| Rent | -10% $-104 | -5% $-26 | +0% $53 | +5% $132 | +10% $211 |
| Rate | -1.0pp $169 | -0.5pp $112 | base $53 | +0.5pp $-6 | +1.0pp $-67 |
UW: 25.0% down · 7.5% · 30yr · 1.5% tax · 5.0% vac · 8.0% maint · 8.0% mgmt
Financing live
Cash to close
- Down payment
- $57,500
- Closing costs
- $6,900
- Reserves months
- —
- Total cash needed
- —
Loan-product check · same deal, 3 products live
Conventional
25% down · 7.5% · 30yr
- Down + closing
- —
- Monthly P&I
- —
- Monthly cashflow
- —
- DSCR
- —
- Eligible?
- —
Personal DTI + credit; lowest rate.
DSCR
20% down · 8.5% · 30yr
- Down + closing
- —
- Monthly P&I
- —
- Monthly cashflow
- —
- DSCR
- —
- Eligible?
- —
No personal income docs; deal must DSCR.
Hard money
10% down · 12.0% · 12mo
- Down + closing
- —
- Monthly P&I
- —
- Monthly cashflow
- —
- DSCR
- —
- Eligible?
- —
Short-term bridge; refi at stabilization.
Rent comps 5 comps
| Address | Beds | Baths | Sqft | Rent | $/sqft | DOM | Units | Dist |
|---|---|---|---|---|---|---|---|---|
| 3 Courtland St Unit 3 Taneytown, MD | 2.0 | 1.0 | 1208 | $1,900 | $1.57 | 5d | 1 | 0.36mi |
| 513 E Baltimore St Taneytown, MD | 3.0 | 2.0 | 1681 | $1,900 | $1.13 | 19d | 1 | 0.39mi |
| 75 Grand Dr Taneytown, MD | 3.0 | 1.5 | 1032 | $1,850 | $1.79 | 19d | 1 | 0.43mi |
| 400 Hancock St Taneytown, MD | 3.0 | 4.0 | 1680 | $2,650 | $1.58 | 6d | 1 | 1.06mi |
| 13 Bristoe Station Rd Taneytown, MD | 3.0 | 2.5 | 1307 | $2,195 | $1.68 | 14d | 1 | 1.17mi |
Listing history 7 events
-
2026-06-21remarks 605-char remark
-
2026-06-21days on market $229,999 Active 3 DOM
-
2026-06-19statusdays on market $229,999 Active 1 DOM
-
2026-06-18days on market $229,999 Coming Soon 3 DOM
-
2026-06-17days on market $229,999 Coming Soon 2 DOM
-
2026-06-15remarks 215-char remark
-
2026-06-15$229,999 Coming Soon 1 DOM
ⓘ Source: listings_history table (triggers on properties + properties_extension) + one-shot
backfill from property_details.listing_events for pre-trigger history.
Tax reassessment forecast MD · Partial reset (capped growth)
- Current annual tax
- $2,628 · $219/mo
- Projected year-2 tax
- $2,628 · $219/mo
- Expected delta
- $0/yr ($0/mo · 0.0%)
ⓘ Screening estimate from a state-policy table — verify with the county assessor before closing.
Climate risk First Street
- Flood 1/10 Low FEMA zone X (unshaded) · 0% chance over 30 yrs
- Wildfire 1/10 Low
- Heat 6/10 Major 7 d/yr ≥102°F today · 15 d/yr by 30 yrs out
- Wind 4/10 Moderate 8% chance of damaging wind over 30 yrs
- Air quality 2/10 Low 1 unhealthy d/yr today · 3 by 30 yrs out
Nearby sold comps map
Loading sold comps map…
Walkable amenities ~0.75 mi
Loading nearby amenities…
Taxation est. · year 1
- Rental income
- $23,909
- − Mortgage interest
- −$12,884
- − Property taxes
- −$2,628
- − Insurance
- −$1,150
- − Repairs & maintenance
- −$1,913
- − Management
- −$1,913
- − Depreciation
- −$6,691
- Taxable loss
- −$3,268
- Est. tax savings @ 24.0%
- +$784
- After-tax cash flow
- $1,422/yr
For passive investors: Depreciation is non-cash, so a rental often shows a tax loss while cash-flowing — sheltering income. Rental losses are passive: they offset passive income freely, and up to $25,000/yr can offset ordinary (W-2) income if you actively participate and your MAGI is under $100k (phasing out to $0 by $150k); unused losses carry forward. On sale, claimed depreciation is recaptured at up to 25%, and gains may owe capital-gains tax (a 1031 exchange can defer both). Figures are a year-1 estimate at your 24.0% rate — not tax advice; consult a CPA.
Schools (NCES district)
- District
- Carroll County Public Schools
- NCES district ID
- 2400210
- Math proficiency
- 32% ▼ -25.00%
- Reading proficiency
- 47% ▼ -16.00%
- Median HH income
- $84,594
- Composite
- 37.33/100
- National rank
- #4441
- State rank
- #2 of 24 in MD
Livability — Taneytown
- Score
- 71/100
- State rank
- #149
- US rank
- #6550
Category grades
Schools grade is shown separately in the Schools card above.
Census & demographics
- Census place
- Taneytown, MD
- Population (ZIP)
- 11,549
Population outlook (Carroll County) Hauer SSP2
- Today (2025)
- 169,677 people
- By 2030
- 169,605 · +-0.0%
- By 2040
- 166,205 · -2.0%
- By 2050
- 158,312 · -6.7%
- By 2075
- 143,013 · -15.7%
- By 2100
- 122,431 · -27.8%
Race, ethnicity, and origin ACS 2023
- Neighborhood character
- Predominantly White (86%)
- Race & ethnicity
- White 86% Black 5% Hispanic / Latino 5% Two or more races 4%
- Hispanic origin (detail)
- Common ancestry
- Romanian 1% Slovak 1% Hispanic 1%
- Foreign-born
- 4% · Canada
- Languages at home
- 95% English-only · Spanish 2% French/Haitian/Cajun 1%
Political lean MEDSL · Carroll
- 2024 margin
- Strong R (+24.9) · D 36.2% · R 61.2% · Other 2.6%
- 2008→2024 swing
- +6.2pp toward D · 2008: -31.2pp · 2024: -24.9pp
- All cycles
- 2024: R+24.9 2020: R+23.7 2016: R+36.9 2012: R+34.0 2008: R+31.2
Not yet ingested
- Civics
- —
Market trends
- HPI YoY
- ▼ -132.27%
- Current HPI
- 257.2289
- Rent YoY
- —
- Metro
- —
- State GDP YoY
- ▲ 2.97%
- F500 in state
- 12
Industry mix (Fortune 500 HQ in MD)
| Industry | F500 HQs | Revenue |
|---|---|---|
| Aerospace / Defense | 1 | $71B |
|
||
| Utilities | 1 | $25B |
|
||
| Hotels | 1 | $24B |
|
||
| Consumer Goods | 1 | $7B |
|
||
| Real Estate | 1 | $6B |
|
||
| Chemicals | 1 | $2B |
|
||
Price history
+360.9% since first listed29 events — show timeline
- 2026-06-15 Coming Soon $229,999 BRIGHT MLS
- 2026-06-15 Listing Removed — BRIGHT MLS
- 2026-06-15 Listed $229,999 BRIGHT MLS
- 2021-08-27 Sold (Public Records) $185,000 Public Records
- 2021-08-04 Sold (MLS) $185,000 BRIGHT MLS
- 2021-07-30 Contingent — BRIGHT MLS
- 2021-07-23 Pending — BRIGHT MLS
- 2021-06-09 Contingent — BRIGHT MLS
- 2021-06-04 Listed $177,600 BRIGHT MLS
- 2017-12-29 Sold (Public Records) $137,000 Public Records
- 2017-12-15 Sold (MLS) $137,000 MRIS
- 2017-12-15 Sold (MLS) $137,000 BRIGHT MLS
- 2017-11-08 Pending — MRIS
- 2017-10-21 Listed $139,500 MRIS
- 2017-10-21 Listed $139,500 BRIGHT MLS
- 2014-03-27 Sold (MLS) $99,500 BRIGHT MLS
- 2014-03-27 Sold (MLS) $99,500 MRIS
- 2014-02-04 Pending — MRIS
- 2014-02-03 Listing Removed — BRIGHT MLS
- 2014-01-24 Price Changed $99,500 MRIS
- 2013-12-14 Price Changed $104,500 MRIS
- 2013-11-11 Listed $114,900 MRIS
- 2013-11-11 Listed $99,500 BRIGHT MLS
- 2004-06-10 Sold (Public Records) $94,900 Public Records
- 2004-05-14 Sold (MLS) $94,900 MRIS
- 2004-03-17 Delisted — MRIS
- 2004-03-02 Listed $94,900 MRIS
- 1994-06-28 Sold (Public Records) $85,500 Public Records
- 1986-09-17 Sold (Public Records) $49,900 Public Records
Property tax history
+3.2%/yrLatest (2025): $2,628 · +12.6% YoY. Source: county tax records.
Cash-flow waterfall
monthlySold comps — $/sqft
last 12 mo · ≤1 miLoading sold comps…