265 E Balboa · Mojave, CA
Flood risk 1/10 · Minimal
- FEMA flood zone
- X (unshaded)
- Chance of flooding over 30 yrs
- 0.0%
- Est. flood insurance / yr
- $507 – $1,088
Fire risk 5/10 · Moderate
- Est. fire insurance / yr
- $659 – $1,223
Heat risk 7/10 · Major
- Hot days now (above 101°F)
- 7 days/yr
- Hot days in 30 yrs
- 19 days/yr
Wind risk 1/10 · Minimal
- Chance of severe wind over 30 yrs
- —
Air-quality risk 8/10 · Major
- Unhealthy air days now
- 15 days/yr
- Unhealthy air days in 30 yrs
- 20 days/yr
Risk factors via First Street. Map © Google.
Why this score? — see what drove the B grade
The composite is a weighted blend of 9 inputs, each scored 0–100. Each bar is that input's sub-score; the figure is the points it added to the 100-point composite (weight × sub-score).
- Cash flow +30.0/30.0
- DSCR +10.0/10.0
- 1% rule +8.9/10.0
- ARV discount +7.5/15.0
- Appreciation +5.7/10.0
- Livability +2.8/5.0
- Rent growth +2.5/5.0
- Condition / age +2.5/5.0
- Schools +2.1/10.0
$90,000
🖨 Deal sheet (PDF) 📄 Offer letter ✓ Due diligence
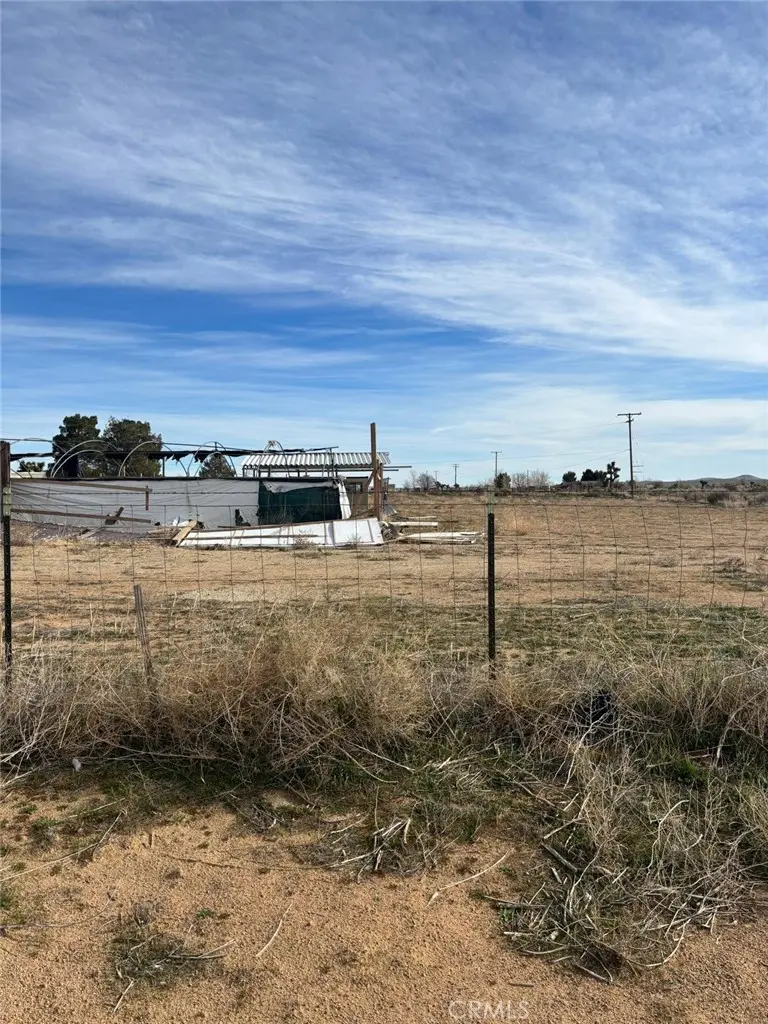
Listing remarks
265 E Balboa Ave, Mojave, CA Opportunity awaits at 265 E Balboa Ave in Mojave. This residential manufactured home sits on an expansive approx. 111,514 sq ft lot (over 2.5 acres), offering endless potential for the right buyer. The manufactured home is not in livable condition and will require major repairs or replacement, making this an ideal value-add or land opportunity for investors, builders, or buyers looking to develop, rebuild, or place a new manufactured or custom home (buyer to verify zoning and permitted uses). With its generous lot size, this property offers room for future expansion, additional structures, storage, or other permitted uses. Located in the Mojave area with conv
Key facts
- Expansive lot
- Convenient access
- 2.56 acre lot
Tags
Property features AI
Finance
- Other: Zoning: A-1 MH; Total units on property: 1; No common walls; Parcel number provided
- Financial info: Assessments: unknown
- HOA & community: Community described as valley
Exterior
- Utilities: Shared well water; Septic (type unknown)
- Home design: Manufactured house; Single-story
- Construction: No ADU; Lot and year-built information from public records
- Exterior features: No pool; Property has a view; Lot characterized as 2-5 units per acre
Interior
- Bathrooms: 1 full bathroom
- Interior features: One level; See remarks for room details; Fireplace present (see remarks)
- Laundry & utility: No laundry facilities
Neighborhood map
What this means for you Summary
Snapshot
- This is a 2-bed/1.0-bath manufactured listed at $90k.
Deal economics
- At list price, monthly cash flow is $384 ($5k/yr) — positive.
- The deal already cash-flows at list — no discount required.
- Meets the 1% rule at list price ($1k rent vs $90k).
- Recommended offer: $87k (3.0% below list) — sets the bar for market timing.
- Cap rate 11.4% vs local median 3.7% in Mojave — top-decile yield for the area; either an underpriced asset or a hidden risk that comps aren't pricing in. Stress-test before assuming the spread holds.
Location & tenants
- Location reads 55/100 on livability (#873 in CA) — a working-class tenant base; expect higher turnover. Strengths: housing A+, commute A-; Watch: crime C-, amenities F, employment F.
- Mojave Unified (town): math 25% / reading 25% proficiency, ranked #411 of 517 in CA (top 80%) — low school quality limits family demand, transient renter base, plan for 1-2y turnover; 76% free/reduced lunch — lower-income household profile, screen leases tightly.
- Zoned schools: Mojave Elementary (414 students, 94% FRL); California City Middle (501 students, 87% FRL); Mojave Jr./Sr. High (396 students, 91% FRL).
- Market conditions: 282 active listings in the ZIP; 3,244 units permitted in Kern County in 2024 (73 in 5+ unit buildings).
Forward outlook
- In year one you build about $2k of equity ($622 loan paydown + $1k appreciation (1.3% local appreciation)).
- Kern County population projected at +17% by 2050 — long-run rental-demand tailwind backs the buy-and-hold thesis.
- At projected returns (1.3% appreciation + 3.0% rent growth), your $25k cash investment doubles in ~4 years — after that, you're playing with house money.
Negotiation context
- It's been on market 47 days — a 3% lower offer ($87k) is reasonable based on typical stale-listing flexibility.
- 10 sale attempts since 25y ago with the ask held roughly flat each time — persistent listings suggest the price (not the market) is what's stuck; bring a comps-based counter.
Risks & watch-outs
- Climate carrying-cost: moderate wildfire risk; extreme-heat days projected 7→19/yr by 2055 (HVAC capex compounding) — expect insurance premiums to compound above CPI over the hold.
Questions for the listing agent
- It's been on market 47 days. Have you received any prior offers? Is the seller open to a 3% concession, seller financing, or rate buy-down credit?
- Built in 1971 — when were the roof, HVAC, electrical panel, plumbing, and water heater last replaced?
- Is there a deadline driving the sale (1031 exchange, divorce, estate, relocation)? That informs how much negotiation room exists.
- Schools are F-rated, which usually means shorter tenancies and higher turnover. Who's the typical renter profile here, and what's been the actual vacancy rate?
- What's the average days-on-market for RENTAL listings here right now (not sales)? A rising rental-DOM trend means longer vacancies and softer asking-rent achievability than the comps imply.
- What's the recent tenant-quality profile in this submarket — average credit score on applications, eviction rate, late-payment / NSF rate, and stable-employment percentage? A property-management company in the area should have these aggregated.
- How much new for-sale + rental construction is in the pipeline within 1–3 miles? Heavy new supply typically softens prices + rents 12–24 months out; constrained supply supports both.
Investment metrics
- 1% rule
- 1.39% ✓
- Cap rate
- 11.41%
- Cash-on-cash
- 18.28%
- DSCR
- 1.81
- GRM
- 6.0
CMA / ARV
- ARV (median comp)
- $228,000
- List price
- $90,000
- Delta
- -60.53%
- Verdict
- UNDERPRICED
- Comps
- 1 within 2.0 mi
Projected returns pro-forma
1.33% appreciation · 3.0% rent growth · sell at horizon
- IRR
- 21.0%
- Equity multiple
- 2.09×
- Total profit
- $27,584
- Equity at exit
- $32,260
- IRR
- 23.7%
- Equity multiple
- 3.95×
- Total profit
- $74,242
- Equity at exit
- $44,084
Cash invested: $25,200 (down + closing). Projections, not guarantees.
Landlord ↔ Tenant lean methodology
- Overall (STATE)
- 18 Strongly Tenant-Friendly
- State California
- 18 Strongly Tenant-Friendly · D+13
- County
- — inherits STATE
- City
- — inherits STATE
ZIP-level market 93501
- Home prices YoY
- 0.2%
- Active inventory
- 282
- Price-to-rent
- 6.0×
Monthly cashflow live
- Estimated rent
- $1,254 medium interval (Pro) →
- Mortgage (P&I)
- −$472
- Tax from tax record
- −$97 /mo · $1,169/yr
- Insurance
- −$38
- HOA
- −$0
- Vacancy / Maint / Mgmt
- −$263
- Net cashflow
- $384
Break-even live
Sensitivity live
| Price | -10% $435 | -5% $409 | +0% $384 | +5% $358 | +10% $333 |
|---|---|---|---|---|---|
| Rent | -10% $285 | -5% $334 | +0% $384 | +5% $433 | +10% $483 |
| Rate | -1.0pp $429 | -0.5pp $407 | base $384 | +0.5pp $361 | +1.0pp $337 |
UW: 25.0% down · 7.5% · 30yr · 1.5% tax · 5.0% vac · 8.0% maint · 8.0% mgmt
Financing live
Cash to close
- Down payment
- $22,500
- Closing costs
- $2,700
- Reserves months
- —
- Total cash needed
- —
Loan-product check · same deal, 3 products live
Conventional
25% down · 7.5% · 30yr
- Down + closing
- —
- Monthly P&I
- —
- Monthly cashflow
- —
- DSCR
- —
- Eligible?
- —
Personal DTI + credit; lowest rate.
DSCR
20% down · 8.5% · 30yr
- Down + closing
- —
- Monthly P&I
- —
- Monthly cashflow
- —
- DSCR
- —
- Eligible?
- —
No personal income docs; deal must DSCR.
Hard money
10% down · 12.0% · 12mo
- Down + closing
- —
- Monthly P&I
- —
- Monthly cashflow
- —
- DSCR
- —
- Eligible?
- —
Short-term bridge; refi at stabilization.
Listing history 41 events
-
2026-06-22days on market $90,000 Active 47 DOM
-
2026-06-18days on market $90,000 Active 44 DOM
-
2026-06-17days on market $90,000 Active 43 DOM
-
2026-06-16days on market $90,000 Active 42 DOM
-
2026-06-15days on market $90,000 Active 41 DOM
-
2026-06-14days on market $90,000 Active 39 DOM
-
2026-06-13days on market $90,000 Active 38 DOM
-
2026-06-10days on market $90,000 Active 36 DOM
-
2026-06-09days on market $90,000 Active 35 DOM
-
2026-06-08days on market $90,000 Active 34 DOM
-
2026-06-07days on market $90,000 Active 33 DOM
-
2026-06-05days on market $90,000 Active 30 DOM
-
2026-06-03days on market $90,000 Active 29 DOM
-
2026-06-03days on market $90,000 Active 28 DOM
-
2026-06-01days on market $90,000 Active 27 DOM
-
2026-05-31days on market $90,000 Active 26 DOM
-
2026-05-05$90,000 Active 929-char remark
-
2026-03-15historical
-
2025-12-16$90,000 Active
-
2024-09-24historical
-
2024-03-22$149,870 Active
-
2024-03-22$149,870 Active
-
2024-02-07historical
-
2023-10-04$150,000 Active
-
2023-04-29historical
-
2022-04-29$179,999 Active
-
2019-05-17historical
-
2019-05-15soldstatus $80,000 Closed
-
2019-05-15soldstatus $80,000 Closed Sale
-
2019-05-15soldstatus $80,000
-
2019-05-11status Pending Sale
-
2019-05-11status Pending
-
2019-03-11$95,000 Active
-
2019-03-10$95,000 Active
-
2015-03-28historical
-
2013-05-31soldstatus $20,000
-
2007-04-21$85,000
-
2003-12-15soldstatus $20,000
-
2001-02-16soldstatus $35,000
-
2001-02-08soldstatus $20,000
-
2001-01-07$35,000
ⓘ Source: listings_history table (triggers on properties + properties_extension) + one-shot
backfill from property_details.listing_events for pre-trigger history.
Tax reassessment forecast CA · Resets to sale price
- Current annual tax
- $1,169 · $97/mo
- Projected year-2 tax
- $1,169 · $97/mo
- Expected delta
- $0/yr ($0/mo · 0.0%)
ⓘ Screening estimate from a state-policy table — verify with the county assessor before closing.
Climate risk First Street
- Flood 1/10 Low FEMA zone X (unshaded) · 0% chance over 30 yrs
- Wildfire 5/10 Major
- Heat 7/10 Severe 7 d/yr ≥101°F today · 19 d/yr by 30 yrs out
- Wind 1/10 Low
- Air quality 8/10 Severe 15 unhealthy d/yr today · 20 by 30 yrs out
Nearby sold comps map
Loading sold comps map…
Walkable amenities ~0.75 mi
Loading nearby amenities…
Taxation est. · year 1
- Rental income
- $15,049
- − Mortgage interest
- −$5,041
- − Property taxes
- −$1,169
- − Insurance
- −$450
- − Repairs & maintenance
- −$1,204
- − Management
- −$1,204
- − Depreciation
- −$2,618
- Taxable income
- $3,363
- Est. tax owed @ 24.0%
- −$807
- After-tax cash flow
- $3,799/yr
For passive investors: Depreciation is non-cash, so a rental often shows a tax loss while cash-flowing — sheltering income. Rental losses are passive: they offset passive income freely, and up to $25,000/yr can offset ordinary (W-2) income if you actively participate and your MAGI is under $100k (phasing out to $0 by $150k); unused losses carry forward. On sale, claimed depreciation is recaptured at up to 25%, and gains may owe capital-gains tax (a 1031 exchange can defer both). Figures are a year-1 estimate at your 24.0% rate — not tax advice; consult a CPA.
Schools (NCES district)
- District
- Mojave Unified
- NCES district ID
- 0625230
- Math proficiency
- 25% ▲ 11.00%
- Reading proficiency
- 25% ▼ -1.00%
- Median HH income
- $43,017
- Composite
- 21.4/100
- National rank
- #8350
- State rank
- #411 of 517 in CA
Livability — Mojave
- Score
- 55/100
- State rank
- #873
- US rank
- #23667
Category grades
Schools grade is shown separately in the Schools card above.
Census & demographics
- City population
- 5,944
- Population (ZIP)
- 5,944
Population outlook (Kern County) Hauer SSP2
- Today (2025)
- 947,286 people
- By 2030
- 978,984 · +3.3%
- By 2040
- 1,045,018 · +10.3%
- By 2050
- 1,105,232 · +16.7%
- By 2075
- 1,229,538 · +29.8%
- By 2100
- 1,238,059 · +30.7%
Race, ethnicity, and origin ACS 2023
- Neighborhood character
- Diverse neighborhood (Simpson 0.66)
- Race & ethnicity
- Hispanic / Latino 47% White 26% Black 21% Two or more races 18% Asian 1%
- Hispanic origin (detail)
- Mexican 41%
- Common ancestry
- Slovak 4% Lithuanian 2% Serbian 1%
- Foreign-born
- 13% · Canada, Vietnam
- Languages at home
- 70% English-only · Spanish 28%
Political lean MEDSL · Kern
- 2024 margin
- Strong R (+21.1) · D 38.2% · R 59.3% · Other 2.5%
- 2008→2024 swing
- -3.3pp toward R · 2008: -17.8pp · 2024: -21.1pp
- All cycles
- 2024: R+21.1 2020: R+10.2 2016: R+15.0 2012: R+20.9 2008: R+17.8
Not yet ingested
- Civics
- —
Market trends
- HPI YoY
- ▲ 1.33%
- Current HPI
- 595.661
- Rent YoY
- —
- Metro
- —
- State GDP YoY
- ▲ 3.21%
- F500 in state
- 116
Industry mix (Fortune 500 HQ in CA)
| Industry | F500 HQs | Revenue |
|---|---|---|
| Technology | 27 | $1,492B |
|
||
| Financial Services | 3 | $174B |
|
||
| Retail | 3 | $44B |
|
||
| Insurance | 3 | $26B |
|
||
| Media / Entertainment | 2 | $115B |
|
||
| Pharmaceuticals / Biotech | 2 | $62B |
|
||
Price history
+157.1% since first listed25 events — show timeline
- 2026-05-05 Listed $90,000 CRMLS
- 2026-03-15 Listing Removed — CRMLS
- 2025-12-16 Listed $90,000 CRMLS
- 2024-09-24 Listing Removed — CRMLS
- 2024-03-22 Listed $149,870 TAAR
- 2024-03-22 Listed $149,870 CRMLS
- 2024-02-07 Listing Removed — CRMLS
- 2023-10-04 Listed $150,000 CRMLS
- 2023-04-29 Listing Removed — CRMLS
- 2022-04-29 Listed $179,999 CRMLS
- 2019-05-17 Listing Removed — AVMLS
- 2019-05-15 Sold (Public Records) $80,000 Public Records
- 2019-05-15 Sold (MLS) $80,000 CRMLS
- 2019-05-15 Sold (MLS) $80,000 AVMLS
- 2019-05-11 Pending — CRMLS
- 2019-05-11 Pending — AVMLS
- 2019-03-11 Listed $95,000 AVMLS
- 2019-03-10 Listed $95,000 CRMLS
- 2015-03-28 Listing Removed — AVMLS
- 2013-05-31 Sold (Public Records) $20,000 Public Records
- 2007-04-21 Listed $85,000 AVMLS
- 2003-12-15 Sold (Public Records) $20,000 Public Records
- 2001-02-16 Sold (MLS) $35,000 AVMLS
- 2001-02-08 Sold (Public Records) $20,000 Public Records
- 2001-01-07 Listed $35,000 AVMLS
Property tax history
+11.8%/yrLatest (2025): $1,169 · +1.2% YoY. Source: county tax records.
Cash-flow waterfall
monthlySold comps — $/sqft
last 12 mo · ≤1 miLoading sold comps…