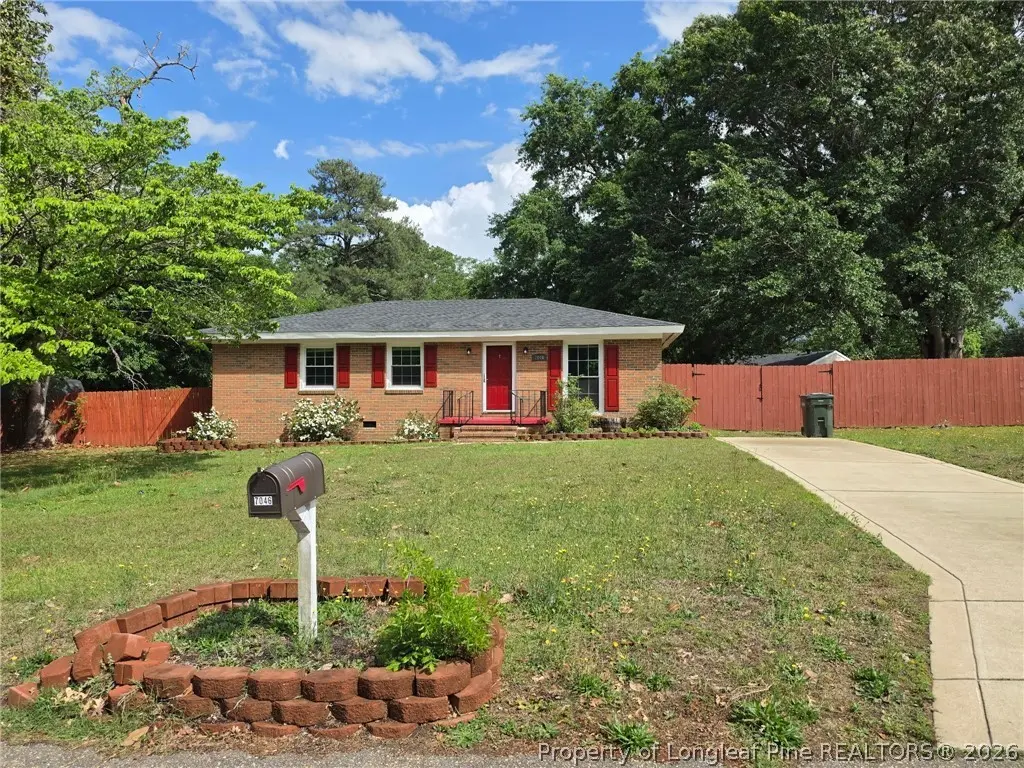
7046 Ryan St · Fayetteville, NC
Flood risk 1/10 · Minimal
- FEMA flood zone
- X (unshaded)
- Chance of flooding over 30 yrs
- 0.0%
- Est. flood insurance / yr
- $507 – $1,088
Fire risk 4/10 · Minor
- Est. fire insurance / yr
- $906 – $1,684
Heat risk 7/10 · Major
- Hot days now (above 106°F)
- 7 days/yr
- Hot days in 30 yrs
- 16 days/yr
Wind risk 7/10 · Major
- Chance of severe wind over 30 yrs
- 78.0%
Air-quality risk 2/10 · Minimal
- Unhealthy air days now
- 0 days/yr
- Unhealthy air days in 30 yrs
- 1 days/yr
Risk factors via First Street. Map © Google.
Why this score? — see what drove the D+ grade
The composite is a weighted blend of 9 inputs, each scored 0–100. Each bar is that input's sub-score; the figure is the points it added to the 100-point composite (weight × sub-score).
- Cash flow +15.0/30.0
- ARV discount +11.3/15.0
- DSCR +4.6/10.0
- Livability +3.8/5.0
- 1% rule +3.7/10.0
- Rent growth +3.3/5.0
- Schools +3.1/10.0
- Condition / age +2.5/5.0
- Appreciation +0.0/10.0
$159,000
🖨 Deal sheet (PDF) 📄 Offer letter ✓ Due diligence
Listing remarks MLS
This great home boasts a new roof, new windows and newer HVAC. New duct work! Nest thermostat. Natural Oak hardwood floors, new trim and fresh paint. Also an awesome backyard and privacy fence. SOLD AS IS. CASH ONLY. AGENT IS OWNER and has interest.
Key facts
- Built 1965
- Listed 47 days
Property features AI
Exterior
- Utilities: Public water; Public sewer
- Home design: Single-family residence; One story
- Construction: Construction materials: Unknown
- Exterior features: Located in the Loch Lomond subdivision; Zoned SF10 (Single Family Residential 10)
Interior
- Flooring: Hardwood
- Bathrooms: One full bathroom
- Heating & cooling: Heat pump heating; Electric cooling
- Interior features: Hardwood flooring; No fireplace; No basement; Three total rooms
Neighborhood map
What this means for you Summary
Snapshot
- This is a 3-bed/1.0-bath single-family listed at $159k.
Deal economics
- At list price, monthly cash flow is $49 ($590/yr) — positive.
- The deal already cash-flows at list — no discount required.
- To meet the 1% rule (rent ≥ 1% of price), the offer needs to be $138k (13.0% below list).
- Recommended offer: $138k (13.0% below list) — sets the bar for 1% rule.
- Cap rate 6.7% vs local median 4.8% in Fayetteville — top-decile yield for the area; either an underpriced asset or a hidden risk that comps aren't pricing in. Stress-test before assuming the spread holds.
Location & tenants
- Location reads 75/100 on livability (#45 in NC, #4,031 nationally) — a middle-class / working-renter tenant base. Strengths: commute A+, cost of living A+, housing A+; Watch: crime F, employment D-.
- Cumberland County Schools (urban): math 32% / reading 41% proficiency, ranked #126 of 178 in NC (top 71%) — families likely to look elsewhere, expect single-tenant / working-renter base with shorter leases.
- Zoned schools: Morganton Road Elementary (math 27% / reading 42%, grade F, #835 of 1,410 statewide, top 62%, 499 students, 99% FRL); Westover Middle (math 20% / reading 30%, grade F, #396 of 475 statewide, top 84%, 784 students, 100% FRL); Westover High (math 42% / reading 39%, grade F, #387 of 535 statewide, top 73%, 1,202 students, 100% FRL) — zoned schools average 100% FRL vs 55% district-wide (45 pts higher); higher-poverty schools than district average — tighter screening recommended.
- Market conditions: Rents rising (+3.1%/yr); 435 active listings in the ZIP; 40 comparable units currently listed for rent nearby; rentals at typical pace (median 25d on market — plan ~3-4 weeks tenant-placement turnaround); 1,125 units permitted in Cumberland County in 2024 (104 in 5+ unit buildings).
Forward outlook
- Local home prices are declining (-3.0%/yr); year-one equity from $1k of loan paydown is wiped out by about $5k of value loss. Plan a longer hold.
Negotiation context
- It's been on market 47 days — a 3% lower offer ($154k) is reasonable based on typical stale-listing flexibility.
- 2 sale attempts since 6y ago with the ask held roughly flat each time — persistent listings suggest the price (not the market) is what's stuck; bring a comps-based counter.
- Current owner paid $74k; list at $159k implies a 116% gain — meaningful room to come down on a strong offer.
Risks & watch-outs
- Climate carrying-cost: major wind risk, 78% chance of damaging wind over 30y; extreme-heat days projected 7→16/yr by 2055 (HVAC capex compounding) — expect insurance premiums to compound above CPI over the hold.
Questions for the listing agent
- It's been on market 47 days. Have you received any prior offers? Is the seller open to a 13% concession, seller financing, or rate buy-down credit?
- Built in 1965 — when were the roof, HVAC, electrical panel, plumbing, and water heater last replaced?
- Is there a deadline driving the sale (1031 exchange, divorce, estate, relocation)? That informs how much negotiation room exists.
- Crime grade is F in this area — have there been break-ins, vandalism, or insurance claims at this property in the last 3 years? What carrier currently insures it and at what premium?
- The area grade is low — what's the realistic commute time and amenity access for the typical tenant pool here? Any planned neighborhood developments (good or bad) we should know about?
- What's the average days-on-market for RENTAL listings here right now (not sales)? A rising rental-DOM trend means longer vacancies and softer asking-rent achievability than the comps imply.
- What's the recent tenant-quality profile in this submarket — average credit score on applications, eviction rate, late-payment / NSF rate, and stable-employment percentage? A property-management company in the area should have these aggregated.
- How much new for-sale + rental construction is in the pipeline within 1–3 miles? Heavy new supply typically softens prices + rents 12–24 months out; constrained supply supports both.
Investment metrics
- 1% rule
- 0.87% ✗
- Cap rate
- 6.66%
- Cash-on-cash
- 1.32%
- DSCR
- 1.06
- GRM
- 9.6
CMA / ARV
- ARV (on-the-fly)
- $173,513
- Comps found
- 12
Show comp detail 12 sales within ~0.75 mi
| Address | Dist | Beds/Ba | Sqft | Sold | Price | $/sf | Match |
|---|---|---|---|---|---|---|---|
| 306 Desmond Dr | 0.16mi | 3/1.0 | 1,008 (-3%) | 5mo | $136,000 | $135 | 83 |
| 6785 Winchester St | 0.28mi | 3/2.0 | 1,087 (+5%) | 3mo | $182,000 | $167 | 73 |
| 921 Glen Reilly Dr | 0.30mi | 3/2.0 | 1,095 (+5%) | 2mo | $115,000 | $105 | 72 |
| 937 Glen Reilly Dr | 0.26mi | 3/2.0 | 1,100 (+6%) | 4mo | $210,000 | $191 | 71 |
| 7206 Shelby Cir | 0.36mi | 3/2.0 | 980 (-6%) | 5mo | $190,000 | $194 | 66 |
| 7425 Ryan St | 0.31mi | 3/2.0 | 943 (-9%) | 1mo | $170,000 | $180 | 65 |
| 6710 Winchester St | 0.41mi | 3/2.0 | 1,078 (+4%) | 8mo | $170,000 | $158 | 64 |
| 6766 Winchester St | 0.31mi | 3/2.0 | 1,135 (+9%) | 4mo | $199,999 | $176 | 63 |
| 7264 Ainsley St | 0.56mi | 3/2.0 | 1,056 (+2%) | 8mo | $168,000 | $159 | 61 |
| 1001 Glen Reilly Dr | 0.20mi | 3/2.0 | 1,173 (+13%) | 8mo | $145,000 | $124 | 59 |
| 6502 Somerset Ct | 0.40mi | 3/2.0 | 1,148 (+10%) | 8mo | $205,000 | $179 | 53 |
| 251 Shads Ford Blvd | 0.68mi | 3/1.5 | 1,147 (+10%) | 8mo | $185,000 | $161 | 42 |
Match score weights: distance 35% · size 25% · config 20% · recency 20%. Top-matched comps best support the ARV.
Projected returns pro-forma
-3.0% appreciation · 3.11% rent growth · sell at horizon
- IRR
- -14.1%
- Equity multiple
- 0.49×
- Total profit
- $-22,495
- Equity at exit
- $23,707
- IRR
- -5.1%
- Equity multiple
- 0.66×
- Total profit
- $-14,981
- Equity at exit
- $13,747
Cash invested: $44,520 (down + closing). Projections, not guarantees.
Landlord ↔ Tenant lean methodology
- Overall (STATE)
- 85 Strongly Landlord-Friendly
- State North Carolina
- 85 Strongly Landlord-Friendly · R+3
- County
- — inherits STATE
- City
- — inherits STATE
ZIP-level market 28314
- Home prices YoY
- -15.7%
- Rents YoY
- 3.1%
- Active inventory
- 435
- Price-to-rent
- 9.6×
Monthly cashflow live
- Estimated rent
- $1,384 high interval (Pro) →
- Mortgage (P&I)
- −$834
- Tax from tax record
- −$144 /mo · $1,726/yr
- Insurance
- −$66
- HOA
- −$0
- Vacancy / Maint / Mgmt
- −$291
- Net cashflow
- $49
Break-even live
Sensitivity live
| Price | -10% $139 | -5% $94 | +0% $49 | +5% $4 | +10% $-41 |
|---|---|---|---|---|---|
| Rent | -10% $-60 | -5% $-6 | +0% $49 | +5% $104 | +10% $158 |
| Rate | -1.0pp $129 | -0.5pp $90 | base $49 | +0.5pp $8 | +1.0pp $-34 |
UW: 25.0% down · 7.5% · 30yr · 1.5% tax · 5.0% vac · 8.0% maint · 8.0% mgmt
Financing live
Cash to close
- Down payment
- $39,750
- Closing costs
- $4,770
- Reserves months
- —
- Total cash needed
- —
Loan-product check · same deal, 3 products live
Conventional
25% down · 7.5% · 30yr
- Down + closing
- —
- Monthly P&I
- —
- Monthly cashflow
- —
- DSCR
- —
- Eligible?
- —
Personal DTI + credit; lowest rate.
DSCR
20% down · 8.5% · 30yr
- Down + closing
- —
- Monthly P&I
- —
- Monthly cashflow
- —
- DSCR
- —
- Eligible?
- —
No personal income docs; deal must DSCR.
Hard money
10% down · 12.0% · 12mo
- Down + closing
- —
- Monthly P&I
- —
- Monthly cashflow
- —
- DSCR
- —
- Eligible?
- —
Short-term bridge; refi at stabilization.
Rent comps 40 comps
| Address | Beds | Baths | Sqft | Rent | $/sqft | DOM | Units | Dist |
|---|---|---|---|---|---|---|---|---|
| 1001 Brookhollow Dr #4 Fayetteville, NC | 3.0 | 2.0 | 1311 | $1,550 | $1.18 | 25d | 1 | 0.20mi |
| 244 Wickford Ct Unit 6 Fayetteville, NC | 2.0 | 1.5 | 1141 | $995 | $0.87 | 25d | 1 | 0.20mi |
| 1002 Brookhollow Dr #5 Fayetteville, NC | 3.0 | 2.0 | 1311 | $1,290 | $0.98 | 23d | 1 | 0.24mi |
| 6720 Willowbrook Dr #5 Fayetteville, NC | 2.0 | 2.0 | 1200 | $1,150 | $0.96 | 15d | 1 | 0.25mi |
| 1014 Brookhollow Dr Fayetteville, NC | 2.0 | 2.0 | 1050 | $1,000 | $0.95 | 15d | 1 | 0.32mi |
| 916 Glen Reilly Dr Fayetteville, NC | 3.0 | 2.0 | 1071 | $1,400 | $1.31 | 25d | 1 | 0.32mi |
| 6855 Shawcross Ln Fayetteville, NC | 3.0 | 2.0 | 1100 | $1,495 | $1.36 | 25d | 1 | 0.35mi |
| 6748 Willowbrook Dr #9 Fayetteville, NC | 2.0 | 2.0 | 1157 | $1,100 | $0.95 | 25d | 1 | 0.35mi |
| 605 S Reilly Rd Fayetteville, NC | 1.0–3.0 | 1.0–2.0 | 992 | $1,349 | $1.36 | 15d | 1 | 0.35mi |
| 6848 Torrance Ln Fayetteville, NC | 3.0 | 2.5 | 1290 | $3,295 | $2.55 | 15d | 1 | 0.36mi |
| 1022 Brookhollow Dr #5 Fayetteville, NC | 2.0 | 2.0 | 1086 | $1,050 | $0.97 | 25d | 1 | 0.36mi |
| 6734 Winchester St Fayetteville, NC | 3.0 | 2.0 | 1068 | $3,195 | $2.99 | 15d | 1 | 0.39mi |
| 338 Milburn Dr Fayetteville, NC | 3.0 | 1.5 | 1128 | $1,550 | $1.37 | 25d | 1 | 0.40mi |
| 1000 Wood Creek Dr #9 Fayetteville, NC | 2.0 | 2.0 | 1100 | $1,175 | $1.07 | 25d | 1 | 0.41mi |
| 1018 Wood Creek Dr #9 Fayetteville, NC | 3.0 | 2.0 | 1101 | $1,195 | $1.09 | 25d | 1 | 0.44mi |
| 6407 Wallaby Ct Fayetteville, NC | 2.0 | 1.5 | 1100 | $1,200 | $1.09 | 15d | 1 | 0.45mi |
| 205 Brookford Ct Fayetteville, NC | 3.0 | 2.0 | 1196 | $1,640 | $1.37 | 25d | 1 | 0.49mi |
| 6809 Willowbrook Dr Fayetteville, NC | 2.0 | 2.0 | 1050 | $990 | $0.94 | 25d | 1 | 0.53mi |
| 621 Marshtree Ln #305 Fayetteville, NC | 2.0 | 2.0 | 1140 | $1,500 | $1.32 | 25d | 1 | 0.56mi |
| 6793 Candlewood Dr Fayetteville, NC | 3.0 | 2.0 | 1240 | $1,475 | $1.19 | 15d | 1 | 0.57mi |
| 942 Stewarts Creek Dr #8 Fayetteville, NC | 2.0 | 2.0 | 1020 | $1,055 | $1.03 | 25d | 1 | 0.57mi |
| 942 Stewarts Creek Dr #9 Fayetteville, NC | 3.0 | 2.0 | 1250 | $1,250 | $1.00 | 25d | 1 | 0.57mi |
| 540 Auburndale Ln Fayetteville, NC | 3.0 | 2.0 | 1100 | $1,600 | $1.45 | 15d | 1 | 0.59mi |
| 625 Marshtree Ln Fayetteville, NC | 2.0–3.0 | 2.0 | 1170 | $1,275 | $1.09 | 15d | 2 | 0.60mi |
| 7252 Ainsley St Fayetteville, NC | 3.0 | 1.0 | 1265 | $1,299 | $1.03 | 25d | 1 | 0.63mi |
| 7298 Ryan St Fayetteville, NC | 4.0 | 1.5 | 1315 | $1,400 | $1.06 | 25d | 1 | 0.68mi |
| 202 Bertram Pl Fayetteville, NC | 3.0 | 2.0 | 1175 | $1,300 | $1.11 | 15d | 1 | 0.75mi |
| 567 Cutchen Ln Fayetteville, NC | 1.0–3.0 | 1.0–2.0 | 975 | $1,425 | $1.46 | 15d | 61 | 0.75mi |
| 495 Stiles Pl Fayetteville, NC | 3.0 | 2.0 | 1300 | $1,250 | $0.96 | 15d | 1 | 0.80mi |
| 111 Grande Oaks Dr Fayetteville, NC | 1.0–3.0 | 1.0–2.0 | 1205 | $1,645 | $1.37 | 15d | 46 | 0.87mi |
| 679 Bartons Landing Pl Fayetteville, NC | 2.0 | 2.0 | 1145 | $1,150 | $1.00 | 25d | 1 | 0.88mi |
| 679 Bartons Landing Pl Unit 6 Fayetteville, NC | 2.0 | 2.0 | 1145 | $1,200 | $1.05 | 25d | 1 | 0.88mi |
| 672 Bartons Landing Pl Fayetteville, NC | 2.0 | 2.0 | 1145 | $1,100 | $0.96 | 15d | 1 | 0.89mi |
| 663 Bartons Landing Pl Unit 2 Fayetteville, NC | 2.0 | 2.0 | 1150 | $1,200 | $1.04 | 15d | 1 | 0.98mi |
| 698 Bartons Landing Pl #5 Fayetteville, NC | 2.0 | 2.0 | 1136 | $1,100 | $0.97 | 25d | 1 | 1.03mi |
| 6445 Independence Pl Dr Fayetteville, NC | 1.0–3.0 | 1.0–3.0 | 1106 | $1,779 | $1.61 | 15d | 18 | 1.04mi |
| 6521 Cissna Dr Fayetteville, NC | 3.0 | 2.0 | 1456 | $1,375 | $0.94 | 15d | 1 | 1.05mi |
| 6510 Cissna Dr Fayetteville, NC | 3.0 | 1.5 | 1100 | $1,095 | $1.00 | 15d | 1 | 1.07mi |
| 5831 Waters Edge Dr Fayetteville, NC | 3.0 | 2.0 | 1344 | $1,545 | $1.15 | 25d | 1 | 1.25mi |
| 3500 Carlson Bay Ct Fayetteville, NC | 1.0–3.0 | 1.0–2.0 | 850 | $1,350 | $1.59 | 15d | 4 | 1.27mi |
Listing history 21 events
-
2026-06-21days on market $159,000 Active 47 DOM
-
2026-06-18days on market $159,000 Active 44 DOM
-
2026-06-17days on market $159,000 Active 43 DOM
-
2026-06-16days on market $159,000 Active 42 DOM
-
2026-06-15days on market $159,000 Active 41 DOM
-
2026-06-14days on market $159,000 Active 39 DOM
-
2026-06-13days on market $159,000 Active 38 DOM
-
2026-06-10days on market $159,000 Active 36 DOM
-
2026-06-09days on market $159,000 Active 35 DOM
-
2026-06-08days on market $159,000 Active 34 DOM
-
2026-06-07days on market $159,000 Active 33 DOM
-
2026-06-03days on market $159,000 Active 29 DOM
-
2026-06-02days on market $159,000 Active 28 DOM
-
2026-06-01days on market $159,000 Active 27 DOM
-
2026-05-31days on market $159,000 Active 26 DOM
-
2026-05-30days on market $159,000 Active 25 DOM
-
2026-05-05$159,000 Active
-
2026-04-27historical $159,000
-
2020-11-17soldstatus $73,750 250-char remark
Show marketing remark (250 chars)
This great home boasts a new roof, new windows and newer HVAC. New duct work! Nest thermostat. Natural Oak hardwood floors, new trim and fresh paint. Also an awesome backyard and privacy fence. SOLD AS IS. CASH ONLY. AGENT IS OWNER and has interest.
-
2020-11-17soldstatus $74,000
Show marketing remark (250 chars)
This great home boasts a new roof, new windows and newer HVAC. New duct work! Nest thermostat. Natural Oak hardwood floors, new trim and fresh paint. Also an awesome backyard and privacy fence. SOLD AS IS. CASH ONLY. AGENT IS OWNER and has interest.
-
2020-10-24$75,000 250-char remark
Show marketing remark (250 chars)
This great home boasts a new roof, new windows and newer HVAC. New duct work! Nest thermostat. Natural Oak hardwood floors, new trim and fresh paint. Also an awesome backyard and privacy fence. SOLD AS IS. CASH ONLY. AGENT IS OWNER and has interest.
ⓘ Source: listings_history table (triggers on properties + properties_extension) + one-shot
backfill from property_details.listing_events for pre-trigger history.
Tax reassessment forecast NC · Resets to sale price
- Current annual tax
- $1,726 · $144/mo
- Projected year-2 tax
- $1,726 · $144/mo
- Expected delta
- $0/yr ($0/mo · 0.0%)
ⓘ Screening estimate from a state-policy table — verify with the county assessor before closing.
Climate risk First Street
- Flood 1/10 Low FEMA zone X (unshaded) · 0% chance over 30 yrs
- Wildfire 4/10 Moderate
- Heat 7/10 Severe 7 d/yr ≥106°F today · 16 d/yr by 30 yrs out
- Wind 7/10 Severe 78% chance of damaging wind over 30 yrs
- Air quality 2/10 Low 0 unhealthy d/yr today · 1 by 30 yrs out
Nearby sold comps map
Loading sold comps map…
Walkable amenities ~0.75 mi
Loading nearby amenities…
Taxation est. · year 1
- Rental income
- $16,603
- − Mortgage interest
- −$8,906
- − Property taxes
- −$1,726
- − Insurance
- −$795
- − Repairs & maintenance
- −$1,328
- − Management
- −$1,328
- − Depreciation
- −$4,625
- Taxable loss
- −$2,106
- Est. tax savings @ 24.0%
- +$506
- After-tax cash flow
- $1,095/yr
For passive investors: Depreciation is non-cash, so a rental often shows a tax loss while cash-flowing — sheltering income. Rental losses are passive: they offset passive income freely, and up to $25,000/yr can offset ordinary (W-2) income if you actively participate and your MAGI is under $100k (phasing out to $0 by $150k); unused losses carry forward. On sale, claimed depreciation is recaptured at up to 25%, and gains may owe capital-gains tax (a 1031 exchange can defer both). Figures are a year-1 estimate at your 24.0% rate — not tax advice; consult a CPA.
Schools (NCES district)
- District
- Cumberland County Schools
- NCES district ID
- 3700011
- Math proficiency
- 32% ▼ -2.00%
- Reading proficiency
- 41% ▼ -1.00%
- Median HH income
- $44,168
- Composite
- 31.0/100
- National rank
- #6096
- State rank
- #126 of 178 in NC
Livability — Fayetteville
- Score
- 75/100
- State rank
- #45
- US rank
- #4031
Category grades
Schools grade is shown separately in the Schools card above.
Census & demographics
- Census place
- Fayetteville, NC
- County
- Cumberland County · 265,314 people
- City population
- 226,118
- Metro
- Fayetteville, NC
- Population (ZIP)
- 55,834
- Household income
- $62,249
- Rent vs Own
- Severe rent burden
- 2511.0
Population outlook (Cumberland County) Hauer SSP2
- Today (2025)
- 330,855 people
- By 2030
- 333,523 · +0.8%
- By 2040
- 335,583 · +1.4%
- By 2050
- 335,325 · +1.4%
- By 2075
- 342,853 · +3.6%
- By 2100
- 340,698 · +3.0%
Race, ethnicity, and origin ACS 2023
- Neighborhood character
- Diverse neighborhood (Simpson 0.67)
- Race & ethnicity
- Black 49% White 25% Hispanic / Latino 16% Two or more races 11% Asian 3%
- Hispanic origin (detail)
- Mexican 5% Puerto Rican 6% Dominican 1%
- Common ancestry
- Slovak 1% Romanian 1% Lithuanian 1%
- Foreign-born
- 9% · Canada, South Korea
- Languages at home
- 84% English-only · Spanish 10% Korean 1% Other Asian/Pacific 1%
Political lean MEDSL · Cumberland
- 2024 margin
- D (+13.4) · D 56.1% · R 42.7% · Other 1.2%
- 2008→2024 swing
- -4.3pp toward R · 2008: 17.7pp · 2024: 13.4pp
- All cycles
- 2024: D+13.4 2020: D+16.6 2016: D+16.0 2012: D+19.7 2008: D+17.7
Not yet ingested
- Civics
- —
Market trends
- HPI YoY
- ▼ -43.20%
- Current HPI
- 231.873
- Rent YoY
- ▲ 3.11%
- Metro
- Fayetteville, NC
- State GDP YoY
- ▲ 3.28%
- F500 in state
- 26
Industry mix (Fortune 500 HQ in NC)
| Industry | F500 HQs | Revenue |
|---|---|---|
| Financial Services | 2 | $213B |
|
||
| Retail | 2 | $95B |
|
||
| Industrial Conglomerate | 1 | $38B |
|
||
| Metals / Steel | 1 | $35B |
|
||
| Utilities | 1 | $30B |
|
||
| Industrial Machinery | 1 | $19B |
|
||
Price history
+112.0% since first listed5 events — show timeline
- 2026-05-05 Listed $159,000 LPRMLS
- 2026-04-27 Coming Soon $159,000 LPRMLS
- 2020-11-17 Sold (Public Records) $74,000 Public Records
- 2020-11-17 Sold (MLS) $73,750 LPRMLS
- 2020-10-24 Listed $75,000 LPRMLS
Property tax history
+5.7%/yrLatest (2025): $1,726 · +38.3% YoY. Source: county tax records.
Cash-flow waterfall
monthlySold comps — $/sqft
last 12 mo · ≤1 miLoading sold comps…