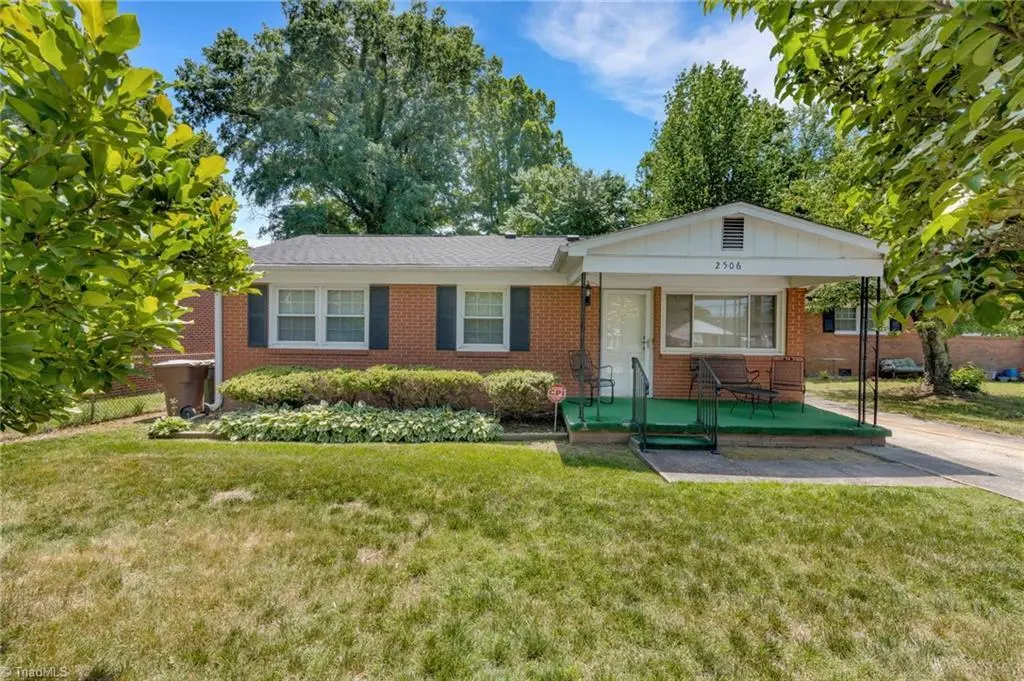
2506 Aster Dr · Greensboro, NC
Flood risk 1/10 · Minimal
- FEMA flood zone
- X (unshaded)
- Chance of flooding over 30 yrs
- 0.0%
- Est. flood insurance / yr
- $507 – $1,088
Fire risk 1/10 · Minimal
- Est. fire insurance / yr
- $906 – $1,684
Heat risk 5/10 · Moderate
- Hot days now (above 103°F)
- 7 days/yr
- Hot days in 30 yrs
- 18 days/yr
Wind risk 4/10 · Minor
- Chance of severe wind over 30 yrs
- 16.0%
Air-quality risk 2/10 · Minimal
- Unhealthy air days now
- 1 days/yr
- Unhealthy air days in 30 yrs
- 2 days/yr
Risk factors via First Street. Map © Google.
Why this score? — see what drove the D grade
The composite is a weighted blend of 9 inputs, each scored 0–100. Each bar is that input's sub-score; the figure is the points it added to the 100-point composite (weight × sub-score).
- ARV discount +13.8/15.0
- Cash flow +10.3/30.0
- Livability +4.0/5.0
- Schools +3.6/10.0
- DSCR +2.9/10.0
- Rent growth +2.9/5.0
- Condition / age +2.5/5.0
- 1% rule +2.2/10.0
- Appreciation +0.0/10.0
$214,900
🖨 Deal sheet (PDF) 📄 Offer letter ✓ Due diligence
Listing remarks
Welcome… your next chapter begins here. Step into this inviting, well-maintained 1851 sq ft, 3-bedroom, 2-bath home located in a well-established neighborhood where comfort meets possibility. The light-filled living room offers a warm, welcoming space perfect for relaxing or entertaining. Down the hall, three bedrooms and a full bath with a tub/shower combination. The kitchen features a cozy breakfast nook—ideal for quiet mornings or casual gatherings. An oversized archway leads to a spacious great room (23’ X 15’) with a fireplace, a second full bath with a separate shower, and a convenient laundry area. Double sliding doors open to a generous sunroom (21’ x
Key facts
- 8,276 sq ft lot
- Built 1962
- Listed 30 days
Property features AI
Finance
- Other: Publicly maintained road access
- Financial info: Property tax information available
- HOA & community: No association; Subdivision: R.J. Holden Estate
Exterior
- Parking: Driveway (no garage)
- Security: Deadbolt locks
- Utilities: Public water; Public sewer; Gas water heater; Electric power
- Home design: Residential stick/site-built house; One story; Built in 1962; Includes storage structure; One fireplace with blower fan in great room
- Construction: Brick construction; Crawl space foundation
- Exterior features: Exterior lighting; Fenced yard; Cleared lot
Interior
- Kitchen: Oven; Cooktop; Dishwasher; Exhaust fan
- Bedrooms: Bedrooms located on the main level
- Flooring: Carpet; Tile; Vinyl
- Bathrooms: 2 full bathrooms
- Heating & cooling: Electric baseboard heating; Central air conditioning
- Interior features: Primary bedroom on main level; Pulldown attic stairs; Storm windows; Great room; Ceiling fan(s); Deadbolt(s); Separate shower
- Laundry & utility: Washer hookup; Dryer connection; Laundry on main level; Gas water heater
Neighborhood map
What this means for you Summary
Snapshot
- This is a 3-bed/2.0-bath single-family listed at $215k.
Deal economics
- At list price, monthly cash flow is $-119 ($-1k/yr) — negative.
- To cash-flow at today's rent, offer at most $194k (9.8% below list).
- To meet the 1% rule (rent ≥ 1% of price), the offer needs to be $154k (28.5% below list).
- Recommended offer: $154k (28.5% below list) — sets the bar for 1% rule.
- Cap rate 5.6% vs local median 3.8% in Greensboro — top-decile yield for the area; either an underpriced asset or a hidden risk that comps aren't pricing in. Stress-test before assuming the spread holds.
Location & tenants
- Location reads 81/100 on livability (#12 in NC, #1,335 nationally) — a professional / high-income tenant draw. Strengths: amenities A+, commute A+, cost of living A+; Watch: employment D, crime F.
- Guilford County Schools (urban): math 39% / reading 45% proficiency, ranked #99 of 178 in NC (top 56%) — families likely to look elsewhere, expect single-tenant / working-renter base with shorter leases.
- Market conditions: Rents rising (+1.8%/yr); 125 active listings in the ZIP; 15 comparable units currently listed for rent nearby; rentals at typical pace (median 24d on market — plan ~3-4 weeks tenant-placement turnaround); 3,843 units permitted in Guilford County in 2024 (2,397 in 5+ unit buildings).
- This rent runs 38% of the median local income ($48k/yr) — at the standard rent-burdened threshold; future hikes will face affordability resistance.
Forward outlook
- Local home prices are declining (-3.0%/yr); year-one equity from $1k of loan paydown is wiped out by about $6k of value loss. Plan a longer hold.
- Guilford County population projected at +26% by 2050 — long-run rental-demand tailwind backs the buy-and-hold thesis.
Negotiation context
- It's been on market 30 days — a 2% lower offer ($212k) is reasonable based on typical stale-listing flexibility.
Risks & watch-outs
- Climate carrying-cost: extreme-heat days projected 7→18/yr by 2055 (HVAC capex compounding) — expect insurance premiums to compound above CPI over the hold.
Questions for the listing agent
- What do current leases actually rent for vs. the listed asking? Can we see a recent rent roll and the last 12 months of T-12 income?
- Built in 1962 — when were the roof, HVAC, electrical panel, plumbing, and water heater last replaced?
- Is there a deadline driving the sale (1031 exchange, divorce, estate, relocation)? That informs how much negotiation room exists.
- Crime grade is F in this area — have there been break-ins, vandalism, or insurance claims at this property in the last 3 years? What carrier currently insures it and at what premium?
- The area grade is low — what's the realistic commute time and amenity access for the typical tenant pool here? Any planned neighborhood developments (good or bad) we should know about?
- What's the average days-on-market for RENTAL listings here right now (not sales)? A rising rental-DOM trend means longer vacancies and softer asking-rent achievability than the comps imply.
- What's the recent tenant-quality profile in this submarket — average credit score on applications, eviction rate, late-payment / NSF rate, and stable-employment percentage? A property-management company in the area should have these aggregated.
- How much new for-sale + rental construction is in the pipeline within 1–3 miles? Heavy new supply typically softens prices + rents 12–24 months out; constrained supply supports both.
Investment metrics
- 1% rule
- 0.72% ✗
- Cap rate
- 5.63%
- Cash-on-cash
- -2.37%
- DSCR
- 0.89
- GRM
- 11.6
CMA / ARV
- ARV (on-the-fly)
- $250,038
- Comps found
- 12
Show comp detail 12 sales within ~0.75 mi
| Address | Dist | Beds/Ba | Sqft | Sold | Price | $/sf | Match |
|---|---|---|---|---|---|---|---|
| 2702 Aster Dr | 0.18mi | 3/2.0 | 1,510 (+5%) | 6mo | $224,900 | $149 | 78 |
| 2120 Wythe St | 0.44mi | 3/2.0 | 1,444 (+0%) | 6mo | $275,000 | $190 | 74 |
| 1209 Maury Ln | 0.07mi | 3/2.5 | 1,304 (-9%) | 11mo | $226,500 | $174 | 70 |
| 900 Beaumont Ave | 0.61mi | 3/2.0 | 1,332 (-7%) | 2mo | $203,800 | $153 | 57 |
| 4 Pear Tree Ct | 0.24mi | 3/2.0 | 1,228 (-14%) | 12mo | $226,000 | $184 | 54 |
| 1322 Ardmore Dr | 0.23mi | 4/2.0 (+1) | 1,621 (+13%) | 12mo | $226,000 | $139 | 53 |
| 1411 Blueberry Ln | 0.19mi | 4/1.5 (+1) | 1,255 (-13%) | 12mo | $266,000 | $212 | 53 |
| 919 Pine St | 0.67mi | 4/2.0 (+1) | 1,351 (-6%) | 3mo | $219,000 | $162 | 51 |
| 2027 Florida St | 0.57mi | 3/2.0 | 1,250 (-13%) | 4mo | $100,000 | $80 | 48 |
| 2105 Joe Louis Ave | 0.59mi | 4/2.5 (+1) | 1,552 (+8%) | 5mo | $270,500 | $174 | 47 |
| 2102 Linda Jones Ave | 0.62mi | 3/2.5 | 1,262 (-12%) | 3mo | $249,900 | $198 | 46 |
| 2006 Linda Jones Ave | 0.66mi | 3/2.5 | 1,262 (-12%) | 13mo | $249,900 | $198 | 36 |
Match score weights: distance 35% · size 25% · config 20% · recency 20%. Top-matched comps best support the ARV.
Projected returns pro-forma
-3.0% appreciation · 1.78% rent growth · sell at horizon
- IRR
- -21.5%
- Equity multiple
- 0.26×
- Total profit
- $-44,340
- Equity at exit
- $32,042
- IRR
- -18.0%
- Equity multiple
- 0.07×
- Total profit
- $-56,123
- Equity at exit
- $18,581
Cash invested: $60,172 (down + closing). Projections, not guarantees.
Landlord ↔ Tenant lean methodology
- Overall (STATE)
- 85 Strongly Landlord-Friendly
- State North Carolina
- 85 Strongly Landlord-Friendly · R+3
- County
- — inherits STATE
- City
- — inherits STATE
ZIP-level market 27401
- Home prices YoY
- -28.9%
- Rents YoY
- 1.8%
- Active inventory
- 125
- Price-to-rent
- 11.6×
Monthly cashflow live
- Estimated rent
- $1,537 high interval (Pro) →
- Mortgage (P&I)
- −$1,127
- Tax from tax record
- −$117 /mo · $1,406/yr
- Insurance
- −$90
- HOA
- −$0
- Vacancy / Maint / Mgmt
- −$323
- Net cashflow
- $-119
Break-even live
Sensitivity live
| Price | -10% $3 | -5% $-58 | +0% $-119 | +5% $-180 | +10% $-241 |
|---|---|---|---|---|---|
| Rent | -10% $-241 | -5% $-180 | +0% $-119 | +5% $-58 | +10% $2 |
| Rate | -1.0pp $-11 | -0.5pp $-64 | base $-119 | +0.5pp $-175 | +1.0pp $-231 |
UW: 25.0% down · 7.5% · 30yr · 1.5% tax · 5.0% vac · 8.0% maint · 8.0% mgmt
Financing live
Cash to close
- Down payment
- $53,725
- Closing costs
- $6,447
- Reserves months
- —
- Total cash needed
- —
Loan-product check · same deal, 3 products live
Conventional
25% down · 7.5% · 30yr
- Down + closing
- —
- Monthly P&I
- —
- Monthly cashflow
- —
- DSCR
- —
- Eligible?
- —
Personal DTI + credit; lowest rate.
DSCR
20% down · 8.5% · 30yr
- Down + closing
- —
- Monthly P&I
- —
- Monthly cashflow
- —
- DSCR
- —
- Eligible?
- —
No personal income docs; deal must DSCR.
Hard money
10% down · 12.0% · 12mo
- Down + closing
- —
- Monthly P&I
- —
- Monthly cashflow
- —
- DSCR
- —
- Eligible?
- —
Short-term bridge; refi at stabilization.
Rent comps 15 comps
| Address | Beds | Baths | Sqft | Rent | $/sqft | DOM | Units | Dist |
|---|---|---|---|---|---|---|---|---|
| 1404 Ardmore Dr Greensboro, NC | 3.0 | 2.0 | 1094 | $1,625 | $1.49 | 15d | 1 | 0.28mi |
| 2117 Tuscaloosa St Greensboro, NC | 3.0 | 1.0 | 1000 | $1,600 | $1.60 | 24d | 1 | 0.51mi |
| 909 Beaumont Ave Greensboro, NC | 4.0 | 2.0 | 1192 | $1,625 | $1.36 | 24d | 1 | 0.55mi |
| 1610 Eastwood Ave Greensboro, NC | 3.0 | 2.0 | 950 | $1,750 | $1.84 | 24d | 1 | 0.62mi |
| 112 S Raleigh St Greensboro, NC | 3.0 | 1.0 | 1000 | $1,200 | $1.20 | 24d | 1 | 1.12mi |
| 110 S Raleigh St Greensboro, NC | 3.0 | 1.0 | 1000 | $1,200 | $1.20 | 24d | 1 | 1.13mi |
| 1923 Belcrest Dr Greensboro, NC | 4.0 | 1.5 | 1205 | $1,895 | $1.57 | 19d | 1 | 1.25mi |
| 4014 Mountainridge Dr Greensboro, NC | 4.0 | 2.5 | 1445 | $1,795 | $1.24 | 19d | 1 | 1.29mi |
| 201 Huffman St Greensboro, NC | 3.0 | 2.0 | 1350 | $1,000 | $0.74 | 15d | 1 | 1.29mi |
| 4020 Mountainridge Dr Greensboro, NC | 4.0 | 2.5 | 1500 | $1,825 | $1.22 | 24d | 1 | 1.31mi |
| 3817 Central Ave Greensboro, NC | 4.0 | 2.0 | 1200 | $1,740 | $1.45 | 15d | 1 | 1.32mi |
| 3900 Hahns Ln Greensboro, NC | 2.0 | 1.0 | 880 | $955 | $1.09 | 15d | 8 | 1.35mi |
| 904 Stephens St Greensboro, NC | 3.0 | 1.0 | 1052 | $1,490 | $1.42 | 15d | 1 | 1.39mi |
| 311 Guerrant St Greensboro, NC | 3.0 | 1.0 | 1025 | $1,295 | $1.26 | 24d | 1 | 1.41mi |
| 2007 S Benbow Rd Greensboro, NC | 3.0 | 1.0 | 960 | $1,100 | $1.15 | 24d | 1 | 1.42mi |
Listing history 12 events
-
2026-06-18days on market $214,900 Active 30 DOM
-
2026-06-17days on market $214,900 Active 29 DOM
-
2026-06-16days on market $214,900 Active 28 DOM
-
2026-06-15days on market $214,900 Active 27 DOM
-
2026-06-14pricedays on market $214,900 Active 25 DOM
-
2026-06-10days on market $219,900 Active 22 DOM
-
2026-06-09days on market $219,900 Active 21 DOM
-
2026-06-08days on market $219,900 Active 20 DOM
-
2026-06-07statusdays on market $219,900 Active 19 DOM
-
2026-05-21status Pending Accepting Backup Offers
-
2026-05-06$219,900 Active
-
2026-05-03historical $219,900
ⓘ Source: listings_history table (triggers on properties + properties_extension) + one-shot
backfill from property_details.listing_events for pre-trigger history.
Tax reassessment forecast NC · Resets to sale price
- Current annual tax
- $1,406 · $117/mo
- Projected year-2 tax
- $1,762 · $147/mo
- Expected delta
- +$357/yr (+$30/mo · 25.4%)
ⓘ Screening estimate from a state-policy table — verify with the county assessor before closing.
Climate risk First Street
- Flood 1/10 Low FEMA zone X (unshaded) · 0% chance over 30 yrs
- Wildfire 1/10 Low
- Heat 5/10 Major 7 d/yr ≥103°F today · 18 d/yr by 30 yrs out
- Wind 4/10 Moderate 16% chance of damaging wind over 30 yrs
- Air quality 2/10 Low 1 unhealthy d/yr today · 2 by 30 yrs out
Nearby sold comps map
Loading sold comps map…
Walkable amenities ~0.75 mi
Loading nearby amenities…
Taxation est. · year 1
- Rental income
- $18,450
- − Mortgage interest
- −$12,038
- − Property taxes
- −$1,406
- − Insurance
- −$1,074
- − Repairs & maintenance
- −$1,476
- − Management
- −$1,476
- − Depreciation
- −$6,252
- Taxable loss
- −$5,272
- Est. tax savings @ 24.0%
- +$1,265
- After-tax cash flow
- $-163/yr
For passive investors: Depreciation is non-cash, so a rental often shows a tax loss while cash-flowing — sheltering income. Rental losses are passive: they offset passive income freely, and up to $25,000/yr can offset ordinary (W-2) income if you actively participate and your MAGI is under $100k (phasing out to $0 by $150k); unused losses carry forward. On sale, claimed depreciation is recaptured at up to 25%, and gains may owe capital-gains tax (a 1031 exchange can defer both). Figures are a year-1 estimate at your 24.0% rate — not tax advice; consult a CPA.
Schools (NCES district)
- District
- Guilford County Schools
- NCES district ID
- 3701920
- Math proficiency
- 39% ▲ 1.00%
- Reading proficiency
- 45% ▲ 1.00%
- Median HH income
- $46,315
- Composite
- 35.78/100
- National rank
- #4842
- State rank
- #99 of 178 in NC
Livability — Greensboro
- Score
- 81/100
- State rank
- #12
- US rank
- #1335
Category grades
Schools grade is shown separately in the Schools card above.
Census & demographics
- Census place
- Greensboro, NC
- County
- Guilford County · 487,190 people
- City population
- 329,421
- Metro
- Greensboro-High Point, NC
- Population (ZIP)
- 21,920
- Household income
- $47,972
- Rent vs Own
- Severe rent burden
- 1138.0
Population outlook (Guilford County) Hauer SSP2
- Today (2025)
- 584,596 people
- By 2030
- 616,851 · +5.5%
- By 2040
- 678,451 · +16.1%
- By 2050
- 734,788 · +25.7%
- By 2075
- 862,985 · +47.6%
- By 2100
- 948,704 · +62.3%
Race, ethnicity, and origin ACS 2023
- Neighborhood character
- Majority Black (62%)
- Race & ethnicity
- Black 62% White 26% Hispanic / Latino 8% Two or more races 4% Asian 1%
- Hispanic origin (detail)
- Mexican 4%
- Common ancestry
- Italian 1% Serbian 1% Slovak 1%
- Foreign-born
- 9% · Canada
- Languages at home
- 88% English-only · Spanish 6% Arabic 2% French/Haitian/Cajun 1%
Political lean MEDSL · Guilford
- 2024 margin
- Strong D (+21.8) · D 60.2% · R 38.4% · Other 1.4%
- 2008→2024 swing
- +3.5pp toward D · 2008: 18.4pp · 2024: 21.8pp
- All cycles
- 2024: D+21.8 2020: D+23.1 2016: D+20.0 2012: D+16.5 2008: D+18.4
Not yet ingested
- Civics
- —
Market trends
- HPI YoY
- ▼ -97.87%
- Current HPI
- 240.5377
- Rent YoY
- ▲ 1.78%
- Metro
- Greensboro-High Point, NC
- State GDP YoY
- ▲ 3.28%
- F500 in state
- 26
Industry mix (Fortune 500 HQ in NC)
| Industry | F500 HQs | Revenue |
|---|---|---|
| Financial Services | 2 | $213B |
|
||
| Retail | 2 | $95B |
|
||
| Industrial Conglomerate | 1 | $38B |
|
||
| Metals / Steel | 1 | $35B |
|
||
| Utilities | 1 | $30B |
|
||
| Industrial Machinery | 1 | $19B |
|
||
Price history
+0.0% since first listed3 events — show timeline
- 2026-05-21 Pending — Triad MLS
- 2026-05-06 Listed $219,900 Triad MLS
- 2026-05-03 Coming Soon $219,900 Triad MLS
Property tax history
+3.4%/yrLatest (2025): $1,406 · +0.0% YoY. Source: county tax records.
Cash-flow waterfall
monthlySold comps — $/sqft
last 12 mo · ≤1 miLoading sold comps…