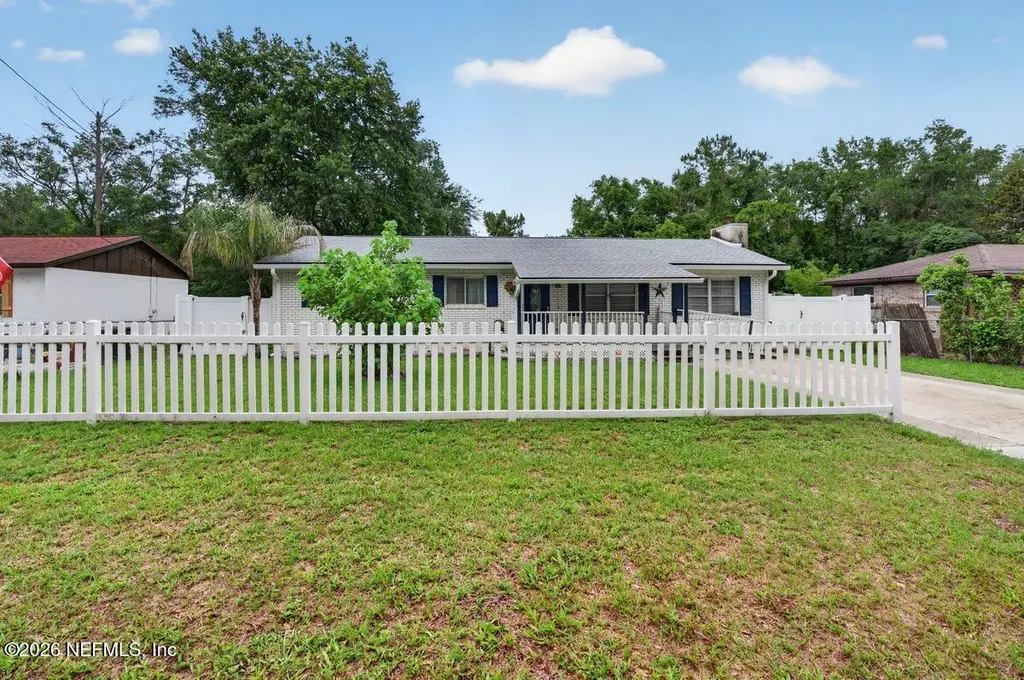
1208 Melrose Ave · Green Cove Springs, FL
Flood risk 1/10 · Minimal
- FEMA flood zone
- X (unshaded)
- Chance of flooding over 30 yrs
- 0.0%
- Est. flood insurance / yr
- $507 – $1,088
Fire risk 6/10 · Moderate
- Est. fire insurance / yr
- $947 – $1,759
Heat risk 9/10 · Severe
- Hot days now (above 108°F)
- 7 days/yr
- Hot days in 30 yrs
- 20 days/yr
Wind risk 9/10 · Severe
- Chance of severe wind over 30 yrs
- 99.0%
Air-quality risk 3/10 · Minor
- Unhealthy air days now
- 3 days/yr
- Unhealthy air days in 30 yrs
- 3 days/yr
Risk factors via First Street. Map © Google.
Why this score? — see what drove the C- grade
The composite is a weighted blend of 9 inputs, each scored 0–100. Each bar is that input's sub-score; the figure is the points it added to the 100-point composite (weight × sub-score).
- Cash flow +15.4/30.0
- ARV discount +15.0/15.0
- Schools +5.1/10.0
- DSCR +4.7/10.0
- Livability +3.8/5.0
- 1% rule +3.0/10.0
- Rent growth +2.6/5.0
- Condition / age +2.5/5.0
- Appreciation +0.0/10.0
$220,000
🖨 Deal sheet 📄 Offer letter ✓ Due diligence
Listing remarks
Charming 3-bedroom, 1-bath home with great curb appeal featuring a classic picket fence and welcoming front deck--perfect for enjoying your morning coffee or relaxing in the evening. Inside, you'll find a cozy living area with a fireplace and a functional layout designed for comfortable living. The property also includes a fenced yard, storage buildings for extra space, and a concrete driveway with ample parking. Conveniently located near shopping, dining, schools, and major roadways. A wonderful opportunity for first-time homebuyers, downsizers, or investors alike.
Key facts
- Picket fence
- Front deck
- Fenced yard
Tags
Property features AI
Finance
- Financial info: $1,874.62 annual tax
Exterior
- Parking: On-street parking
- Utilities: Public sewer; Cable available; Electric connected; Water connected; Asphalt road
- Home design: Single family residence; Entry level: 1
- Construction: Concrete construction
- Exterior features: Deck; Front porch; Screened porch; Porch; Fenced backyard; Shed(s)
Interior
- Kitchen: Dishwasher; Electric range; Microwave; Refrigerator
- Bedrooms: 3 bedrooms
- Bathrooms: 1 full bathroom
- Heating & cooling: Central heating; Central air conditioning
- Interior features: Fireplace (1)
- Laundry & utility: Unfurnished (no washer/dryer included listed)
Neighborhood map
What this means for you Summary
Snapshot
- This is a 2-bed/1.0-bath single-family listed at $220k.
Deal economics
- At list price, monthly cash flow is $83 ($991/yr) — positive.
- The deal already cash-flows at list — no discount required.
- To meet the 1% rule (rent ≥ 1% of price), the offer needs to be $176k (20.0% below list).
- Recommended offer: $176k (20.0% below list) — sets the bar for 1% rule.
- Cap rate 6.7% vs local median 4.2% in Green Cove Springs — top-decile yield for the area; either an underpriced asset or a hidden risk that comps aren't pricing in. Stress-test before assuming the spread holds.
Location & tenants
- Location reads 75/100 on livability (#245 in FL, #3,868 nationally) — a middle-class / working-renter tenant base. Strengths: cost of living A+, housing A+, health & safety A+; Watch: schools C-, amenities F, commute F.
- Clay (suburban): math 58% / reading 59% proficiency, ranked #14 of 73 in FL (top 19%) — acceptable for families but not a draw, mixed tenant base, ~2y average lease.
- Market conditions: Rents flat; 885 active listings in the ZIP; 11 comparable units currently listed for rent nearby; rentals leasing fast (median 4d on market — plan ~1-2 weeks tenant-placement turnaround); solid renter incomes; 1,876 units permitted in Clay County in 2024 (14 in 5+ unit buildings).
Forward outlook
- Local home prices are declining (-3.0%/yr); year-one equity from $2k of loan paydown is wiped out by about $7k of value loss. Plan a longer hold.
- Clay County population projected at +19% by 2050 — long-run rental-demand tailwind backs the buy-and-hold thesis.
Negotiation context
- It's been on market 17 days — a 2% lower offer ($217k) is reasonable based on typical stale-listing flexibility.
- Current owner paid $44k; list at $220k implies a 406% gain — meaningful room to come down on a strong offer.
Risks & watch-outs
- Climate carrying-cost: severe wind risk, 99% chance of damaging wind over 30y; major wildfire risk; extreme-heat days projected 7→20/yr by 2055 (HVAC capex compounding) — expect insurance premiums to compound above CPI over the hold.
Questions for the listing agent
- Built in 1975 — when were the roof, HVAC, electrical panel, plumbing, and water heater last replaced?
- Is there a deadline driving the sale (1031 exchange, divorce, estate, relocation)? That informs how much negotiation room exists.
- What's the average days-on-market for RENTAL listings here right now (not sales)? A rising rental-DOM trend means longer vacancies and softer asking-rent achievability than the comps imply.
- What's the recent tenant-quality profile in this submarket — average credit score on applications, eviction rate, late-payment / NSF rate, and stable-employment percentage? A property-management company in the area should have these aggregated.
- How much new for-sale + rental construction is in the pipeline within 1–3 miles? Heavy new supply typically softens prices + rents 12–24 months out; constrained supply supports both.
Investment metrics
- 1% rule
- 0.80% ✗
- Cap rate
- 6.74%
- Cash-on-cash
- 1.61%
- DSCR
- 1.07
- GRM
- 10.4
CMA / ARV
- ARV (on-the-fly)
- $266,952
- Comps found
- 12
Show comp detail 12 sales within ~0.75 mi
| Address | Dist | Beds/Ba | Sqft | Sold | Price | $/sf | Match |
|---|---|---|---|---|---|---|---|
| 104 Jack St | 0.56mi | 3/1.0 (+1) | 1,180 (+0%) | 1mo | $252,000 | $214 | 67 |
| 411 Pearl St | 0.41mi | 3/2.0 (+1) | 1,140 (-3%) | 5mo | $240,000 | $211 | 63 |
| 1303 Bonaventure Ave | 0.55mi | 3/2.0 (+1) | 1,185 (+1%) | 5mo | $267,500 | $226 | 60 |
| 4116 Audubon Ave | 0.56mi | 3/2.0 (+1) | 1,245 (+6%) | 1mo | $294,940 | $237 | 54 |
| 20 Vermont Ave | 0.72mi | 3/1.0 (+1) | 1,145 (-3%) | 4mo | $225,000 | $197 | 54 |
| 429 Melrose Ave | 0.31mi | 3/1.5 (+1) | 1,025 (-13%) | 6mo | $199,000 | $194 | 52 |
| 4144 Audubon Ave | 0.62mi | 3/2.0 (+1) | 1,245 (+6%) | 2mo | $294,440 | $236 | 51 |
| 1326 Little Heron Pl | 0.70mi | 3/2.0 (+1) | 1,245 (+6%) | 3mo | $284,990 | $229 | 46 |
| 1390 Little Heron Pl | 0.73mi | 3/2.0 (+1) | 1,245 (+6%) | 2mo | $286,000 | $230 | 46 |
| 1366 Little Heron Pl | 0.72mi | 3/2.0 (+1) | 1,245 (+6%) | 3mo | $283,000 | $227 | 45 |
| 1315 Little Heron Pl | 0.73mi | 3/2.0 (+1) | 1,245 (+6%) | 3mo | $295,990 | $238 | 45 |
| 407 Green St S | 0.59mi | 3/2.0 (+1) | 1,288 (+10%) | 4mo | $270,000 | $210 | 45 |
Match score weights: distance 35% · size 25% · config 20% · recency 20%. Top-matched comps best support the ARV.
Projected returns pro-forma
-3.0% appreciation · 0.46% rent growth · sell at horizon
- IRR
- -16.3%
- Equity multiple
- 0.43×
- Total profit
- $-34,879
- Equity at exit
- $32,803
- IRR
- -12.6%
- Equity multiple
- 0.33×
- Total profit
- $-41,128
- Equity at exit
- $19,022
Cash invested: $61,600 (down + closing). Projections, not guarantees.
Landlord ↔ Tenant lean methodology
- Overall (STATE)
- 87 Strongly Landlord-Friendly
- State Florida
- 87 Strongly Landlord-Friendly · R+3
- County
- — inherits STATE
- City
- — inherits STATE
ZIP-level market 32043
- Home prices YoY
- -26.3%
- Rents YoY
- 0.5%
- Active inventory
- 885
- Price-to-rent
- 10.4×
Monthly cashflow live
- Estimated rent
- $1,760 high interval (Pro) →
- Mortgage (P&I)
- −$1,154
- Tax from tax record
- −$62 /mo · $749/yr
- Insurance
- −$92
- HOA
- −$0
- Vacancy / Maint / Mgmt
- −$370
- Net cashflow
- $83
Break-even live
UW: 25.0% down · 7.5% · 30yr · 1.5% tax · 5.0% vac · 8.0% maint · 8.0% mgmt
Financing live
Cash to close
- Down payment
- $55,000
- Closing costs
- $6,600
- Reserves months
- —
- Total cash needed
- —
Loan-product check · same deal, 3 products live
Conventional
25% down · 7.5% · 30yr
- Down + closing
- —
- Monthly P&I
- —
- Monthly cashflow
- —
- DSCR
- —
- Eligible?
- —
Personal DTI + credit; lowest rate.
DSCR
20% down · 8.5% · 30yr
- Down + closing
- —
- Monthly P&I
- —
- Monthly cashflow
- —
- DSCR
- —
- Eligible?
- —
No personal income docs; deal must DSCR.
Hard money
10% down · 12.0% · 12mo
- Down + closing
- —
- Monthly P&I
- —
- Monthly cashflow
- —
- DSCR
- —
- Eligible?
- —
Short-term bridge; refi at stabilization.
Rent comps 11 comps
| Address | Beds | Baths | Sqft | Rent | $/sqft | DOM | Units | Dist |
|---|---|---|---|---|---|---|---|---|
| 4019 Pine Hill Pt Unit 4019 Green Cove Springs, FL | 3.0 | 2.5 | 1306 | $1,850 | $1.42 | 23d | 1 | 0.48mi |
| 806 Oak St Unit 14 Green Cove Springs, FL | 2.0 | 2.0 | 1200 | $1,600 | $1.33 | 3d | 1 | 0.49mi |
| 806 Oak St Unit 14 Green Cove Springs, FL | 2.0 | 2.0 | 1200 | $1,600 | $1.33 | 2d | 1 | 0.49mi |
| 806 Oak St Unit 10 Green Cove Springs, FL | 2.0 | 1.0 | 1000 | $1,400 | $1.40 | 3d | 1 | 0.49mi |
| 806 Oak St Unit 10 Green Cove Springs, FL | 2.0 | 1.0 | 1000 | $1,400 | $1.40 | 2d | 1 | 0.49mi |
| 4028 Pine Hill Pt Unit 4028 Green Cove Springs, FL | 3.0 | 2.5 | 1306 | $1,850 | $1.42 | 23d | 1 | 0.50mi |
| 4016 Pine Hill Pt Unit 4016 Green Cove Springs, FL | 3.0 | 2.5 | 1306 | $1,850 | $1.42 | 23d | 1 | 0.50mi |
| 410 Center St Green Cove Springs, FL | 3.0 | 1.0 | 1100 | $1,600 | $1.45 | 23d | 1 | 0.97mi |
| 4028 Pine Ave Unit 1 Green Cove Springs, FL | 3.0 | 2.5 | 1304 | $1,850 | $1.42 | 2d | 1 | 1.09mi |
| 4019 Pine Ave Unit 1 Green Cove Springs, FL | 3.0 | 2.5 | 1304 | $1,850 | $1.42 | 2d | 1 | 1.09mi |
| 104 Saint Elmo Rd Green Cove Springs, FL | 2.0 | 1.0 | 1120 | $1,850 | $1.65 | 23d | 1 | 1.18mi |
Listing history 12 events
-
2026-06-18days on market $220,000 Active 17 DOM
-
2026-06-17days on market $220,000 Active 16 DOM
-
2026-06-16days on market $220,000 Active 15 DOM
-
2026-06-15days on market $220,000 Active 14 DOM
-
2026-06-13days on market $220,000 Active 12 DOM
-
2026-06-13days on market $220,000 Active 11 DOM
-
2026-06-09days on market $220,000 Active 8 DOM
-
2026-06-08days on market $220,000 Active 7 DOM
-
2026-06-07days on market $220,000 Active 6 DOM
-
2026-06-03days on market $220,000 Active 2 DOM
-
2026-06-02remarks 572-char remark
-
2026-06-02$220,000 Active 1 DOM
ⓘ Source: listings_history table (triggers on properties + properties_extension) + one-shot
backfill from property_details.listing_events for pre-trigger history.
Tax reassessment forecast FL · Resets to sale price
- Current annual tax
- $749 · $62/mo
- Projected year-2 tax
- $1,826 · $152/mo
- Expected delta
- +$1,077/yr (+$90/mo · 143.9%)
ⓘ Screening estimate from a state-policy table — verify with the county assessor before closing.
Climate risk First Street
- Flood 1/10 Low FEMA zone X (unshaded) · 0% chance over 30 yrs
- Wildfire 6/10 Major
- Heat 9/10 Extreme 7 d/yr ≥108°F today · 20 d/yr by 30 yrs out
- Wind 9/10 Extreme 99% chance of damaging wind over 30 yrs
- Air quality 3/10 Moderate 3 unhealthy d/yr today · 3 by 30 yrs out
Nearby sold comps map
Loading sold comps map…
Walkable amenities ~0.75 mi
Loading nearby amenities…
Taxation est. · year 1
- Rental income
- $21,119
- − Mortgage interest
- −$12,323
- − Property taxes
- −$749
- − Insurance
- −$1,100
- − Repairs & maintenance
- −$1,690
- − Management
- −$1,690
- − Depreciation
- −$6,400
- Taxable loss
- −$2,832
- Est. tax savings @ 24.0%
- +$680
- After-tax cash flow
- $1,671/yr
For passive investors: Depreciation is non-cash, so a rental often shows a tax loss while cash-flowing — sheltering income. Rental losses are passive: they offset passive income freely, and up to $25,000/yr can offset ordinary (W-2) income if you actively participate and your MAGI is under $100k (phasing out to $0 by $150k); unused losses carry forward. On sale, claimed depreciation is recaptured at up to 25%, and gains may owe capital-gains tax (a 1031 exchange can defer both). Figures are a year-1 estimate at your 24.0% rate — not tax advice; consult a CPA.
Schools (NCES district)
- District
- Clay
- NCES district ID
- 1200300
- Math proficiency
- 58% ▼ -8.00%
- Reading proficiency
- 59% ▼ -3.00%
- Median HH income
- $59,379
- Composite
- 50.73/100
- National rank
- #1815
- State rank
- #14 of 73 in FL
Livability — Green Cove Springs
- Score
- 75/100
- State rank
- #245
- US rank
- #3868
Category grades
Schools grade is shown separately in the Schools card above.
Census & demographics
- Census place
- Green Cove Springs, FL
- County
- Clay County · 208,450 people
- City population
- 34,562
- Metro
- Jacksonville, FL
- Population (ZIP)
- 34,562
- Household income
- $84,145
- Rent vs Own
- Severe rent burden
- 449.0
Population outlook (Clay County) Hauer SSP2
- Today (2025)
- 230,495 people
- By 2030
- 242,427 · +5.2%
- By 2040
- 262,244 · +13.8%
- By 2050
- 275,148 · +19.4%
- By 2075
- 295,397 · +28.2%
- By 2100
- 287,592 · +24.8%
Race, ethnicity, and origin ACS 2023
- Neighborhood character
- Predominantly White (77%)
- Race & ethnicity
- White 77% Black 10% Two or more races 7% Hispanic / Latino 6% Asian 2%
- Hispanic origin (detail)
- Mexican 2% Puerto Rican 1%
- Common ancestry
- Slovak 3% Romanian 2% Lithuanian 2%
- Foreign-born
- 5% · Canada
- Languages at home
- 92% English-only · Spanish 5% French/Haitian/Cajun 1% Other Indo-European 1%
Political lean MEDSL · Clay
- 2024 margin
- Solid R (+39.3) · D 29.9% · R 69.2%
- 2008→2024 swing
- +3.6pp toward D · 2008: -42.8pp · 2024: -39.3pp
- All cycles
- 2024: R+39.3 2020: R+37.1 2016: R+44.3 2012: R+45.8 2008: R+42.8
Not yet ingested
- Civics
- —
Market trends
- HPI YoY
- ▼ -107.34%
- Current HPI
- 301.3212
- Rent YoY
- ▲ 0.46%
- Metro
- Jacksonville, FL
- State GDP YoY
- ▲ 3.28%
- F500 in state
- 36
Industry mix (Fortune 500 HQ in FL)
| Industry | F500 HQs | Revenue |
|---|---|---|
| Industrial Technology | 2 | $29B |
|
||
| Insurance | 2 | $17B |
|
||
| Retail | 1 | $60B |
|
||
| Technology Distribution | 1 | $58B |
|
||
| Homebuilding | 1 | $35B |
|
||
| Technology Manufacturing | 1 | $35B |
|
||
Price history
+609.7% since first listed3 events — show timeline
- 2026-05-21 Listed $220,000 realMLS
- 1986-07-01 Sold (Public Records) $43,500 Public Records
- 1983-07-01 Sold (Public Records) $31,000 Public Records
Property tax history
+5.8%/yrLatest (2025): $749 · -2.3% YoY. Source: county tax records.
Cash-flow waterfall
monthlySold comps — $/sqft
last 12 mo · ≤1 miLoading sold comps…