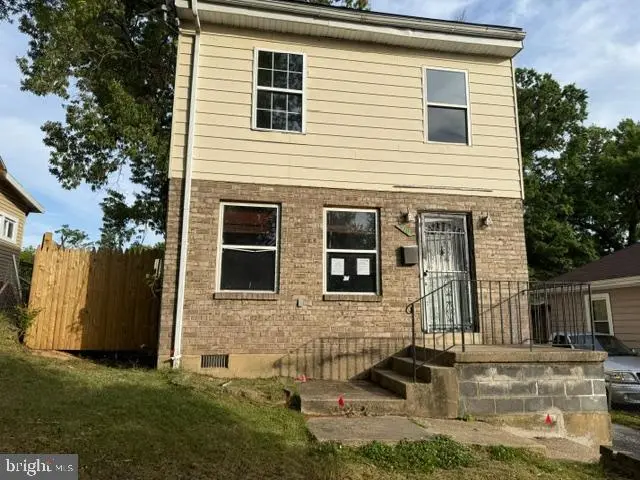
5707 Davey St · Maryland Park, MD
Flood risk 1/10 · Minimal
- FEMA flood zone
- X (unshaded)
- Chance of flooding over 30 yrs
- 0.0%
- Est. flood insurance / yr
- $507 – $1,088
Fire risk 1/10 · Minimal
- Est. fire insurance / yr
- $755 – $1,403
Heat risk 8/10 · Major
- Hot days now (above 103°F)
- 7 days/yr
- Hot days in 30 yrs
- 16 days/yr
Wind risk 5/10 · Moderate
- Chance of severe wind over 30 yrs
- 22.0%
Air-quality risk 4/10 · Minor
- Unhealthy air days now
- 4 days/yr
- Unhealthy air days in 30 yrs
- 5 days/yr
Risk factors via First Street. Map © Google.
Why this score? — see what drove the C+ grade
The composite is a weighted blend of 9 inputs, each scored 0–100. Each bar is that input's sub-score; the figure is the points it added to the 100-point composite (weight × sub-score).
- Cash flow +24.3/30.0
- ARV discount +15.0/15.0
- DSCR +7.9/10.0
- 1% rule +7.1/10.0
- Rent growth +4.0/5.0
- Livability +2.5/5.0
- Condition / age +2.5/5.0
- Schools +1.7/10.0
- Appreciation +0.0/10.0
$225,000
🖨 Deal sheet (PDF) 📄 Offer letter ✓ Due diligence
Listing remarks
HUD-Owned Property: Case No. 249-524438 * Equal Housing Opportunity * Detached, Two-Level property with Living Room, Half Bath, Kitchen and Dining on Main Level * There are Three (3) Bedrooms and One (1) Full Bath on the Upper Level * HUD Homes are SOLD AS-IS. There are No Representations. .. No Guarantees. .. No Warranties * NO REPAIRS are allowed prior to the transaction closing. .. Violators may be Subject to Penalties * Additional Information regarding the property to include Property Disclosures, Property Condition Report, etc and purchasing HUD-Owned homes is available on the HUDhomestore website * Bids are placed online on the HUDhomestore website by HUD-registered B
Key facts
- 4,240 sq ft lot
- Built 1974
- Listed 12 days
Property features AI
Finance
- Financial info: Ownership is fee simple
Exterior
- Parking: Driveway
- Utilities: Public water; Public sewer; Electric cooling
- Home design: Detached property; Finished above-grade area recorded by assessor
- Construction: Combination construction materials; Slab and other foundation types; Other structures above and below grade
- Exterior features: Annually paid ground rent; No tidal water on property
Interior
- Bedrooms: Three bedrooms on the first upper level
- Bathrooms: One full bathroom; One half bathroom
- Heating & cooling: Forced air heating; Central air conditioning; Heating and hot water fueled by natural gas
- Interior features: No basement; Living area measured by assessor
Neighborhood map
What this means for you Summary
Snapshot
- This is a 3-bed/1.5-bath single-family listed at $225k.
Deal economics
- At list price, monthly cash flow is $455 ($5k/yr) — positive.
- The deal already cash-flows at list — no discount required.
- Meets the 1% rule at list price ($3k rent vs $225k).
Location & tenants
- Location reads: area grade C — affects rentability + tenant quality, not the cash-flow math above.
- Prince George'S County Public Schools (suburban): math 8% / reading 24% proficiency, ranked #21 of 24 in MD (top 88%) — low school quality limits family demand, transient renter base, plan for 1-2y turnover.
- Market conditions: Rents rising fast (+5.9%/yr); 215 active listings in the ZIP; 40 comparable units currently listed for rent nearby; rentals at typical pace (median 26d on market — plan ~3-4 weeks tenant-placement turnaround); solid renter incomes; 1,481 units permitted in Prince George's County in 2024 (0 in 5+ unit buildings).
- This rent runs 43% of the median local income ($76k/yr) — at the standard rent-burdened threshold; future hikes will face affordability resistance.
Forward outlook
- Local home prices are declining (-3.0%/yr); year-one equity from $2k of loan paydown is wiped out by about $7k of value loss. Plan a longer hold.
- Prince George's County population projected at +18% by 2050 — long-run rental-demand tailwind backs the buy-and-hold thesis.
- At projected returns (-3.0% appreciation + 5.9% rent growth), your $63k cash investment doubles in ~9 years — after that, you're playing with house money.
Negotiation context
- Only 13 days on market — expect competitive offers; lowballing is unlikely to land.
- 5 sale attempts since 18y ago with the ask held roughly flat each time — persistent listings suggest the price (not the market) is what's stuck; bring a comps-based counter.
Risks & watch-outs
- Climate carrying-cost: moderate wind risk, 22% chance of damaging wind over 30y; extreme-heat days projected 7→16/yr by 2055 (HVAC capex compounding) — expect insurance premiums to compound above CPI over the hold.
Questions for the listing agent
- Built in 1974 — when were the roof, HVAC, electrical panel, plumbing, and water heater last replaced?
- Is there a deadline driving the sale (1031 exchange, divorce, estate, relocation)? That informs how much negotiation room exists.
- What's the average days-on-market for RENTAL listings here right now (not sales)? A rising rental-DOM trend means longer vacancies and softer asking-rent achievability than the comps imply.
- What's the recent tenant-quality profile in this submarket — average credit score on applications, eviction rate, late-payment / NSF rate, and stable-employment percentage? A property-management company in the area should have these aggregated.
- How much new for-sale + rental construction is in the pipeline within 1–3 miles? Heavy new supply typically softens prices + rents 12–24 months out; constrained supply supports both.
Investment metrics
- 1% rule
- 1.21% ✓
- Cap rate
- 8.72%
- Cash-on-cash
- 8.66%
- DSCR
- 1.39
- GRM
- 6.9
CMA / ARV
- ARV (on-the-fly)
- $350,920
- Comps found
- 12
Show comp detail 12 sales within ~0.75 mi
| Address | Dist | Beds/Ba | Sqft | Sold | Price | $/sf | Match |
|---|---|---|---|---|---|---|---|
| 5919 Crown St | 0.18mi | 3/2.5 | 1,240 (0%) | 5mo | $231,000 | $186 | 83 |
| 5707 Coolidge St | 0.08mi | 4/3.0 (+1) | 1,158 (-7%) | 3mo | $385,000 | $332 | 72 |
| 508 71st St | 0.53mi | 3/2.0 | 1,210 (-2%) | 1mo | $210,000 | $174 | 68 |
| 6003 Seat Pleasant Dr | 0.49mi | 3/1.0 | 1,204 (-3%) | 3mo | $330,000 | $274 | 68 |
| 11 Capitol Heights Blvd | 0.44mi | 3/1.0 | 1,280 (+3%) | 6mo | $105,000 | $82 | 67 |
| 410 70th St | 0.43mi | 4/3.0 (+1) | 1,215 (-2%) | 1mo | $345,500 | $284 | 65 |
| 600 64th Ave | 0.48mi | 3/2.0 | 1,125 (-9%) | 5mo | $355,000 | $316 | 56 |
| 509 71st St | 0.56mi | 3/2.0 | 1,343 (+8%) | 5mo | $380,000 | $283 | 54 |
| 504 Capitol Heights Blvd | 0.57mi | 4/2.0 (+1) | 1,339 (+8%) | 1mo | $350,000 | $261 | 52 |
| 114 69th St | 0.46mi | 4/2.0 (+1) | 1,064 (-14%) | 1mo | $400,000 | $376 | 47 |
| 500 Suffolk Ave | 0.47mi | 4/2.5 (+1) | 1,386 (+12%) | 7mo | $225,000 | $162 | 43 |
| 404 Zelma Ave | 0.68mi | 4/1.0 (+1) | 1,125 (-9%) | 7mo | $335,000 | $298 | 40 |
Match score weights: distance 35% · size 25% · config 20% · recency 20%. Top-matched comps best support the ARV.
Projected returns pro-forma
-3.0% appreciation · 5.9% rent growth · sell at horizon
- IRR
- 0.3%
- Equity multiple
- 1.01×
- Total profit
- $776
- Equity at exit
- $33,548
- IRR
- 12.9%
- Equity multiple
- 2.17×
- Total profit
- $73,950
- Equity at exit
- $19,454
Cash invested: $63,000 (down + closing). Projections, not guarantees.
Landlord ↔ Tenant lean methodology
- Overall (STATE)
- 27 Tenant-Leaning
- State Maryland
- 27 Tenant-Leaning · D+14
- County
- — inherits STATE
- City
- — inherits STATE
ZIP-level market 20743
- Rents YoY
- 5.9%
- Active inventory
- 215
- Price-to-rent
- 6.9×
Monthly cashflow live
- Estimated rent
- $2,713 high interval (Pro) →
- Mortgage (P&I)
- −$1,180
- Tax from tax record
- −$415 /mo · $4,976/yr
- Insurance
- −$94
- HOA
- −$0
- Vacancy / Maint / Mgmt
- −$570
- Net cashflow
- $455
Break-even live
Sensitivity live
| Price | -10% $582 | -5% $519 | +0% $455 | +5% $391 | +10% $327 |
|---|---|---|---|---|---|
| Rent | -10% $241 | -5% $348 | +0% $455 | +5% $562 | +10% $669 |
| Rate | -1.0pp $568 | -0.5pp $512 | base $455 | +0.5pp $397 | +1.0pp $337 |
UW: 25.0% down · 7.5% · 30yr · 1.5% tax · 5.0% vac · 8.0% maint · 8.0% mgmt
Financing live
Cash to close
- Down payment
- $56,250
- Closing costs
- $6,750
- Reserves months
- —
- Total cash needed
- —
Loan-product check · same deal, 3 products live
Conventional
25% down · 7.5% · 30yr
- Down + closing
- —
- Monthly P&I
- —
- Monthly cashflow
- —
- DSCR
- —
- Eligible?
- —
Personal DTI + credit; lowest rate.
DSCR
20% down · 8.5% · 30yr
- Down + closing
- —
- Monthly P&I
- —
- Monthly cashflow
- —
- DSCR
- —
- Eligible?
- —
No personal income docs; deal must DSCR.
Hard money
10% down · 12.0% · 12mo
- Down + closing
- —
- Monthly P&I
- —
- Monthly cashflow
- —
- DSCR
- —
- Eligible?
- —
Short-term bridge; refi at stabilization.
Rent comps 40 comps
| Address | Beds | Baths | Sqft | Rent | $/sqft | DOM | Units | Dist |
|---|---|---|---|---|---|---|---|---|
| 6340 Southern Ave NE Washington, DC | 4.0 | 2.0 | 1248 | $4,200 | $3.37 | 25d | 1 | 0.21mi |
| 505 69th St Capitol Heights, MD | 3.0 | 2.0 | 1000 | $2,500 | $2.50 | 19d | 1 | 0.34mi |
| 323 62nd St NE Washington, DC | 1.0–3.0 | 1.0–2.0 | 908 | $2,435 | $2.68 | 25d | 1 | 0.34mi |
| 416 Topeka Ave Unit A Capitol Heights, MD | 3.0 | 2.0 | 1170 | $2,800 | $2.39 | 45d | 1 | 0.42mi |
| 324 61st St NE Unit 4 Washington, DC | 3.0 | 1.5 | 850 | $2,800 | $3.29 | 25d | 1 | 0.42mi |
| 22 Chamber Ave Capitol Heights, MD | 3.0 | 1.0 | 942 | $3,000 | $3.18 | 45d | 1 | 0.46mi |
| 622 Eastern Ave NE #301 Washington, DC | 2.0 | 1.0 | 755 | $1,900 | $2.52 | 25d | 1 | 0.68mi |
| 5539 Central Ave SE Washington, DC | 3.0 | 2.0 | 1140 | $2,300 | $2.02 | 23d | 1 | 0.73mi |
| 5811 Field Pl NE Unit 304 Washington, DC | 3.0 | 1.0 | 779 | $2,922 | $3.75 | 25d | 1 | 0.73mi |
| 5532 B St SE Washington, DC | 2.0 | 2.0 | 1188 | $2,800 | $2.36 | 25d | 1 | 0.75mi |
| 818 Balsamtree Pl Capitol Heights, MD | 4.0 | 1.5 | 1102 | $2,275 | $2.06 | 6d | 1 | 0.79mi |
| 337 54th St NE Unit A Washington, DC | 3.0 | 1.5 | 1184 | $2,850 | $2.41 | 25d | 1 | 0.85mi |
| 5347 Ames St NE Washington, DC | 3.0 | 2.0 | 1428 | $3,000 | $2.10 | 25d | 1 | 0.88mi |
| 805 Eastern Ave Fairmount Heights, MD | 4.0 | 2.0 | 936 | $2,400 | $2.56 | 6d | 1 | 0.90mi |
| 809 Eastern Ave Fairmount Heights, MD | 3.0 | 2.0 | 1246 | $2,400 | $1.93 | 6d | 1 | 0.92mi |
| 5401 Call Pl SE Washington, DC | 2.0–3.0 | 1.0 | 1094 | $2,626 | $2.40 | 3d | 2 | 0.96mi |
| 5344 C St SE Unit 302 Washington, DC | 3.0 | 2.0 | 1000 | $2,100 | $2.10 | 25d | 1 | 0.96mi |
| 5344 C St SE Unit 102 Washington, DC | 3.0 | 2.0 | 1000 | $2,499 | $2.50 | 25d | 1 | 0.96mi |
| 6211 L St Capitol Heights, MD | 2.0 | 2.0 | 1500 | $2,250 | $1.50 | 0d | 1 | 0.97mi |
| 716 55th St NE Unit 1 Washington, DC | 2.0 | 2.0 | 1100 | $2,200 | $2.00 | 21d | 1 | 0.98mi |
| 5225 Dix St NE Washington, DC | 2.0 | 1.0 | 800 | $1,500 | $1.88 | 23d | 1 | 1.00mi |
| 903 Glen Willow Dr Capitol Heights, MD | 2.0–3.0 | 1.0 | 885 | $2,115 | $2.39 | 0d | 3 | 1.01mi |
| 5401 Riba Ct Capitol Heights, MD | 4.0 | 3.0 | 1150 | $3,300 | $2.87 | 6d | 1 | 1.02mi |
| 1105 61st Ave Fairmount Heights, MD | 4.0 | 3.5 | 1352 | $2,500 | $1.85 | 19d | 1 | 1.03mi |
| 5074 Central Ave SE Washington, DC | 4.0 | 2.0 | 1349 | $5,200 | $3.85 | 23d | 1 | 1.04mi |
| 5124 Astor Pl SE Washington, DC | 2.0 | 1.0 | 700 | $1,100 | $1.57 | 25d | 1 | 1.04mi |
| 6210 Lee Pl Capitol Heights, MD | 2.0 | 1.0 | 1200 | $1,950 | $1.62 | 4d | 1 | 1.05mi |
| 6812 Pepper St Capitol Heights, MD | 4.0 | 2.0 | 1095 | $2,750 | $2.51 | 45d | 1 | 1.11mi |
| 5338 Jay St NE Washington, DC | 3.0 | 1.5 | 1000 | $2,795 | $2.79 | 25d | 1 | 1.11mi |
| 1105 Carrington Ave Capitol Heights, MD | 3.0 | 1.5 | 1152 | $2,395 | $2.08 | 3d | 1 | 1.16mi |
| 1105 Carrington Ave Capitol Heights, MD | 3.0 | 1.5 | 1152 | $2,400 | $2.08 | 45d | 1 | 1.16mi |
| 912 Elfin Ave Capitol Heights, MD | 3.0 | 2.0 | 1028 | $2,000 | $1.95 | 45d | 1 | 1.21mi |
| 4932 A St SE #302 Washington, DC | 2.0 | 2.0 | 1007 | $2,495 | $2.48 | 5d | 1 | 1.22mi |
| 5119 E St SE Washington, DC | 3.0 | 1.0 | 941 | $4,000 | $4.25 | 20d | 1 | 1.22mi |
| 1209 Brooke Rd Capitol Heights, MD | 3.0 | 2.0 | 1000 | $3,200 | $3.20 | 19d | 1 | 1.24mi |
| 4930 A St SE Unit 203 Washington, DC | 3.0 | 1.0 | 750 | $2,815 | $3.75 | 25d | 1 | 1.25mi |
| 5213 Just St NE Washington, DC | 3.0 | 2.0 | 1114 | $2,400 | $2.15 | 25d | 1 | 1.25mi |
| 599 50th St NE Washington, DC | 1.0–2.0 | 1.0–2.0 | 775 | $2,081 | $2.69 | 25d | 1 | 1.26mi |
| 927 52nd St NE Unit 4 Washington, DC | 2.0 | 1.0 | 700 | $1,500 | $2.14 | 25d | 1 | 1.29mi |
| 5005 D St SE #104 Washington, DC | 2.0 | 1.0 | 772 | $1,700 | $2.20 | 6d | 1 | 1.29mi |
Listing history 8 events
-
2026-06-21days on market $225,000 Active 13 DOM
-
2026-06-18days on market $225,000 Active 10 DOM
-
2026-06-17days on market $225,000 Active 9 DOM
-
2026-06-16days on market $225,000 Active 8 DOM
-
2026-06-15days on market $225,000 Active 7 DOM
-
2026-06-13days on market $225,000 Active 5 DOM
-
2026-06-10remarks 699-char remark
-
2026-06-10$225,000 Active 1 DOM
ⓘ Source: listings_history table (triggers on properties + properties_extension) + one-shot
backfill from property_details.listing_events for pre-trigger history.
Tax reassessment forecast MD · Partial reset (capped growth)
- Current annual tax
- $4,976 · $415/mo
- Projected year-2 tax
- $4,976 · $415/mo
- Expected delta
- $0/yr ($0/mo · 0.0%)
ⓘ Screening estimate from a state-policy table — verify with the county assessor before closing.
Climate risk First Street
- Flood 1/10 Low FEMA zone X (unshaded) · 0% chance over 30 yrs
- Wildfire 1/10 Low
- Heat 8/10 Severe 7 d/yr ≥103°F today · 16 d/yr by 30 yrs out
- Wind 5/10 Major 22% chance of damaging wind over 30 yrs
- Air quality 4/10 Moderate 4 unhealthy d/yr today · 5 by 30 yrs out
Nearby sold comps map
Loading sold comps map…
Walkable amenities ~0.75 mi
Loading nearby amenities…
Taxation est. · year 1
- Rental income
- $32,554
- − Mortgage interest
- −$12,603
- − Property taxes
- −$4,976
- − Insurance
- −$1,125
- − Repairs & maintenance
- −$2,604
- − Management
- −$2,604
- − Depreciation
- −$6,545
- Taxable income
- $2,096
- Est. tax owed @ 24.0%
- −$503
- After-tax cash flow
- $4,955/yr
For passive investors: Depreciation is non-cash, so a rental often shows a tax loss while cash-flowing — sheltering income. Rental losses are passive: they offset passive income freely, and up to $25,000/yr can offset ordinary (W-2) income if you actively participate and your MAGI is under $100k (phasing out to $0 by $150k); unused losses carry forward. On sale, claimed depreciation is recaptured at up to 25%, and gains may owe capital-gains tax (a 1031 exchange can defer both). Figures are a year-1 estimate at your 24.0% rate — not tax advice; consult a CPA.
Schools (NCES district)
- District
- Prince George'S County Public Schools
- NCES district ID
- 2400510
- Math proficiency
- 8% ▼ -11.00%
- Reading proficiency
- 24% ▼ -9.00%
- Median HH income
- $73,967
- Composite
- 16.82/100
- National rank
- #9151
- State rank
- #21 of 24 in MD
Livability — Maryland Park
No livability data for this city. (Only ~50 U.S. cities are tracked.)
Census & demographics
- Census place
- Maryland Park, MD
- County
- Prince Georges County · 919,866 people
- Metro
- Washington-Arlington-Alexandria, DC-VA-MD-WV
- Population (ZIP)
- 41,093
- Household income
- $76,466
- Rent vs Own
- Severe rent burden
- 1418.0
Population outlook (Prince George's County) Hauer SSP2
- Today (2025)
- 1,005,426 people
- By 2030
- 1,048,416 · +4.3%
- By 2040
- 1,123,425 · +11.7%
- By 2050
- 1,183,220 · +17.7%
- By 2075
- 1,306,202 · +29.9%
- By 2100
- 1,408,179 · +40.1%
Race, ethnicity, and origin ACS 2023
- Neighborhood character
- Predominantly Black (78%)
- Race & ethnicity
- Black 78% Hispanic / Latino 16% Two or more races 4% White 3% Asian 1%
- Hispanic origin (detail)
- Mexican 2% Puerto Rican 2%
- Foreign-born
- 16% · Canada
- Languages at home
- 81% English-only · Spanish 13% French/Haitian/Cajun 1%
Political lean MEDSL · Prince George's
- 2024 margin
- Solid D (+75.2) · D 86.3% · R 11.2% · Other 2.5%
- 2008→2024 swing
- -3.3pp toward R · 2008: 78.5pp · 2024: 75.2pp
- All cycles
- 2024: D+75.2 2020: D+80.5 2016: D+81.0 2012: D+80.9 2008: D+78.5
Not yet ingested
- Civics
- —
Market trends
- HPI YoY
- ▼ -311.97%
- Current HPI
- 335.5152
- Rent YoY
- ▲ 5.90%
- Metro
- Washington-Arlington-Alexandria, DC-VA-MD-WV
- State GDP YoY
- ▲ 2.97%
- F500 in state
- 12
Industry mix (Fortune 500 HQ in MD)
| Industry | F500 HQs | Revenue |
|---|---|---|
| Aerospace / Defense | 1 | $71B |
|
||
| Utilities | 1 | $25B |
|
||
| Hotels | 1 | $24B |
|
||
| Consumer Goods | 1 | $7B |
|
||
| Real Estate | 1 | $6B |
|
||
| Chemicals | 1 | $2B |
|
||
Price history
+725.7% since first listed15 events — show timeline
- 2026-06-08 Listed $225,000 BRIGHT MLS
- 2024-02-21 Listing Removed — BRIGHT MLS
- 2023-10-30 Listed $250,000 BRIGHT MLS
- 2023-03-24 Pending — BRIGHT MLS
- 2023-03-23 Listing Removed — BRIGHT MLS
- 2023-03-10 Listed $265,000 BRIGHT MLS
- 2023-03-06 Coming Soon — BRIGHT MLS
- 2008-12-19 Sold (MLS) $211,000 MRIS
- 2008-12-15 Sold (Public Records) $211,000 Public Records
- 2008-09-04 Delisted — MRIS
- 2008-07-24 Listed $220,000 MRIS
- 2008-03-10 Delisted — MRIS
- 2008-01-21 Listed — MRIS
- 1983-09-26 Sold (Public Records) $61,000 Public Records
- 1973-08-02 Sold (Public Records) $27,250 Public Records
Property tax history
+10.3%/yrLatest (2025): $4,976 · +8.1% YoY. Source: county tax records.
Cash-flow waterfall
monthlySold comps — $/sqft
last 12 mo · ≤1 miLoading sold comps…