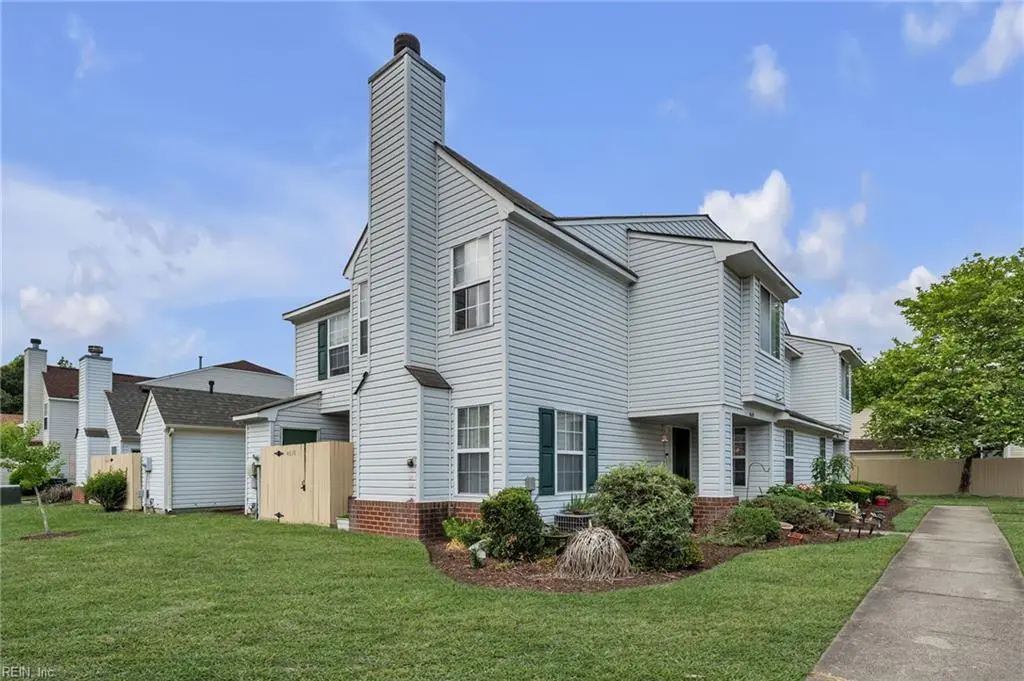
4610 Olde Stone Way · Chesapeake, VA
Flood risk 1/10 · Minimal
- FEMA flood zone
- X (unshaded)
- Chance of flooding over 30 yrs
- 0.0%
- Est. flood insurance / yr
- $507 – $1,088
Fire risk 4/10 · Minor
- Est. fire insurance / yr
- $666 – $1,236
Heat risk 9/10 · Severe
- Hot days now (above 106°F)
- 7 days/yr
- Hot days in 30 yrs
- 16 days/yr
Wind risk 8/10 · Major
- Chance of severe wind over 30 yrs
- 80.0%
Air-quality risk 2/10 · Minimal
- Unhealthy air days now
- 2 days/yr
- Unhealthy air days in 30 yrs
- 2 days/yr
Risk factors via First Street. Map © Google.
Why this score? — see what drove the C- grade
The composite is a weighted blend of 9 inputs, each scored 0–100. Each bar is that input's sub-score; the figure is the points it added to the 100-point composite (weight × sub-score).
- Cash flow +18.0/30.0
- ARV discount +7.5/15.0
- Schools +5.8/10.0
- DSCR +5.6/10.0
- 1% rule +4.8/10.0
- Rent growth +4.4/5.0
- Livability +3.5/5.0
- Condition / age +2.5/5.0
- Appreciation +0.0/10.0
$250,000
🖨 Deal sheet (PDF) 📄 Offer letter ✓ Due diligence
Listing remarks
Welcome home to this well maintained 2 bedroom, 2.5 bath condo located in the highly sought after Western Branch area. Featuring a cozy gas fireplace, this home offers an open and inviting living space filled with natural light. Spacious bedrooms each offer comfort and privacy, and functional layout for everyday living and entertaining. Conveniently located near shopping, dining, and major commuter routes, this condo combines low maintenance living with a desirable location.
Key facts
- Gas fireplace
- Natural light
- Open living space
Tags
Property features AI
Finance
- HOA & community: Has HOA with monthly fee; Condo/POA provides ground maintenance; HOA monthly fee: $97; Association management: UPA
Exterior
- Parking: Assigned/reserved parking
- Utilities: City water; City sewer; Gas water heater; Electric service (standard)
- Home design: Attached condo; Cluster style; 1.5 stories; Two living levels; Condo ownership; Condo unit on level 1
- Construction: Vinyl siding; Asphalt shingle roof; Slab foundation
- Exterior features: Patio; Privacy fence
Interior
- Kitchen: Electric range; Microwave; Dishwasher; Garbage disposal; Refrigerator; Breakfast area; Pantry
- Bedrooms: First-floor bedroom with full bathroom; Two bedrooms have ensuite bathrooms; Master bedroom (first floor listed separately as master on level 1)
- Flooring: Carpet; Ceramic; Vinyl
- Bathrooms: Two full bathrooms; One half bathroom
- Heating & cooling: Natural gas heating; Central air conditioning
- Interior features: Gas fireplace; Ceiling fan; Jetted tub; Scuttle access; Walk-in closet
- Laundry & utility: Washer hookup; Dryer hookup; Utility room; Utility closet
Neighborhood map
What this means for you Summary
Snapshot
- This is a 3-bed/3.0-bath condo listed at $250k.
Deal economics
- At list price, monthly cash flow is $215 ($3k/yr) — positive.
- The deal already cash-flows at list — no discount required.
- To meet the 1% rule (rent ≥ 1% of price), the offer needs to be $244k (2.2% below list).
- Recommended offer: $242k (3.0% below list) — sets the bar for market timing.
- Cap rate 7.3% vs local median 3.7% in Chesapeake — top-decile yield for the area; either an underpriced asset or a hidden risk that comps aren't pricing in. Stress-test before assuming the spread holds.
Location & tenants
- Location reads 70/100 on livability (#236 in VA) — a middle-class / working-renter tenant base. Strengths: employment A+, housing A+; Watch: crime C-, cost of living C-, amenities F.
- Chesapeake City Public School District (suburban): math 58% / reading 74% proficiency, ranked #31 of 131 in VA (top 24%) — acceptable for families but not a draw, mixed tenant base, ~2y average lease.
- Zoned schools: Western Branch Primary (813 students, 41% FRL); Western Branch Middle (math 53% / reading 78%, grade A-, #116 of 342 statewide, top 35%, 887 students, 37% FRL); Western Branch High (math 71% / reading 84%, grade A-, #83 of 319 statewide, top 28%, 2,121 students, 37% FRL).
- Market conditions: Rents rising fast (+7.6%/yr); 234 active listings in the ZIP; 9 comparable units currently listed for rent nearby; rentals at typical pace (median 26d on market — plan ~3-4 weeks tenant-placement turnaround); solid renter incomes; 597 units permitted in Chesapeake city in 2024 (0 in 5+ unit buildings).
Forward outlook
- Local home prices are declining (-3.0%/yr); year-one equity from $2k of loan paydown is wiped out by about $8k of value loss. Plan a longer hold.
- Chesapeake County population projected at +21% by 2050 — long-run rental-demand tailwind backs the buy-and-hold thesis.
- At projected returns (-3.0% appreciation + 7.6% rent growth), your $70k cash investment doubles in ~10 years — after that, you're playing with house money.
Negotiation context
- It's been on market 34 days — a 3% lower offer ($242k) is reasonable based on typical stale-listing flexibility.
Risks & watch-outs
- Climate carrying-cost: severe wind risk, 80% chance of damaging wind over 30y; extreme-heat days projected 7→16/yr by 2055 (HVAC capex compounding) — expect insurance premiums to compound above CPI over the hold.
Questions for the listing agent
- It's been on market 34 days. Have you received any prior offers? Is the seller open to a 3% concession, seller financing, or rate buy-down credit?
- What does the HOA fee cover, when was the last increase, and are there any pending special assessments or reserve-fund shortfalls?
- Any open or pending special assessments — roof, HVAC, plumbing, elevator, façade? What's the per-unit balance and payoff schedule, and is the seller paying it off at close or rolling it to the buyer?
- Is there a deadline driving the sale (1031 exchange, divorce, estate, relocation)? That informs how much negotiation room exists.
- Schools are A-rated — typically a magnet for longer-tenancy family renters. What's the average tenant stay here, and is there a school-zone premium baked into asking?
- What's the average days-on-market for RENTAL listings here right now (not sales)? A rising rental-DOM trend means longer vacancies and softer asking-rent achievability than the comps imply.
- What's the recent tenant-quality profile in this submarket — average credit score on applications, eviction rate, late-payment / NSF rate, and stable-employment percentage? A property-management company in the area should have these aggregated.
- How much new apartment / multifamily construction is in the pipeline within 1–3 miles? Heavy new supply (>2% of stock underway) typically softens rents 12–24 months out; light construction supports rent growth.
Investment metrics
- 1% rule
- 0.98% ✗
- Cap rate
- 7.33%
- Cash-on-cash
- 3.69%
- DSCR
- 1.16
- GRM
- 8.5
CMA / ARV
No comps found within radius.
Projected returns pro-forma
-3.0% appreciation · 7.59% rent growth · sell at horizon
- IRR
- -5.5%
- Equity multiple
- 0.79×
- Total profit
- $-14,973
- Equity at exit
- $37,276
- IRR
- 9.0%
- Equity multiple
- 1.83×
- Total profit
- $58,017
- Equity at exit
- $21,615
Cash invested: $70,000 (down + closing). Projections, not guarantees.
Landlord ↔ Tenant lean methodology
- Overall (STATE)
- 55 Moderately Landlord-Leaning
- State Virginia
- 55 Moderately Landlord-Leaning · D+2
- County
- — inherits STATE
- City
- — inherits STATE
ZIP-level market 23321
- Rents YoY
- 7.6%
- Active inventory
- 234
- Price-to-rent
- 8.5×
Monthly cashflow live
- Estimated rent
- $2,445 high interval (Pro) →
- Mortgage (P&I)
- −$1,311
- Tax from tax record
- −$204 /mo · $2,448/yr
- Insurance
- −$104
- HOA
- −$97
- Vacancy / Maint / Mgmt
- −$513
- Net cashflow
- $215
Break-even live
Sensitivity live
| Price | -10% $357 | -5% $286 | +0% $215 | +5% $144 | +10% $74 |
|---|---|---|---|---|---|
| Rent | -10% $22 | -5% $118 | +0% $215 | +5% $312 | +10% $408 |
| Rate | -1.0pp $341 | -0.5pp $279 | base $215 | +0.5pp $150 | +1.0pp $84 |
UW: 25.0% down · 7.5% · 30yr · 1.5% tax · 5.0% vac · 8.0% maint · 8.0% mgmt
Financing live
Cash to close
- Down payment
- $62,500
- Closing costs
- $7,500
- Reserves months
- —
- Total cash needed
- —
Loan-product check · same deal, 3 products live
Conventional
25% down · 7.5% · 30yr
- Down + closing
- —
- Monthly P&I
- —
- Monthly cashflow
- —
- DSCR
- —
- Eligible?
- —
Personal DTI + credit; lowest rate.
DSCR
20% down · 8.5% · 30yr
- Down + closing
- —
- Monthly P&I
- —
- Monthly cashflow
- —
- DSCR
- —
- Eligible?
- —
No personal income docs; deal must DSCR.
Hard money
10% down · 12.0% · 12mo
- Down + closing
- —
- Monthly P&I
- —
- Monthly cashflow
- —
- DSCR
- —
- Eligible?
- —
Short-term bridge; refi at stabilization.
Rent comps 9 comps
| Address | Beds | Baths | Sqft | Rent | $/sqft | DOM | Units | Dist |
|---|---|---|---|---|---|---|---|---|
| 4629 Hunting Wood Rd Chesapeake, VA | 3.0 | 2.5 | 1702 | $2,695 | $1.58 | 25d | 1 | 0.04mi |
| 5109 James St Chesapeake, VA | 3.0 | 1.5 | 1128 | $2,200 | $1.95 | 45d | 1 | 0.59mi |
| 2409 Leytonstone Dr Chesapeake, VA | 2.0 | 3.0 | 1870 | $2,100 | $1.12 | 25d | 1 | 1.08mi |
| 4329 Farringdon Way Chesapeake, VA | 3.0 | 2.5 | 1870 | $2,450 | $1.31 | 25d | 1 | 1.14mi |
| 4308 Hillingdon Bnd #205 Chesapeake, VA | 2.0 | 2.0 | 1367 | $1,995 | $1.46 | 19d | 1 | 1.18mi |
| 4316 Hillingdon Bnd #207 Chesapeake, VA | 2.0 | 2.0 | 1326 | $1,700 | $1.28 | 18d | 1 | 1.20mi |
| 4314 Midhurst Ln Chesapeake, VA | 4.0 | 2.5 | 1940 | $2,650 | $1.37 | 9d | 1 | 1.28mi |
| 3331 Golden Oaks Ln Chesapeake, VA | 2.0 | 3.0 | 1294 | $2,150 | $1.66 | 6d | 1 | 1.31mi |
| 3809 Peppercorn Way Chesapeake, VA | 3.0 | 2.5 | 1697 | $2,250 | $1.33 | 25d | 1 | 1.38mi |
HOA detail condo
- Monthly dues
- $97 · $1,164/yr
- Likely covers
- gas
- Assessments
- None detected in remarks — confirm with the listing agent.
Listing history 14 events
-
2026-06-21days on market $250,000 Active 34 DOM
-
2026-06-18days on market $250,000 Active 31 DOM
-
2026-06-17days on market $250,000 Active 30 DOM
-
2026-06-16days on market $250,000 Active 29 DOM
-
2026-06-15statusdays on market $250,000 Active 28 DOM
-
2026-06-13days on market $250,000 Active Under Contract 26 DOM
-
2026-06-09days on market $250,000 Active Under Contract 22 DOM
-
2026-06-08days on market $250,000 Active Under Contract 21 DOM
-
2026-06-07days on market $250,000 Active Under Contract 20 DOM
-
2026-06-03days on market $250,000 Active Under Contract 16 DOM
-
2026-06-02days on market $250,000 Active Under Contract 15 DOM
-
2026-06-01days on market $250,000 Active Under Contract 14 DOM
-
2026-05-31days on market $250,000 Active Under Contract 13 DOM
-
2026-05-18$250,000 Active
ⓘ Source: listings_history table (triggers on properties + properties_extension) + one-shot
backfill from property_details.listing_events for pre-trigger history.
Tax reassessment forecast VA · Resets to sale price
- Current annual tax
- $2,448 · $204/mo
- Projected year-2 tax
- $2,448 · $204/mo
- Expected delta
- $0/yr ($0/mo · 0.0%)
ⓘ Screening estimate from a state-policy table — verify with the county assessor before closing.
Climate risk First Street
- Flood 1/10 Low FEMA zone X (unshaded) · 0% chance over 30 yrs
- Wildfire 4/10 Moderate
- Heat 9/10 Extreme 7 d/yr ≥106°F today · 16 d/yr by 30 yrs out
- Wind 8/10 Severe 80% chance of damaging wind over 30 yrs
- Air quality 2/10 Low 2 unhealthy d/yr today · 2 by 30 yrs out
Nearby sold comps map
Loading sold comps map…
Walkable amenities ~0.75 mi
Loading nearby amenities…
Taxation est. · year 1
- Rental income
- $29,335
- − Mortgage interest
- −$14,004
- − Property taxes
- −$2,448
- − Insurance
- −$1,250
- − Repairs & maintenance
- −$2,347
- − Management
- −$2,347
- − HOA
- −$1,164
- − Depreciation
- −$7,273
- Taxable loss
- −$1,497
- Est. tax savings @ 24.0%
- +$359
- After-tax cash flow
- $2,940/yr
For passive investors: Depreciation is non-cash, so a rental often shows a tax loss while cash-flowing — sheltering income. Rental losses are passive: they offset passive income freely, and up to $25,000/yr can offset ordinary (W-2) income if you actively participate and your MAGI is under $100k (phasing out to $0 by $150k); unused losses carry forward. On sale, claimed depreciation is recaptured at up to 25%, and gains may owe capital-gains tax (a 1031 exchange can defer both). Figures are a year-1 estimate at your 24.0% rate — not tax advice; consult a CPA.
Schools (NCES district)
- District
- Chesapeake City Public School District
- NCES district ID
- 5100810
- Math proficiency
- 58% ▼ -29.00%
- Reading proficiency
- 74% ▼ -7.00%
- Median HH income
- $69,356
- Composite
- 57.84/100
- National rank
- #1047
- State rank
- #31 of 131 in VA
Livability — Chesapeake
- Score
- 70/100
- State rank
- #236
- US rank
- #7942
Category grades
Schools grade is shown separately in the Schools card above.
Census & demographics
- Census place
- Chesapeake, VA
- County
- Chesapeake City · 253,091 people
- City population
- 253,091
- Metro
- Virginia Beach-Norfolk-Newport News, VA-NC
- Population (ZIP)
- 40,176
- Household income
- $101,568
- Rent vs Own
- Severe rent burden
- 839.0
Population outlook (Chesapeake County) Hauer SSP2
- Today (2025)
- 263,804 people
- By 2030
- 276,798 · +4.9%
- By 2040
- 299,906 · +13.7%
- By 2050
- 318,284 · +20.7%
- By 2075
- 362,137 · +37.3%
- By 2100
- 372,225 · +41.1%
Race, ethnicity, and origin ACS 2023
- Neighborhood character
- Diverse neighborhood (Simpson 0.63)
- Race & ethnicity
- White 49% Black 37% Two or more races 8% Hispanic / Latino 5% Asian 3%
- Common ancestry
- Romanian 3% Italian 2% Lithuanian 2%
- Foreign-born
- 6% · Canada, Vietnam, South Korea
- Languages at home
- 92% English-only · Spanish 4% Vietnamese 1% Korean 1%
Political lean MEDSL · Chesapeake
- 2024 margin
- Toss-up / Even · D 51.3% · R 47.5% · Other 1.2%
- 2008→2024 swing
- +2.5pp toward D · 2008: 1.3pp · 2024: 3.8pp
- All cycles
- 2024: D+3.8 2020: D+6.5 2016: R+1.3 2012: D+1.1 2008: D+1.3
Not yet ingested
- Civics
- —
Market trends
- HPI YoY
- ▼ -256.23%
- Current HPI
- 295.6473
- Rent YoY
- ▲ 7.59%
- Metro
- Virginia Beach-Norfolk-Newport News, VA-NC
- State GDP YoY
- ▲ 2.40%
- F500 in state
- 50
Industry mix (Fortune 500 HQ in VA)
| Industry | F500 HQs | Revenue |
|---|---|---|
| Aerospace / Defense | 4 | $236B |
|
||
| Technology / Defense | 3 | $32B |
|
||
| Financial Services | 2 | $176B |
|
||
| Utilities | 2 | $27B |
|
||
| Insurance | 2 | $25B |
|
||
| Technology | 2 | $15B |
|
||
Price history
1 event — show timeline
- 2026-05-18 Listed $250,000 REINMLS
Property tax history
+2.6%/yrLatest (2025): $2,448 · +0.3% YoY. Source: county tax records.
Cash-flow waterfall
monthlySold comps — $/sqft
last 12 mo · ≤1 miLoading sold comps…