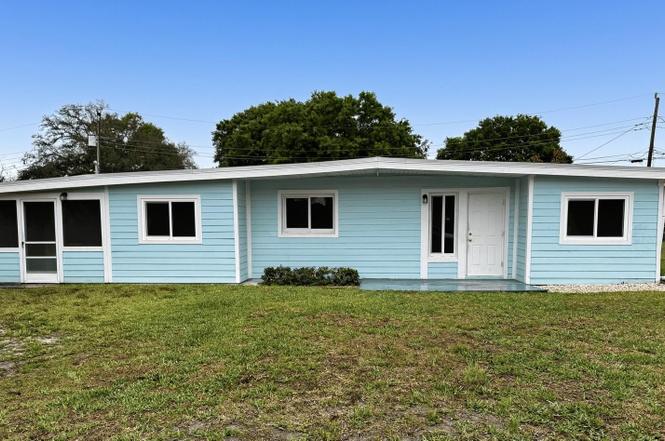
360 Barraclough St · Indian River Estates, FL
Flood risk 4/10 · Minor
- FEMA flood zone
- X (unshaded)
- Chance of flooding over 30 yrs
- 0.2%
- Est. flood insurance / yr
- $507 – $1,088
Fire risk 2/10 · Minimal
- Est. fire insurance / yr
- $947 – $1,759
Heat risk 10/10 · Severe
- Hot days now (above 106°F)
- 7 days/yr
- Hot days in 30 yrs
- 25 days/yr
Wind risk 10/10 · Severe
- Chance of severe wind over 30 yrs
- 99.0%
Air-quality risk 2/10 · Minimal
- Unhealthy air days now
- 1 days/yr
- Unhealthy air days in 30 yrs
- 1 days/yr
Risk factors via First Street. Map © Google.
Why this score? — see what drove the D+ grade
The composite is a weighted blend of 9 inputs, each scored 0–100. Each bar is that input's sub-score; the figure is the points it added to the 100-point composite (weight × sub-score).
- Cash flow +12.9/30.0
- ARV discount +11.6/15.0
- Rent growth +4.4/5.0
- DSCR +3.9/10.0
- Schools +3.7/10.0
- Livability +3.2/5.0
- 1% rule +3.1/10.0
- Condition / age +2.5/5.0
- Appreciation +0.0/10.0
$298,000
🖨 Deal sheet 📄 Offer letter ✓ Due diligence
Listing remarks MLS
Single-Family, Ranch Style Home in Fort Pierce's Palm Gardens location. This home has approximately 1476 square feet with 3 Bedrooms and 1 Baths. Extensive Renovation Needed. Combined Kitchen & Dining Area and Roomy Living Room. The many windows fills the home with lots of natural light. Large attached workshop/storage area. There is a 10x17 Enclosed Patio plus Screened Patio. Floors throughout consist of Linoleum, Carpeting, Vinyl and Concrete. Well and Septic. Agents or their buyers to verify all room measurements and the front exposure. Visit this home today
Key facts
- New plumbing
- New hvac
- New electrical
Tags
Property features AI
Finance
- Other: Pets allowed with no restrictions
Exterior
- Parking: On-street parking
- Security: Smoke detectors
- Utilities: Well water; Public sewer; Sewer and water available
- Home design: Single-family residence; One story; South-facing; Resale property
- Construction: Built with concrete block (CBS)
- Exterior features: Screened patio; Patio; Porch; Fenced yard; Not waterfront
Interior
- Kitchen: Refrigerator
- Bedrooms: Four bedrooms on the main level
- Flooring: Vinyl
- Bathrooms: Two full bathrooms and one half bathroom (three total, all on the main level)
- Heating & cooling: Central electric heating; Central electric air conditioning
- Interior features: Split bedroom layout; Sliding windows; Unfurnished
- Laundry & utility: Indoor laundry with washer hookup; Gas water heater
Neighborhood map
What this means for you Summary
Snapshot
- This is a 4-bed/1.5-bath single-family listed at $298k.
Deal economics
- At list price, monthly cash flow is $-22 ($-263/yr) — negative.
- To cash-flow at today's rent, offer at most $294k (1.3% below list).
- To meet the 1% rule (rent ≥ 1% of price), the offer needs to be $242k (18.7% below list).
- Recommended offer: $242k (18.7% below list) — sets the bar for 1% rule.
Location & tenants
- Location reads 65/100 on livability (#653 in FL) — a middle-class / working-renter tenant base. Strengths: cost of living A+, housing A+, crime B+; Watch: employment D+, amenities F, commute F.
- St. Lucie (urban): math 40% / reading 48% proficiency, ranked #51 of 73 in FL (top 70%) — families likely to look elsewhere, expect single-tenant / working-renter base with shorter leases.
- Zoned schools: Savanna Ridge Elementary School (math 40% / reading 45%, grade F, #1,383 of 2,144 statewide, top 65%, 452 students, 75% FRL); Port St. Lucie High School (math 21% / reading 43%, grade F, #415 of 667 statewide, top 63%, 1,748 students, 67% FRL).
- Market conditions: Rents rising fast (+7.4%/yr); 336 active listings in the ZIP; 16 comparable units currently listed for rent nearby; rentals at typical pace (median 23d on market — plan ~3-4 weeks tenant-placement turnaround); 4,868 units permitted in St. Lucie County in 2024 (268 in 5+ unit buildings).
- At $2,423/mo this rent would consume 54% of the median local household income ($54k/yr) (locally 1086% of renters already pay >50% of income on rent) — very limited rent-growth headroom before tenants either downsize or default.
Forward outlook
- Local home prices are declining (-3.0%/yr); year-one equity from $2k of loan paydown is wiped out by about $9k of value loss. Plan a longer hold.
- St. Lucie County population projected at +20% by 2050 — long-run rental-demand tailwind backs the buy-and-hold thesis.
Negotiation context
- It's been on market 106 days — a 9% lower offer ($271k) is reasonable based on typical stale-listing flexibility.
- 4 sale attempts since 11y ago; this cycle's ask has dropped $81k (21%) from the opening price — seller is motivated, your offer sets the floor, not the list.
- Current owner paid $39k; list at $298k implies a 664% gain — meaningful room to come down on a strong offer.
Risks & watch-outs
- Watch-outs: built in 1955 — expect roof / HVAC / electrical / plumbing capex.
- Climate carrying-cost: severe wind risk, 99% chance of damaging wind over 30y; extreme-heat days projected 7→25/yr by 2055 (HVAC capex compounding) — expect insurance premiums to compound above CPI over the hold.
Questions for the listing agent
- What do current leases actually rent for vs. the listed asking? Can we see a recent rent roll and the last 12 months of T-12 income?
- It's been on market 106 days. Have you received any prior offers? Is the seller open to a 19% concession, seller financing, or rate buy-down credit?
- Built in 1955 — when were the roof, HVAC, electrical panel, plumbing, and water heater last replaced?
- Why hasn't it sold? Are there any deal-killer items the seller is aware of (foundation, flood, title, zoning, code violations)?
- Is there a deadline driving the sale (1031 exchange, divorce, estate, relocation)? That informs how much negotiation room exists.
- Schools are F-rated, which usually means shorter tenancies and higher turnover. Who's the typical renter profile here, and what's been the actual vacancy rate?
- The area grade is low — what's the realistic commute time and amenity access for the typical tenant pool here? Any planned neighborhood developments (good or bad) we should know about?
- What's the average days-on-market for RENTAL listings here right now (not sales)? A rising rental-DOM trend means longer vacancies and softer asking-rent achievability than the comps imply.
- What's the recent tenant-quality profile in this submarket — average credit score on applications, eviction rate, late-payment / NSF rate, and stable-employment percentage? A property-management company in the area should have these aggregated.
- How much new for-sale + rental construction is in the pipeline within 1–3 miles? Heavy new supply typically softens prices + rents 12–24 months out; constrained supply supports both.
Investment metrics
- 1% rule
- 0.81% ✗
- Cap rate
- 6.20%
- Cash-on-cash
- -0.32%
- DSCR
- 0.99
- GRM
- 10.2
CMA / ARV
- ARV (on-the-fly)
- $327,672
- Comps found
- 5
Show comp detail 5 sales within ~0.75 mi
| Address | Dist | Beds/Ba | Sqft | Sold | Price | $/sf | Match |
|---|---|---|---|---|---|---|---|
| 331 Johnston St | 0.19mi | 4/2.0 | 1,470 (-0%) | 8mo | $180,000 | $122 | 81 |
| 104 Germani Dr | 0.08mi | 3/2.0 (-1) | 1,503 (+2%) | 12mo | $322,000 | $214 | 76 |
| 4410 Areca Palm Dr | 0.70mi | 3/2.0 (-1) | 1,533 (+4%) | 6mo | $340,000 | $222 | 49 |
| 5306 Buchanan Dr | 0.49mi | 3/2.0 (-1) | 1,594 (+8%) | 14mo | $357,500 | $224 | 45 |
| 5000 Silver Oak Dr | 0.69mi | 3/2.0 (-1) | 1,680 (+14%) | 15mo | $429,000 | $255 | 25 |
Match score weights: distance 35% · size 25% · config 20% · recency 20%. Top-matched comps best support the ARV.
Projected returns pro-forma
-3.0% appreciation · 7.42% rent growth · sell at horizon
- IRR
- -12.3%
- Equity multiple
- 0.54×
- Total profit
- $-38,470
- Equity at exit
- $44,433
- IRR
- 2.1%
- Equity multiple
- 1.18×
- Total profit
- $15,146
- Equity at exit
- $25,766
Cash invested: $83,440 (down + closing). Projections, not guarantees.
Landlord ↔ Tenant lean methodology
- Overall (STATE)
- 87 Strongly Landlord-Friendly
- State Florida
- 87 Strongly Landlord-Friendly · R+3
- County
- — inherits STATE
- City
- — inherits STATE
ZIP-level market 34982
- Home prices YoY
- -33.4%
- Rents YoY
- 7.4%
- Active inventory
- 336
- Price-to-rent
- 10.2×
Monthly cashflow live
- Estimated rent
- $2,423 high interval (Pro) →
- Mortgage (P&I)
- −$1,563
- Tax from tax record
- −$249 /mo · $2,990/yr
- Insurance
- −$124
- HOA
- −$0
- Vacancy / Maint / Mgmt
- −$509
- Net cashflow
- $-22
Break-even live
UW: 25.0% down · 7.5% · 30yr · 1.5% tax · 5.0% vac · 8.0% maint · 8.0% mgmt
Financing live
Cash to close
- Down payment
- $74,500
- Closing costs
- $8,940
- Reserves months
- —
- Total cash needed
- —
Loan-product check · same deal, 3 products live
Conventional
25% down · 7.5% · 30yr
- Down + closing
- —
- Monthly P&I
- —
- Monthly cashflow
- —
- DSCR
- —
- Eligible?
- —
Personal DTI + credit; lowest rate.
DSCR
20% down · 8.5% · 30yr
- Down + closing
- —
- Monthly P&I
- —
- Monthly cashflow
- —
- DSCR
- —
- Eligible?
- —
No personal income docs; deal must DSCR.
Hard money
10% down · 12.0% · 12mo
- Down + closing
- —
- Monthly P&I
- —
- Monthly cashflow
- —
- DSCR
- —
- Eligible?
- —
Short-term bridge; refi at stabilization.
Rent comps 16 comps
| Address | Beds | Baths | Sqft | Rent | $/sqft | DOM | Units | Dist |
|---|---|---|---|---|---|---|---|---|
| 352 Johnston St Fort Pierce, FL | 3.0 | 2.0 | 936 | $2,100 | $2.24 | 23d | 1 | 0.09mi |
| 355 Johnston St Fort Pierce, FL | 3.0 | 1.5 | 1118 | $2,500 | $2.24 | 23d | 1 | 0.11mi |
| 330 Borraclough St Fort Pierce, FL | 3.0 | 2.0 | 1404 | $2,175 | $1.55 | 13d | 1 | 0.18mi |
| 341 Ashley St Fort Pierce, FL | 3.0 | 2.0 | 1128 | $2,460 | $2.18 | 23d | 1 | 0.19mi |
| 360 Melton Dr Fort Pierce, FL | 4.0 | 2.0 | 1720 | $2,220 | $1.29 | 13d | 1 | 0.29mi |
| 5300 Seagrape Dr Fort Pierce, FL | 3.0 | 2.0 | 1300 | $2,450 | $1.88 | 23d | 1 | 0.85mi |
| 5315 Hickory Dr Fort Pierce, FL | 3.0 | 2.0 | 1400 | $2,045 | $1.46 | 23d | 1 | 1.07mi |
| 4166 Gator Trace Villas Cir Unit B Fort Pierce, FL | 3.0 | 2.0 | 1336 | $2,200 | $1.65 | 23d | 1 | 1.14mi |
| 394 Salisbury Cir Fort Pierce, FL | 3.0 | 2.5 | 1808 | $2,500 | $1.38 | 13d | 1 | 1.23mi |
| 389 Salisbury Cir Fort Pierce, FL | 3.0 | 2.5 | 1808 | $3,200 | $1.77 | 23d | 1 | 1.25mi |
| 423 Salisbury Cir Fort Pierce, FL | 3.0 | 2.5 | 1808 | $2,500 | $1.38 | 23d | 1 | 1.27mi |
| 4220 Sunrise Blvd Fort Pierce, FL | 3.0 | 2.0 | 1870 | $10,000 | $5.35 | 23d | 1 | 1.29mi |
| 587 Salisbury Cir Fort Pierce, FL | 3.0 | 2.5 | 1808 | $2,350 | $1.30 | 13d | 1 | 1.30mi |
| 4003 Oleander Ave Fort Pierce, FL | 3.0–4.0 | 2.0 | 1765 | $3,020 | $1.71 | 13d | 1 | 1.31mi |
| 492 Salisbury Cir Fort Pierce, FL | 3.0 | 2.5 | 1486 | $2,395 | $1.61 | 23d | 1 | 1.31mi |
| 526 Salisbury Cir Fort Pierce, FL | 3.0 | 2.5 | 1486 | $2,399 | $1.61 | 13d | 1 | 1.34mi |
Listing history 25 events
-
2026-06-18days on market $298,000 Active 106 DOM
-
2026-06-17days on market $298,000 Active 105 DOM
-
2026-06-16days on market $298,000 Active 104 DOM
-
2026-06-15days on market $298,000 Active 103 DOM
-
2026-06-14days on market $298,000 Active 101 DOM
-
2026-06-13pricedays on market $298,000 Active 100 DOM
-
2026-06-10days on market $329,000 Active 98 DOM
-
2026-06-09days on market $329,000 Active 97 DOM
-
2026-06-08days on market $329,000 Active 96 DOM
-
2026-06-07days on market $329,000 Active 95 DOM
-
2026-06-05days on market $329,000 Active 92 DOM
-
2026-06-03days on market $329,000 Active 91 DOM
-
2026-06-02days on market $329,000 Active 90 DOM
-
2026-06-01days on market $329,000 Active 89 DOM
-
2026-05-31days on market $329,000 Active 88 DOM
-
2026-05-30days on market $329,000 Active 87 DOM
-
2026-03-28price $329,000
-
2026-03-04$379,000 Active
-
2024-02-27historical $2,400
-
2023-11-21$2,400
-
2023-11-21historical
-
2023-11-17$2,400 Active
-
2015-06-19soldstatus $39,000 Closed 573-char remark
Show marketing remark (573 chars)
Single-Family, Ranch Style Home in Fort Pierce's Palm Gardens location. This home has approximately 1476 square feet with 3 Bedrooms and 1 Baths. Extensive Renovation Needed. Combined Kitchen & Dining Area and Roomy Living Room. The many windows fills the home with lots of natural light. Large attached workshop/storage area. There is a 10x17 Enclosed Patio plus Screened Patio. Floors throughout consist of Linoleum, Carpeting, Vinyl and Concrete. Well and Septic. Agents or their buyers to verify all room measurements and the front exposure. Visit this home today
-
2015-05-15historical Contingent 573-char remark
Show marketing remark (573 chars)
Single-Family, Ranch Style Home in Fort Pierce's Palm Gardens location. This home has approximately 1476 square feet with 3 Bedrooms and 1 Baths. Extensive Renovation Needed. Combined Kitchen & Dining Area and Roomy Living Room. The many windows fills the home with lots of natural light. Large attached workshop/storage area. There is a 10x17 Enclosed Patio plus Screened Patio. Floors throughout consist of Linoleum, Carpeting, Vinyl and Concrete. Well and Septic. Agents or their buyers to verify all room measurements and the front exposure. Visit this home today
-
2015-04-15$39,000 Active 573-char remark
Show marketing remark (573 chars)
Single-Family, Ranch Style Home in Fort Pierce's Palm Gardens location. This home has approximately 1476 square feet with 3 Bedrooms and 1 Baths. Extensive Renovation Needed. Combined Kitchen & Dining Area and Roomy Living Room. The many windows fills the home with lots of natural light. Large attached workshop/storage area. There is a 10x17 Enclosed Patio plus Screened Patio. Floors throughout consist of Linoleum, Carpeting, Vinyl and Concrete. Well and Septic. Agents or their buyers to verify all room measurements and the front exposure. Visit this home today
ⓘ Source: listings_history table (triggers on properties + properties_extension) + one-shot
backfill from property_details.listing_events for pre-trigger history.
Tax reassessment forecast FL · Resets to sale price
- Current annual tax
- $2,990 · $249/mo
- Projected year-2 tax
- $2,990 · $249/mo
- Expected delta
- $0/yr ($0/mo · 0.0%)
ⓘ Screening estimate from a state-policy table — verify with the county assessor before closing.
Climate risk First Street
- Flood 4/10 Moderate FEMA zone X (unshaded) · 20% chance over 30 yrs
- Wildfire 2/10 Low
- Heat 10/10 Extreme 7 d/yr ≥106°F today · 25 d/yr by 30 yrs out
- Wind 10/10 Extreme 99% chance of damaging wind over 30 yrs
- Air quality 2/10 Low 1 unhealthy d/yr today · 1 by 30 yrs out
Nearby sold comps map
Loading sold comps map…
Walkable amenities ~0.75 mi
Loading nearby amenities…
Taxation est. · year 1
- Rental income
- $29,076
- − Mortgage interest
- −$16,693
- − Property taxes
- −$2,990
- − Insurance
- −$1,490
- − Repairs & maintenance
- −$2,326
- − Management
- −$2,326
- − Depreciation
- −$8,669
- Taxable loss
- −$5,418
- Est. tax savings @ 24.0%
- +$1,300
- After-tax cash flow
- $1,037/yr
For passive investors: Depreciation is non-cash, so a rental often shows a tax loss while cash-flowing — sheltering income. Rental losses are passive: they offset passive income freely, and up to $25,000/yr can offset ordinary (W-2) income if you actively participate and your MAGI is under $100k (phasing out to $0 by $150k); unused losses carry forward. On sale, claimed depreciation is recaptured at up to 25%, and gains may owe capital-gains tax (a 1031 exchange can defer both). Figures are a year-1 estimate at your 24.0% rate — not tax advice; consult a CPA.
Schools (NCES district)
- District
- St. Lucie
- NCES district ID
- 1201770
- Math proficiency
- 40% ▼ -11.00%
- Reading proficiency
- 48% ▼ -4.00%
- Median HH income
- $44,737
- Composite
- 37.28/100
- National rank
- #4449
- State rank
- #51 of 73 in FL
Livability — Indian River Estates
- Score
- 65/100
- State rank
- #653
- US rank
- #12946
Category grades
Schools grade is shown separately in the Schools card above.
Census & demographics
- Census place
- Indian River Estates, FL
- County
- Saint Lucie County · 337,150 people
- City population
- 27,447
- Metro
- Port St. Lucie, FL
- Population (ZIP)
- 31,143
- Household income
- $54,082
- Rent vs Own
- Severe rent burden
- 1086.0
Population outlook (St. Lucie County) Hauer SSP2
- Today (2025)
- 338,016 people
- By 2030
- 355,687 · +5.2%
- By 2040
- 385,521 · +14.1%
- By 2050
- 406,106 · +20.1%
- By 2075
- 441,054 · +30.5%
- By 2100
- 436,885 · +29.2%
Race, ethnicity, and origin ACS 2023
- Neighborhood character
- Majority White (62%)
- Race & ethnicity
- White 62% Hispanic / Latino 22% Two or more races 12% Black 12%
- Hispanic origin (detail)
- Mexican 10% Puerto Rican 3% Cuban 3%
- Common ancestry
- Italian 7% Hispanic 2% Lithuanian 1%
- Foreign-born
- 12% · Canada
- Languages at home
- 80% English-only · Spanish 16% French/Haitian/Cajun 3%
Political lean MEDSL · St. Lucie
- 2024 margin
- Lean R (+9.1) · D 45.1% · R 54.2%
- 2008→2024 swing
- -21.2pp toward R · 2008: 12.1pp · 2024: -9.1pp
- All cycles
- 2024: R+9.1 2020: R+1.6 2016: R+2.5 2012: D+7.9 2008: D+12.1
Not yet ingested
- Civics
- —
Market trends
- HPI YoY
- ▼ -199.47%
- Current HPI
- 397.2649
- Rent YoY
- ▲ 7.42%
- Metro
- Port St. Lucie, FL
- State GDP YoY
- ▲ 3.28%
- F500 in state
- 36
Industry mix (Fortune 500 HQ in FL)
| Industry | F500 HQs | Revenue |
|---|---|---|
| Industrial Technology | 2 | $29B |
|
||
| Insurance | 2 | $17B |
|
||
| Retail | 1 | $60B |
|
||
| Technology Distribution | 1 | $58B |
|
||
| Homebuilding | 1 | $35B |
|
||
| Technology Manufacturing | 1 | $35B |
|
||
Price history
+743.6% since first listed9 events — show timeline
- 2026-03-28 Price Changed $329,000 Beaches MLS
- 2026-03-04 Listed $379,000 Beaches MLS
- 2024-02-27 Rental Removed $2,400 GFLMLS
- 2023-11-21 Listed for Rent $2,400 GFLMLS
- 2023-11-21 Listing Removed — Beaches MLS
- 2023-11-17 Listed $2,400 Beaches MLS
- 2015-06-19 Sold (MLS) $39,000 Beaches MLS
- 2015-05-15 Contingent — Beaches MLS
- 2015-04-15 Listed $39,000 Beaches MLS
Property tax history
+18.9%/yrLatest (2025): $2,990 · +10.4% YoY. Source: county tax records.
Cash-flow waterfall
monthlySold comps — $/sqft
last 12 mo · ≤1 miLoading sold comps…