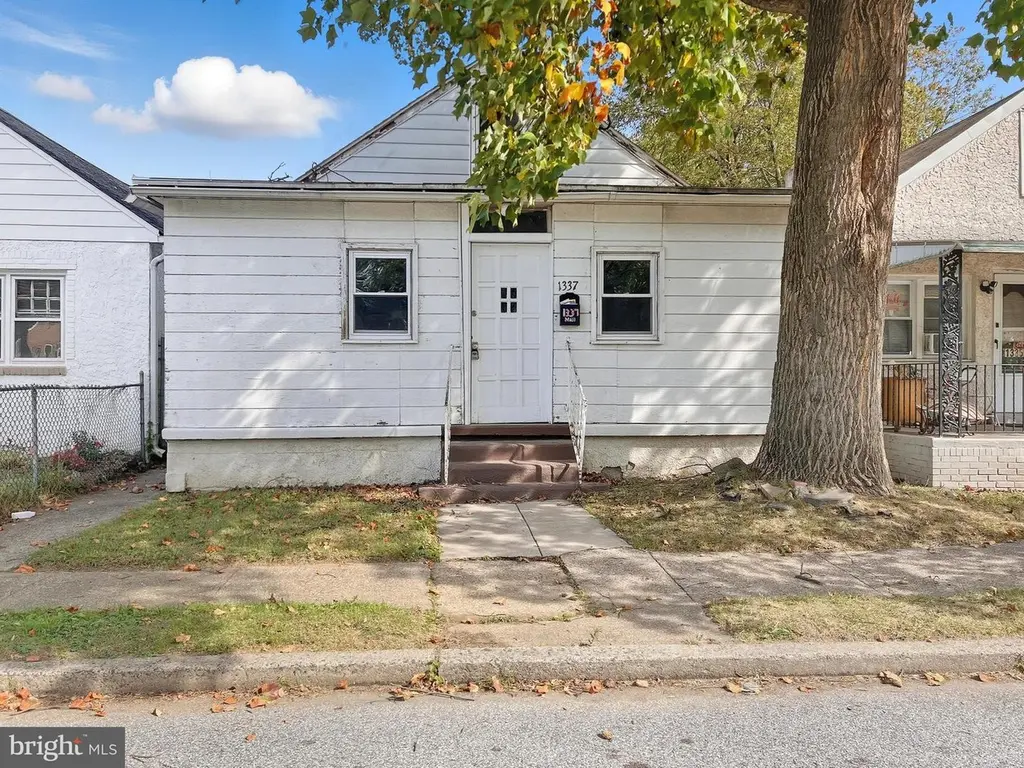
1337 Townsend St · Chester, PA
Flood risk 1/10 · Minimal
- FEMA flood zone
- X (unshaded)
- Chance of flooding over 30 yrs
- 0.0%
- Est. flood insurance / yr
- $507 – $1,088
Fire risk 1/10 · Minimal
- Est. fire insurance / yr
- $511 – $949
Heat risk 7/10 · Major
- Hot days now (above 104°F)
- 7 days/yr
- Hot days in 30 yrs
- 15 days/yr
Wind risk 6/10 · Moderate
- Chance of severe wind over 30 yrs
- 27.0%
Air-quality risk 4/10 · Minor
- Unhealthy air days now
- 4 days/yr
- Unhealthy air days in 30 yrs
- 7 days/yr
Risk factors via First Street. Map © Google.
Why this score? — see what drove the C+ grade
The composite is a weighted blend of 9 inputs, each scored 0–100. Each bar is that input's sub-score; the figure is the points it added to the 100-point composite (weight × sub-score).
- Cash flow +25.8/30.0
- ARV discount +10.3/15.0
- DSCR +8.6/10.0
- 1% rule +5.9/10.0
- Rent growth +4.2/5.0
- Livability +3.7/5.0
- Condition / age +2.5/5.0
- Schools +0.8/10.0
- Appreciation +0.0/10.0
$120,000
🖨 Deal sheet (PDF) 📄 Offer letter ✓ Due diligence
Listing remarks MLS
Investment opportunity in Chester. 1337 Townsend Street offers rental potential. This property features 2 bedrooms on the main floor. There is also an extra storage room accessed through the living room. Conveniently located near Widener University and public transit.
Key facts
- Public transit
- Extra storage room
- 2,614 sq ft lot
Tags
Neighborhood map
What this means for you Summary
Snapshot
- This is a 2-bed/1.0-bath single-family listed at $120k.
Deal economics
- At list price, monthly cash flow is $292 ($4k/yr) — positive.
- The deal already cash-flows at list — no discount required.
- Meets the 1% rule at list price ($1k rent vs $120k).
- Recommended offer: $106k (12.0% below list) — sets the bar for market timing.
- Cap rate 9.2% vs local median 7.5% in Chester — meaningfully above typical; check what's discounted (condition, days-on-market, listing class) to confirm the premium yield is real.
Location & tenants
- Location reads 73/100 on livability (#540 in PA) — a middle-class / working-renter tenant base. Strengths: amenities A+, commute A+, cost of living A+; Watch: schools F, crime F, employment F.
- Chester-Upland SD (suburban): math 4% / reading 17% proficiency, ranked #533 of 539 in PA (top 99%) — low school quality limits family demand, transient renter base, plan for 1-2y turnover; 81% free/reduced lunch — lower-income household profile, screen leases tightly.
- Market conditions: Rents rising fast (+6.9%/yr); 138 active listings in the ZIP; 12 comparable units currently listed for rent nearby; rentals at typical pace (median 25d on market — plan ~3-4 weeks tenant-placement turnaround); lower-income renter base — watch delinquency; 299 units permitted in Delaware County in 2024 (5 in 5+ unit buildings).
- This rent runs 38% of the median local income ($41k/yr) — at the standard rent-burdened threshold; future hikes will face affordability resistance.
Forward outlook
- Local home prices are declining (-3.0%/yr); year-one equity from $830 of loan paydown is wiped out by about $4k of value loss. Plan a longer hold.
- At projected returns (-3.0% appreciation + 6.9% rent growth), your $34k cash investment doubles in ~8 years — after that, you're playing with house money.
Negotiation context
- It's been on market 214 days — a 12% lower offer ($106k) is reasonable based on typical stale-listing flexibility.
- 8 sale attempts since 31y ago with the ask held roughly flat each time — persistent listings suggest the price (not the market) is what's stuck; bring a comps-based counter.
Risks & watch-outs
- Climate carrying-cost: major wind risk, 27% chance of damaging wind over 30y; extreme-heat days projected 7→15/yr by 2055 (HVAC capex compounding) — expect insurance premiums to compound above CPI over the hold.
Questions for the listing agent
- It's been on market 214 days. Have you received any prior offers? Is the seller open to a 12% concession, seller financing, or rate buy-down credit?
- Built in 1965 — when were the roof, HVAC, electrical panel, plumbing, and water heater last replaced?
- Why hasn't it sold? Are there any deal-killer items the seller is aware of (foundation, flood, title, zoning, code violations)?
- Is there a deadline driving the sale (1031 exchange, divorce, estate, relocation)? That informs how much negotiation room exists.
- Schools are F-rated, which usually means shorter tenancies and higher turnover. Who's the typical renter profile here, and what's been the actual vacancy rate?
- Crime grade is F in this area — have there been break-ins, vandalism, or insurance claims at this property in the last 3 years? What carrier currently insures it and at what premium?
- What's the average days-on-market for RENTAL listings here right now (not sales)? A rising rental-DOM trend means longer vacancies and softer asking-rent achievability than the comps imply.
- What's the recent tenant-quality profile in this submarket — average credit score on applications, eviction rate, late-payment / NSF rate, and stable-employment percentage? A property-management company in the area should have these aggregated.
- How much new for-sale + rental construction is in the pipeline within 1–3 miles? Heavy new supply typically softens prices + rents 12–24 months out; constrained supply supports both.
Investment metrics
- 1% rule
- 1.09% ✓
- Cap rate
- 9.22%
- Cash-on-cash
- 10.44%
- DSCR
- 1.46
- GRM
- 7.7
CMA / ARV
- ARV (median comp)
- $128,012
- List price
- $120,000
- Delta
- -6.26%
- Verdict
- FAIR
- Comps
- 20 within 1.0 mi
Show comp detail 3 sales within ~0.75 mi
| Address | Dist | Beds/Ba | Sqft | Sold | Price | $/sf | Match |
|---|---|---|---|---|---|---|---|
| 2434 Green St | 0.32mi | 2/1.0 | 872 (-4%) | 3mo | $125,000 | $143 | 75 |
| 1502 W 12th St | 0.53mi | 2/1.0 | 960 (+5%) | 11mo | $70,000 | $73 | 57 |
| 3003 Carter Ave | 0.67mi | 2/1.0 | 832 (-9%) | 22mo | $175,600 | $211 | 36 |
Match score weights: distance 35% · size 25% · config 20% · recency 20%. Top-matched comps best support the ARV.
Projected returns pro-forma
-3.0% appreciation · 6.88% rent growth · sell at horizon
- IRR
- 3.3%
- Equity multiple
- 1.13×
- Total profit
- $4,428
- Equity at exit
- $17,892
- IRR
- 16.0%
- Equity multiple
- 2.52×
- Total profit
- $51,201
- Equity at exit
- $10,375
Cash invested: $33,600 (down + closing). Projections, not guarantees.
Landlord ↔ Tenant lean methodology
- Overall (STATE)
- 62 Landlord-Friendly
- State Pennsylvania
- 62 Landlord-Friendly · EVEN
- County
- — inherits STATE
- City
- — inherits STATE
ZIP-level market 19013
- Rents YoY
- 6.9%
- Active inventory
- 138
- Price-to-rent
- 7.7×
Monthly cashflow live
- Estimated rent
- $1,304 high interval (Pro) →
- Mortgage (P&I)
- −$629
- Tax from tax record
- −$59 /mo · $706/yr
- Insurance
- −$50
- HOA
- −$0
- Vacancy / Maint / Mgmt
- −$274
- Net cashflow
- $292
Break-even live
Sensitivity live
| Price | -10% $360 | -5% $326 | +0% $292 | +5% $258 | +10% $224 |
|---|---|---|---|---|---|
| Rent | -10% $189 | -5% $241 | +0% $292 | +5% $344 | +10% $395 |
| Rate | -1.0pp $353 | -0.5pp $323 | base $292 | +0.5pp $261 | +1.0pp $230 |
UW: 25.0% down · 7.5% · 30yr · 1.5% tax · 5.0% vac · 8.0% maint · 8.0% mgmt
Financing live
Cash to close
- Down payment
- $30,000
- Closing costs
- $3,600
- Reserves months
- —
- Total cash needed
- —
Loan-product check · same deal, 3 products live
Conventional
25% down · 7.5% · 30yr
- Down + closing
- —
- Monthly P&I
- —
- Monthly cashflow
- —
- DSCR
- —
- Eligible?
- —
Personal DTI + credit; lowest rate.
DSCR
20% down · 8.5% · 30yr
- Down + closing
- —
- Monthly P&I
- —
- Monthly cashflow
- —
- DSCR
- —
- Eligible?
- —
No personal income docs; deal must DSCR.
Hard money
10% down · 12.0% · 12mo
- Down + closing
- —
- Monthly P&I
- —
- Monthly cashflow
- —
- DSCR
- —
- Eligible?
- —
Short-term bridge; refi at stabilization.
Rent comps 12 comps
| Address | Beds | Baths | Sqft | Rent | $/sqft | DOM | Units | Dist |
|---|---|---|---|---|---|---|---|---|
| 1127 Ward St Chester, PA | 2.0 | 1.0 | 800 | $1,250 | $1.56 | 8d | 1 | 0.16mi |
| 3312 W 13th St Chester, PA | 2.0 | 1.0 | 936 | $1,499 | $1.60 | 22d | 1 | 0.64mi |
| 425 Highland Ave Apt A Chester, PA | 2.0 | 1.5 | 990 | $1,000 | $1.01 | 21d | 1 | 0.67mi |
| 1107-1115 Keystone Rd Chester, PA | 2.0 | 1.0 | 700 | $1,250 | $1.79 | 44d | 1 | 0.72mi |
| 908 Keystone Rd Chester, PA | 2.0 | 1.0 | 750 | $1,200 | $1.60 | 44d | 1 | 0.74mi |
| 906 Keystone Rd Unit 1 Chester, PA | 2.0 | 1.0 | 800 | $1,200 | $1.50 | 24d | 1 | 0.74mi |
| 906 Keystone Rd Chester, PA | 2.0 | 1.0 | 800 | $1,200 | $1.50 | 22d | 1 | 0.74mi |
| 1006 Keystone Rd Chester, PA | 2.0 | 1.0 | 750 | $1,200 | $1.60 | 24d | 1 | 0.75mi |
| 901 W 8th St Chester, PA | 1.0 | 1.5 | 836 | $1,500 | $1.79 | 44d | 1 | 1.07mi |
| 280 Bridgewater Rd Brookhaven, PA | 1.0–2.0 | 1.0–1.5 | 775 | $1,800 | $2.32 | 24d | 2 | 1.34mi |
| 280 Bridgewater Rd Brookhaven, PA | 1.0–2.0 | 1.0–2.0 | 775 | $1,695 | $2.19 | 5d | 4 | 1.34mi |
| 523 Concord Ave Unit 2R Chester, PA | 1.0 | 1.0 | 700 | $1,050 | $1.50 | 44d | 1 | 1.46mi |
Listing history 33 events
-
2026-06-18days on market $120,000 Active 214 DOM
-
2026-06-17days on market $120,000 Active 213 DOM
-
2026-06-16days on market $120,000 Active 212 DOM
-
2026-06-15days on market $120,000 Active 211 DOM
-
2026-06-13days on market $120,000 Active 209 DOM
-
2026-06-13days on market $120,000 Active 208 DOM
-
2026-06-09days on market $120,000 Active 205 DOM
-
2026-06-08days on market $120,000 Active 204 DOM
-
2026-06-07days on market $120,000 Active 203 DOM
-
2026-06-04days on market $120,000 Active 200 DOM
-
2026-06-03days on market $120,000 Active 199 DOM
-
2026-06-02days on market $120,000 Active 198 DOM
-
2026-06-01days on market $120,000 Active 197 DOM
-
2026-05-31days on market $120,000 Active 196 DOM
-
2026-05-06status Active 268-char remark
Show marketing remark (268 chars)
Investment opportunity in Chester. 1337 Townsend Street offers rental potential. This property features 2 bedrooms on the main floor. There is also an extra storage room accessed through the living room. Conveniently located near Widener University and public transit.
-
2026-04-26historical Active Under Contract 268-char remark
Show marketing remark (268 chars)
Investment opportunity in Chester. 1337 Townsend Street offers rental potential. This property features 2 bedrooms on the main floor. There is also an extra storage room accessed through the living room. Conveniently located near Widener University and public transit.
-
2025-11-06$120,000 Active 268-char remark
Show marketing remark (268 chars)
Investment opportunity in Chester. 1337 Townsend Street offers rental potential. This property features 2 bedrooms on the main floor. There is also an extra storage room accessed through the living room. Conveniently located near Widener University and public transit.
-
2025-10-17historical
-
2025-02-19price $125,000
-
2024-12-04$127,000 Active
-
2022-08-16soldstatus $563,640
-
2004-04-29soldstatus $27,000
-
2004-04-01historical
-
2004-03-24$27,000
-
2000-05-15historical
-
1999-10-16$25,000
-
1999-01-15historical
-
1998-07-08$28,000
-
1998-06-30historical
-
1997-08-10$33,900
-
1995-10-06$32,000
-
1995-10-06historical
-
1989-09-11soldstatus $8,000
ⓘ Source: listings_history table (triggers on properties + properties_extension) + one-shot
backfill from property_details.listing_events for pre-trigger history.
Tax reassessment forecast PA · Partial reset (capped growth)
- Current annual tax
- $706 · $59/mo
- Projected year-2 tax
- $1,301 · $108/mo
- Expected delta
- +$595/yr (+$50/mo · 84.3%)
ⓘ Screening estimate from a state-policy table — verify with the county assessor before closing.
Climate risk First Street
- Flood 1/10 Low FEMA zone X (unshaded) · 0% chance over 30 yrs
- Wildfire 1/10 Low
- Heat 7/10 Severe 7 d/yr ≥104°F today · 15 d/yr by 30 yrs out
- Wind 6/10 Major 27% chance of damaging wind over 30 yrs
- Air quality 4/10 Moderate 4 unhealthy d/yr today · 7 by 30 yrs out
Nearby sold comps map
Loading sold comps map…
Walkable amenities ~0.75 mi
Loading nearby amenities…
Taxation est. · year 1
- Rental income
- $15,652
- − Mortgage interest
- −$6,722
- − Property taxes
- −$706
- − Insurance
- −$600
- − Repairs & maintenance
- −$1,252
- − Management
- −$1,252
- − Depreciation
- −$3,491
- Taxable income
- $1,629
- Est. tax owed @ 24.0%
- −$391
- After-tax cash flow
- $3,117/yr
For passive investors: Depreciation is non-cash, so a rental often shows a tax loss while cash-flowing — sheltering income. Rental losses are passive: they offset passive income freely, and up to $25,000/yr can offset ordinary (W-2) income if you actively participate and your MAGI is under $100k (phasing out to $0 by $150k); unused losses carry forward. On sale, claimed depreciation is recaptured at up to 25%, and gains may owe capital-gains tax (a 1031 exchange can defer both). Figures are a year-1 estimate at your 24.0% rate — not tax advice; consult a CPA.
Schools (NCES district)
- District
- Chester-Upland SD
- NCES district ID
- 4205860
- Math proficiency
- 4% ▼ -3.00%
- Reading proficiency
- 17% ▼ -6.00%
- Median HH income
- $29,790
- Composite
- 8.05/100
- National rank
- #9918
- State rank
- #533 of 539 in PA
Livability — Chester
- Score
- 73/100
- State rank
- #540
- US rank
- #5053
Category grades
Schools grade is shown separately in the Schools card above.
Census & demographics
- County
- Delaware County · 399,863 people
- City population
- 35,064
- Metro
- Philadelphia-Camden-Wilmington, PA-NJ-DE-MD
- Population (ZIP)
- 35,064
- Household income
- $41,261
- Rent vs Own
- Severe rent burden
- 2668.0
Population outlook (Delaware County) Hauer SSP2
- Today (2025)
- 577,490 people
- By 2030
- 581,243 · +0.6%
- By 2040
- 584,700 · +1.2%
- By 2050
- 586,581 · +1.6%
- By 2075
- 598,706 · +3.7%
- By 2100
- 590,823 · +2.3%
Race, ethnicity, and origin ACS 2023
- Neighborhood character
- Predominantly Black (71%)
- Race & ethnicity
- Black 71% White 14% Hispanic / Latino 9% Two or more races 4%
- Hispanic origin (detail)
- Puerto Rican 6%
- Common ancestry
- Romanian 2%
- Foreign-born
- 4% · Canada
- Languages at home
- 92% English-only · Spanish 6%
Political lean MEDSL · Delaware
- 2024 margin
- Strong D (+23.7) · D 61.4% · R 37.6% · Other 1.0%
- 2008→2024 swing
- +2.3pp toward D · 2008: 21.4pp · 2024: 23.7pp
- All cycles
- 2024: D+23.7 2020: D+26.7 2016: D+22.0 2012: D+21.8 2008: D+21.4
Not yet ingested
- Civics
- —
Market trends
- HPI YoY
- ▼ -149.69%
- Current HPI
- 219.5173
- Rent YoY
- ▲ 6.88%
- Metro
- Philadelphia-Camden-Wilmington, PA-NJ-DE-MD
- State GDP YoY
- ▲ 1.68%
- F500 in state
- 34
Industry mix (Fortune 500 HQ in PA)
| Industry | F500 HQs | Revenue |
|---|---|---|
| Healthcare | 2 | $309B |
|
||
| Insurance | 2 | $27B |
|
||
| Telecommunications / Media | 1 | $124B |
|
||
| Industrial Distribution | 1 | $22B |
|
||
| Financial Services | 1 | $20B |
|
||
| Chemicals / Materials | 1 | $18B |
|
||
Price history
+1400.0% since first listed19 events — show timeline
- 2026-05-06 Relisted — BRIGHT MLS
- 2026-04-26 Contingent — BRIGHT MLS
- 2025-11-06 Listed $120,000 BRIGHT MLS
- 2025-10-17 Listing Removed — BRIGHT MLS
- 2025-02-19 Price Changed $125,000 BRIGHT MLS
- 2024-12-04 Listed $127,000 BRIGHT MLS
- 2022-08-16 Sold (Public Records) $563,640 Public Records
- 2004-04-29 Sold (MLS) $27,000 BRIGHT MLS
- 2004-04-01 Listing Removed — BRIGHT MLS
- 2004-03-24 Listed $27,000 BRIGHT MLS
- 2000-05-15 Listing Removed — BRIGHT MLS
- 1999-10-16 Listed $25,000 BRIGHT MLS
- 1999-01-15 Listing Removed — BRIGHT MLS
- 1998-07-08 Listed $28,000 BRIGHT MLS
- 1998-06-30 Listing Removed — BRIGHT MLS
- 1997-08-10 Listed $33,900 BRIGHT MLS
- 1995-10-06 Listing Removed — BRIGHT MLS
- 1995-10-06 Listed $32,000 BRIGHT MLS
- 1989-09-11 Sold (Public Records) $8,000 Public Records
Property tax history
-6.4%/yrLatest (2026): $706 · -51.3% YoY. Source: county tax records.
Cash-flow waterfall
monthlySold comps — $/sqft
last 12 mo · ≤1 miLoading sold comps…