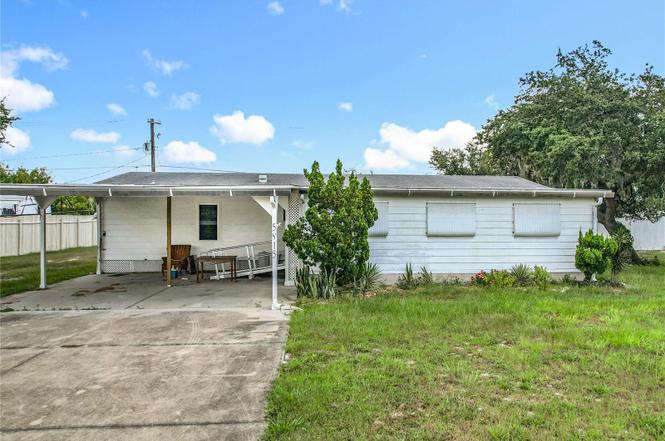
5815 Red Fox Dr · Winter Haven, FL
Flood risk 1/10 · Minimal
- FEMA flood zone
- X (unshaded)
- Chance of flooding over 30 yrs
- 0.0%
- Est. flood insurance / yr
- $507 – $1,088
Fire risk 4/10 · Minor
- Est. fire insurance / yr
- $947 – $1,759
Heat risk 8/10 · Major
- Hot days now (above 108°F)
- 7 days/yr
- Hot days in 30 yrs
- 25 days/yr
Wind risk 9/10 · Severe
- Chance of severe wind over 30 yrs
- 99.0%
Air-quality risk 2/10 · Minimal
- Unhealthy air days now
- 0 days/yr
- Unhealthy air days in 30 yrs
- 2 days/yr
Risk factors via First Street. Map © Google.
Why this score? — see what drove the B- grade
The composite is a weighted blend of 9 inputs, each scored 0–100. Each bar is that input's sub-score; the figure is the points it added to the 100-point composite (weight × sub-score).
- Cash flow +30.0/30.0
- DSCR +10.0/10.0
- 1% rule +9.7/10.0
- ARV discount +7.5/15.0
- Livability +3.7/5.0
- Schools +3.5/10.0
- Rent growth +3.0/5.0
- Condition / age +2.5/5.0
- Appreciation +0.0/10.0
$119,900
🖨 Deal sheet 📄 Offer letter ✓ Due diligence
Listing remarks
Welcome to this spacious 3-bedroom, 2-bath manufactured home in the heart of Winter Haven! You'll love the layout, with a comfortable living room, a cozy den for extra hangout space, and a kitchen that opens up to a dining area—perfect for family meals or hosting friends. The master bedroom comes with its own en suite bathroom for extra privacy. Just off the kitchen, step into the screened patio that leads to a large garage that’s been converted into a handy workspace—ideal for hobbies, projects, or extra storage. Sitting on an oversized lot, there’s plenty of room to garden, play, or just enjoy the outdoors. Come check it out and imagine the possibilities!
Key facts
- Screened patio
- Converted garage
- Oversized lot
Tags
Neighborhood map
What this means for you Summary
Snapshot
- This is a 3-bed/2.0-bath manufactured listed at $120k.
Deal economics
- At list price, monthly cash flow is $523 ($6k/yr) — positive.
- The deal already cash-flows at list — no discount required.
- Meets the 1% rule at list price ($2k rent vs $120k).
- Recommended offer: $113k (6.0% below list) — sets the bar for market timing.
Location & tenants
- Location reads 74/100 on livability (#291 in FL, #4,898 nationally) — a middle-class / working-renter tenant base. Strengths: cost of living A+, housing A+, health & safety A; Watch: schools C-, employment C-, amenities F.
- Polk (suburban): math 39% / reading 43% proficiency, ranked #62 of 73 in FL (top 85%) — families likely to look elsewhere, expect single-tenant / working-renter base with shorter leases.
- Market conditions: Rents rising (+1.9%/yr); 680 active listings in the ZIP; 17 comparable units currently listed for rent nearby; rentals at typical pace (median 24d on market — plan ~3-4 weeks tenant-placement turnaround); 10,384 units permitted in Polk County in 2024 (1,716 in 5+ unit buildings).
- This rent runs 30% of the median local income ($70k/yr) — at the standard rent-burdened threshold; future hikes will face affordability resistance.
Forward outlook
- Local home prices are declining (-3.0%/yr); year-one equity from $829 of loan paydown is wiped out by about $4k of value loss. Plan a longer hold.
- Polk County population projected at +33% by 2050 — long-run rental-demand tailwind backs the buy-and-hold thesis.
- At projected returns (-3.0% appreciation + 1.9% rent growth), your $34k cash investment doubles in ~7 years — after that, you're playing with house money.
Negotiation context
- It's been on market 80 days — a 6% lower offer ($113k) is reasonable based on typical stale-listing flexibility.
- Current owner paid $66k; list at $120k implies a 82% gain — meaningful room to come down on a strong offer.
Risks & watch-outs
- Climate carrying-cost: severe wind risk, 99% chance of damaging wind over 30y; extreme-heat days projected 7→25/yr by 2055 (HVAC capex compounding) — expect insurance premiums to compound above CPI over the hold.
Questions for the listing agent
- It's been on market 80 days. Have you received any prior offers? Is the seller open to a 6% concession, seller financing, or rate buy-down credit?
- Why hasn't it sold? Are there any deal-killer items the seller is aware of (foundation, flood, title, zoning, code violations)?
- Is there a deadline driving the sale (1031 exchange, divorce, estate, relocation)? That informs how much negotiation room exists.
- What's the average days-on-market for RENTAL listings here right now (not sales)? A rising rental-DOM trend means longer vacancies and softer asking-rent achievability than the comps imply.
- What's the recent tenant-quality profile in this submarket — average credit score on applications, eviction rate, late-payment / NSF rate, and stable-employment percentage? A property-management company in the area should have these aggregated.
- How much new for-sale + rental construction is in the pipeline within 1–3 miles? Heavy new supply typically softens prices + rents 12–24 months out; constrained supply supports both.
Investment metrics
- 1% rule
- 1.47% ✓
- Cap rate
- 11.53%
- Cash-on-cash
- 18.70%
- DSCR
- 1.83
- GRM
- 5.7
CMA / ARV
No comps found within radius.
Projected returns pro-forma
-3.0% appreciation · 1.9% rent growth · sell at horizon
- IRR
- 9.2%
- Equity multiple
- 1.36×
- Total profit
- $12,020
- Equity at exit
- $17,877
- IRR
- 17.4%
- Equity multiple
- 2.37×
- Total profit
- $45,841
- Equity at exit
- $10,367
Cash invested: $33,572 (down + closing). Projections, not guarantees.
Landlord ↔ Tenant lean methodology
- Overall (STATE)
- 87 Strongly Landlord-Friendly
- State Florida
- 87 Strongly Landlord-Friendly · R+3
- County
- — inherits STATE
- City
- — inherits STATE
ZIP-level market 33884
- Home prices YoY
- -34.1%
- Rents YoY
- 1.9%
- Active inventory
- 680
- Price-to-rent
- 5.7×
Monthly cashflow live
- Estimated rent
- $1,765 high interval (Pro) →
- Mortgage (P&I)
- −$629
- Tax from tax record
- −$192 /mo · $2,309/yr
- Insurance
- −$50
- HOA
- −$0
- Vacancy / Maint / Mgmt
- −$371
- Net cashflow
- $523
Break-even live
UW: 25.0% down · 7.5% · 30yr · 1.5% tax · 5.0% vac · 8.0% maint · 8.0% mgmt
Financing live
Cash to close
- Down payment
- $29,975
- Closing costs
- $3,597
- Reserves months
- —
- Total cash needed
- —
Loan-product check · same deal, 3 products live
Conventional
25% down · 7.5% · 30yr
- Down + closing
- —
- Monthly P&I
- —
- Monthly cashflow
- —
- DSCR
- —
- Eligible?
- —
Personal DTI + credit; lowest rate.
DSCR
20% down · 8.5% · 30yr
- Down + closing
- —
- Monthly P&I
- —
- Monthly cashflow
- —
- DSCR
- —
- Eligible?
- —
No personal income docs; deal must DSCR.
Hard money
10% down · 12.0% · 12mo
- Down + closing
- —
- Monthly P&I
- —
- Monthly cashflow
- —
- DSCR
- —
- Eligible?
- —
Short-term bridge; refi at stabilization.
Rent comps 17 comps
| Address | Beds | Baths | Sqft | Rent | $/sqft | DOM | Units | Dist |
|---|---|---|---|---|---|---|---|---|
| 5657 Struthers Ct Winter Haven, FL | 2.0 | 1.0 | 780 | $1,475 | $1.89 | 10d | 1 | 0.23mi |
| 5657 Struthers Ct Unit 1 Winter Haven, FL | 2.0 | 1.0 | 800 | $1,475 | $1.84 | 14d | 1 | 0.23mi |
| 5665 Struthers Ct Unit 5667 Winter Haven, FL | 2.0 | 1.0 | 775 | $1,350 | $1.74 | 23d | 1 | 0.23mi |
| 5667 Struthers Ct Winter Haven, FL | 2.0 | 1.0 | 775 | $1,350 | $1.74 | 23d | 1 | 0.23mi |
| 5608 Lake Fox Cir Winter Haven, FL | 3.0 | 2.0 | 1490 | $2,400 | $1.61 | 23d | 1 | 0.61mi |
| 1015 Lake Forest Blvd Winter Haven, FL | 1.0–3.0 | 1.0–2.0 | 929 | $2,175 | $2.34 | 2d | 24 | 0.94mi |
| 4025 Lake Ned Village Cir Winter Haven, FL | 1.0–3.0 | 1.0–2.0 | 1025 | $1,800 | $1.76 | 3d | 8 | 1.15mi |
| 7676 Carlton Arms Blvd Winter Haven, FL | 3.0 | 1.0–2.5 | 987 | $1,833 | $1.86 | 23d | 1 | 1.35mi |
| 7903 Waterview Way Unit 7903 Winter Haven, FL | 2.0 | 2.0 | 930 | $1,600 | $1.72 | 23d | 1 | 1.37mi |
| 3110 Gowan Dr Winter Haven, FL | 1.0–2.0 | 1.0–2.0 | 1007 | $1,841 | $1.83 | 14d | 24 | 1.38mi |
| 1707 Eagle Pond Dr Unit 1707 Winter Haven, FL | 2.0 | 2.0 | 1017 | $1,450 | $1.43 | 23d | 1 | 1.43mi |
| 206 Kingshill Ct SE Winter Haven, FL | 3.0 | 2.0 | 1460 | $1,800 | $1.23 | 3d | 1 | 1.45mi |
| 508 Eagle Pond Dr #508 Winter Haven, FL | 2.0 | 2.0 | 1017 | $1,500 | $1.47 | 23d | 1 | 1.47mi |
| 1202 Eagle Pond Dr Unit 1202 Winter Haven, FL | 2.0 | 2.0 | 1017 | $1,450 | $1.43 | 14d | 1 | 1.47mi |
| 408 Lake Ned Rd Winter Haven, FL | 3.0 | 2.0 | 1470 | $2,100 | $1.43 | 23d | 1 | 1.48mi |
| 5202 Waterview Way #5202 Winter Haven, FL | 2.0 | 2.0 | 930 | $1,750 | $1.88 | 23d | 1 | 1.50mi |
| 1101 Eagle Pond Dr #1101 Winter Haven, FL | 2.0 | 2.0 | 1017 | $1,400 | $1.38 | 23d | 1 | 1.50mi |
Listing history 6 events
-
2026-02-20status Pending
-
2026-02-06price $119,900
-
2026-01-11price $152,000
-
2025-12-02$190,000 Active
-
2004-03-22soldstatus $66,000
-
1990-08-01soldstatus $51,000
ⓘ Source: listings_history table (triggers on properties + properties_extension) + one-shot
backfill from property_details.listing_events for pre-trigger history.
Tax reassessment forecast FL · Resets to sale price
- Current annual tax
- $2,309 · $192/mo
- Projected year-2 tax
- $2,309 · $192/mo
- Expected delta
- $0/yr ($0/mo · 0.0%)
ⓘ Screening estimate from a state-policy table — verify with the county assessor before closing.
Climate risk First Street
- Flood 1/10 Low FEMA zone X (unshaded) · 0% chance over 30 yrs
- Wildfire 4/10 Moderate
- Heat 8/10 Severe 7 d/yr ≥108°F today · 25 d/yr by 30 yrs out
- Wind 9/10 Extreme 99% chance of damaging wind over 30 yrs
- Air quality 2/10 Low 0 unhealthy d/yr today · 2 by 30 yrs out
Nearby sold comps map
Loading sold comps map…
Walkable amenities ~0.75 mi
Loading nearby amenities…
Taxation est. · year 1
- Rental income
- $21,181
- − Mortgage interest
- −$6,716
- − Property taxes
- −$2,309
- − Insurance
- −$600
- − Repairs & maintenance
- −$1,695
- − Management
- −$1,695
- − Depreciation
- −$3,488
- Taxable income
- $4,680
- Est. tax owed @ 24.0%
- −$1,123
- After-tax cash flow
- $5,156/yr
For passive investors: Depreciation is non-cash, so a rental often shows a tax loss while cash-flowing — sheltering income. Rental losses are passive: they offset passive income freely, and up to $25,000/yr can offset ordinary (W-2) income if you actively participate and your MAGI is under $100k (phasing out to $0 by $150k); unused losses carry forward. On sale, claimed depreciation is recaptured at up to 25%, and gains may owe capital-gains tax (a 1031 exchange can defer both). Figures are a year-1 estimate at your 24.0% rate — not tax advice; consult a CPA.
Schools (NCES district)
- District
- Polk
- NCES district ID
- 1201590
- Math proficiency
- 39% ▼ -11.00%
- Reading proficiency
- 43% ▼ -4.00%
- Median HH income
- $43,979
- Composite
- 34.74/100
- National rank
- #5132
- State rank
- #62 of 73 in FL
Livability — Winter Haven
- Score
- 74/100
- State rank
- #291
- US rank
- #4898
Category grades
Schools grade is shown separately in the Schools card above.
Census & demographics
- County
- Polk County · 740,051 people
- City population
- 121,740
- Metro
- Lakeland-Winter Haven, FL
- Population (ZIP)
- 37,561
- Household income
- $70,443
- Rent vs Own
- Severe rent burden
- 949.0
Population outlook (Polk County) Hauer SSP2
- Today (2025)
- 752,975 people
- By 2030
- 804,621 · +6.9%
- By 2040
- 906,117 · +20.3%
- By 2050
- 1,000,476 · +32.9%
- By 2075
- 1,197,520 · +59.0%
- By 2100
- 1,271,518 · +68.9%
Race, ethnicity, and origin ACS 2023
- Neighborhood character
- Diverse neighborhood (Simpson 0.55)
- Race & ethnicity
- White 63% Hispanic / Latino 19% Black 14% Two or more races 7% Asian 2%
- Hispanic origin (detail)
- Mexican 2% Puerto Rican 10% Cuban 2%
- Common ancestry
- Romanian 2% Lithuanian 2% Hispanic 2%
- Foreign-born
- 7% · Canada, Jamaica
- Languages at home
- 84% English-only · Spanish 12% French/Haitian/Cajun 1% Other Indo-European 1%
Political lean MEDSL · Polk
- 2024 margin
- Strong R (+20.7) · D 39.2% · R 59.9%
- 2008→2024 swing
- -14.6pp toward R · 2008: -6.1pp · 2024: -20.7pp
- All cycles
- 2024: R+20.7 2020: R+14.4 2016: R+14.1 2012: R+6.8 2008: R+6.1
Not yet ingested
- Civics
- —
Market trends
- HPI YoY
- ▼ -134.69%
- Current HPI
- 260.1421
- Rent YoY
- ▲ 1.90%
- Metro
- Lakeland-Winter Haven, FL
- State GDP YoY
- ▲ 3.28%
- F500 in state
- 36
Industry mix (Fortune 500 HQ in FL)
| Industry | F500 HQs | Revenue |
|---|---|---|
| Industrial Technology | 2 | $29B |
|
||
| Insurance | 2 | $17B |
|
||
| Retail | 1 | $60B |
|
||
| Technology Distribution | 1 | $58B |
|
||
| Homebuilding | 1 | $35B |
|
||
| Technology Manufacturing | 1 | $35B |
|
||
Price history
+135.1% since first listed6 events — show timeline
- 2026-02-20 Pending — Stellar MLS as Distributed by MLS Grid
- 2026-02-06 Price Changed $119,900 Stellar MLS as Distributed by MLS Grid
- 2026-01-11 Price Changed $152,000 Stellar MLS as Distributed by MLS Grid
- 2025-12-02 Listed $190,000 Stellar MLS as Distributed by MLS Grid
- 2004-03-22 Sold (Public Records) $66,000 Public Records
- 1990-08-01 Sold (Public Records) $51,000 Public Records
Property tax history
+17.6%/yrLatest (2025): $2,309 · +6.4% YoY. Source: county tax records.
Cash-flow waterfall
monthlySold comps — $/sqft
last 12 mo · ≤1 miLoading sold comps…