 🏷️ Likely Rental
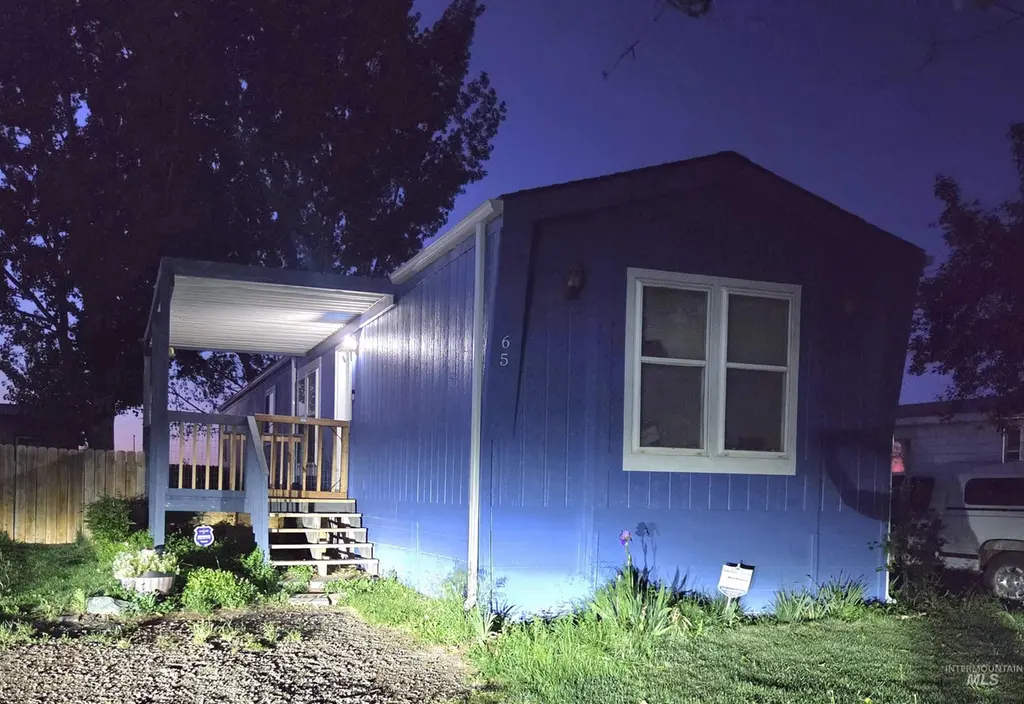
1220 N 4th #65 · Parma, ID
Flood risk 1/10 · Minimal
- FEMA flood zone
- X (unshaded)
- Chance of flooding over 30 yrs
- 0.0%
- Est. flood insurance / yr
- $473 – $860
Fire risk 2/10 · Minimal
- Est. fire insurance / yr
- $584 – $1,086
Heat risk 4/10 · Minor
- Hot days now (above 98°F)
- 7 days/yr
- Hot days in 30 yrs
- 19 days/yr
Wind risk 1/10 · Minimal
- Chance of severe wind over 30 yrs
- —
Air-quality risk 7/10 · Major
- Unhealthy air days now
- 10 days/yr
- Unhealthy air days in 30 yrs
- 12 days/yr
Risk factors via First Street. Map © Google.
Why this score? — see what drove the A- grade
The composite is a weighted blend of 9 inputs, each scored 0–100. Each bar is that input's sub-score; the figure is the points it added to the 100-point composite (weight × sub-score).
- Cash flow +30.0/30.0
- ARV discount +15.0/15.0
- 1% rule +10.0/10.0
- DSCR +10.0/10.0
- Appreciation +5.0/10.0
- Schools +4.2/10.0
- Livability +3.4/5.0
- Rent growth +2.5/5.0
- Condition / age +2.5/5.0
$55,000
🖨 Deal sheet 📄 Offer letter ✓ Due diligence
Listing remarks
GREAT UPGRADES: New Furnance 2021, New Roof 2021, New Exterior Paint and New Siding 2026, New A/C 2026. Home is listed as is, may wish to replace carpeting. Has sprinklers and is located second to the end unit on the right, the lot is sized for a double wide. The kitchen includes a bar counter seating, oak cabinets and pantry. The laundry room has a water softner and also oak storage cabinets, the property has two storage units. The back yard has two rasied beds. Nice covered entry porch too! Easy to show, lockbox, and vacant! Lot rent $600 per month!
Key facts
- Bar counter seating
- New furnace
- New siding
Tags
Property features AI
Finance
- Other: Located in the Quail Ridge Estates subdivision
- HOA & community: Monthly association fee of $585
Exterior
- Parking: No garage information provided
- Utilities: Community water service; Sewer connected; Cable connected; Paved road access
- Home design: Mobile/manufactured home on a rented lot; Built in 1994
- Construction: Year built 1994
- Exterior features: Covered patio/deck; Garden; Irrigation available; Storage shed
Interior
- Kitchen: Dishwasher; Breakfast bar
- Bedrooms: 2 bedrooms (master on the main level)
- Flooring: Carpet; Vinyl sheet
- Bathrooms: 2 bathrooms
- Heating & cooling: Forced air heating; Central air conditioning
- Interior features: Master bedroom on the main level; Split bedroom floorplan; Breakfast bar; Laminate counters
- Laundry & utility: Utility room approximately 6 x 7; Electric water heater
Neighborhood map
What this means for you Summary
Snapshot
- This is a 3-bed/2.0-bath manufactured listed at $55k.
Deal economics
- At list price, monthly cash flow is $618 ($7k/yr) — positive.
- The deal already cash-flows at list — no discount required.
- Meets the 1% rule at list price ($1k rent vs $55k).
- Recommended offer: $53k (3.0% below list) — sets the bar for market timing.
- Cap rate 19.8% vs local median 2.4% in Parma — top-decile yield for the area; either an underpriced asset or a hidden risk that comps aren't pricing in. Stress-test before assuming the spread holds.
Location & tenants
- Location reads 68/100 on livability (#86 in ID) — a middle-class / working-renter tenant base. Strengths: cost of living A+, housing A+, crime B+; Watch: amenities F, commute F, employment F.
- Parma District (rural): math 41% / reading 59% proficiency, ranked #35 of 92 in ID (top 38%) — acceptable for families but not a draw, mixed tenant base, ~2y average lease.
- Zoned schools: Parma High School (math 27% / reading 57%, grade F, #72 of 169 statewide, top 47%, 334 students, 31% FRL) — zoned schools average 31% FRL vs 52% district-wide (21 pts lower); this property's tenant base skews higher-income than the district average.
- Market conditions: 1 active listings in the ZIP; 1 comparable units currently listed for rent nearby; 3,620 units permitted in Canyon County in 2024 (196 in 5+ unit buildings).
Forward outlook
- In year one you build about $2k of equity ($380 loan paydown + $2k appreciation (3.0% local appreciation)).
- Canyon County population projected at +41% by 2050 — long-run rental-demand tailwind backs the buy-and-hold thesis.
- At projected returns (3.0% appreciation + 3.0% rent growth), your $15k cash investment doubles in ~2 years — after that, you're playing with house money.
Negotiation context
- It's been on market 37 days — a 3% lower offer ($53k) is reasonable based on typical stale-listing flexibility.
Questions for the listing agent
- It's been on market 37 days. Have you received any prior offers? Is the seller open to a 3% concession, seller financing, or rate buy-down credit?
- Is there a deadline driving the sale (1031 exchange, divorce, estate, relocation)? That informs how much negotiation room exists.
- Schools are D-rated, which usually means shorter tenancies and higher turnover. Who's the typical renter profile here, and what's been the actual vacancy rate?
- What's the average days-on-market for RENTAL listings here right now (not sales)? A rising rental-DOM trend means longer vacancies and softer asking-rent achievability than the comps imply.
- What's the recent tenant-quality profile in this submarket — average credit score on applications, eviction rate, late-payment / NSF rate, and stable-employment percentage? A property-management company in the area should have these aggregated.
- How much new for-sale + rental construction is in the pipeline within 1–3 miles? Heavy new supply typically softens prices + rents 12–24 months out; constrained supply supports both.
Investment metrics
- 1% rule
- 2.18% ✓
- Cap rate
- 19.77%
- Cash-on-cash
- 48.15%
- DSCR
- 3.14
- GRM
- 3.8
CMA / ARV
- ARV (on-the-fly)
- $73,920
- Comps found
- 3
Show comp detail 3 sales within ~0.75 mi
| Address | Dist | Beds/Ba | Sqft | Sold | Price | $/sf | Match |
|---|---|---|---|---|---|---|---|
| 1220 N 4th St #64 | 0.00mi | 3/2.0 | 1,098 (+14%) | 8mo | $63,900 | $58 | 69 |
| 1220 N 4th St #37 | 0.00mi | 2/1.0 (-1) | 840 (-12%) | 10mo | $79,900 | $95 | 62 |
| 1220 N 4th St #10 | 0.00mi | 2/1.0 (-1) | 840 (-12%) | 14mo | $64,990 | $77 | 59 |
Match score weights: distance 35% · size 25% · config 20% · recency 20%. Top-matched comps best support the ARV.
Projected returns pro-forma
3.0% appreciation · 3.0% rent growth · sell at horizon
- IRR
- 53.3%
- Equity multiple
- 3.98×
- Total profit
- $45,967
- Equity at exit
- $24,730
- IRR
- 53.0%
- Equity multiple
- 8.04×
- Total profit
- $108,477
- Equity at exit
- $38,112
Cash invested: $15,400 (down + closing). Projections, not guarantees.
Landlord ↔ Tenant lean methodology
- Overall (STATE)
- 91 Strongly Landlord-Friendly
- State Idaho
- 91 Strongly Landlord-Friendly · R+18
- County
- — inherits STATE
- City
- — inherits STATE
ZIP-level market 83660-5569
- Active inventory
- 1
- Price-to-rent
- 3.8×
Monthly cashflow live
- Estimated rent
- $1,200 medium interval (Pro) →
- Mortgage (P&I)
- −$288
- Tax from tax record
- −$19 /mo · $225/yr
- Insurance
- −$23
- HOA
- −$0
- Vacancy / Maint / Mgmt
- −$252
- Net cashflow
- $618
Break-even live
UW: 25.0% down · 7.5% · 30yr · 1.5% tax · 5.0% vac · 8.0% maint · 8.0% mgmt
Financing live
Cash to close
- Down payment
- $13,750
- Closing costs
- $1,650
- Reserves months
- —
- Total cash needed
- —
Loan-product check · same deal, 3 products live
Conventional
25% down · 7.5% · 30yr
- Down + closing
- —
- Monthly P&I
- —
- Monthly cashflow
- —
- DSCR
- —
- Eligible?
- —
Personal DTI + credit; lowest rate.
DSCR
20% down · 8.5% · 30yr
- Down + closing
- —
- Monthly P&I
- —
- Monthly cashflow
- —
- DSCR
- —
- Eligible?
- —
No personal income docs; deal must DSCR.
Hard money
10% down · 12.0% · 12mo
- Down + closing
- —
- Monthly P&I
- —
- Monthly cashflow
- —
- DSCR
- —
- Eligible?
- —
Short-term bridge; refi at stabilization.
Rent comps 1 comps
| Address | Beds | Baths | Sqft | Rent | $/sqft | DOM | Units | Dist |
|---|---|---|---|---|---|---|---|---|
| 201 E Starcher Ave Parma, ID | 2.0 | 1.0 | 684 | $1,200 | $1.75 | 14d | 1 | 0.72mi |
Listing history 14 events
-
2026-06-18days on market $55,000 Active 37 DOM
-
2026-06-17days on market $55,000 Active 36 DOM
-
2026-06-16days on market $55,000 Active 35 DOM
-
2026-06-15days on market $55,000 Active 34 DOM
-
2026-06-13days on market $55,000 Active 32 DOM
-
2026-06-10days on market $55,000 Active 29 DOM
-
2026-06-09days on market $55,000 Active 28 DOM
-
2026-06-08days on market $55,000 Active 27 DOM
-
2026-06-07days on market $55,000 Active 26 DOM
-
2026-06-03days on market $55,000 Active 22 DOM
-
2026-06-03days on market $55,000 Active 21 DOM
-
2026-06-01days on market $55,000 Active 20 DOM
-
2026-05-31days on market $55,000 Active 19 DOM
-
2026-05-11$55,000 Active
ⓘ Source: listings_history table (triggers on properties + properties_extension) + one-shot
backfill from property_details.listing_events for pre-trigger history.
Tax reassessment forecast ID · Resets to sale price
- Current annual tax
- $225 · $19/mo
- Projected year-2 tax
- $380 · $32/mo
- Expected delta
- +$154/yr (+$13/mo · 68.6%)
ⓘ Screening estimate from a state-policy table — verify with the county assessor before closing.
Climate risk First Street
- Flood 1/10 Low FEMA zone X (unshaded) · 0% chance over 30 yrs
- Wildfire 2/10 Low
- Heat 4/10 Moderate 7 d/yr ≥98°F today · 19 d/yr by 30 yrs out
- Wind 1/10 Low
- Air quality 7/10 Severe 10 unhealthy d/yr today · 12 by 30 yrs out
Nearby sold comps map
Loading sold comps map…
Walkable amenities ~0.75 mi
Loading nearby amenities…
Taxation est. · year 1
- Rental income
- $14,400
- − Mortgage interest
- −$3,081
- − Property taxes
- −$225
- − Insurance
- −$275
- − Repairs & maintenance
- −$1,152
- − Management
- −$1,152
- − Depreciation
- −$1,600
- Taxable income
- $6,915
- Est. tax owed @ 24.0%
- −$1,660
- After-tax cash flow
- $5,755/yr
For passive investors: Depreciation is non-cash, so a rental often shows a tax loss while cash-flowing — sheltering income. Rental losses are passive: they offset passive income freely, and up to $25,000/yr can offset ordinary (W-2) income if you actively participate and your MAGI is under $100k (phasing out to $0 by $150k); unused losses carry forward. On sale, claimed depreciation is recaptured at up to 25%, and gains may owe capital-gains tax (a 1031 exchange can defer both). Figures are a year-1 estimate at your 24.0% rate — not tax advice; consult a CPA.
Schools (NCES district)
- District
- Parma District
- NCES district ID
- 1602550
- Math proficiency
- 41% ▬ 0.00%
- Reading proficiency
- 59% ▲ 5.00%
- Median HH income
- $42,076
- Composite
- 41.96/100
- National rank
- #3346
- State rank
- #35 of 92 in ID
Livability — Parma
- Score
- 68/100
- State rank
- #86
- US rank
- #9964
Category grades
Schools grade is shown separately in the Schools card above.
Census & demographics
- Census place
- Parma, ID
Population outlook (Canyon County) Hauer SSP2
- Today (2025)
- 248,853 people
- By 2030
- 269,596 · +8.3%
- By 2040
- 311,081 · +25.0%
- By 2050
- 350,809 · +41.0%
- By 2075
- 441,884 · +77.6%
- By 2100
- 505,641 · +103.2%
Not yet ingested
- Political lean
- —
- Race & ethnicity
- —
- Common origin
- —
- Civics
- —
Market trends
- HPI YoY
- —
- Current HPI
- —
- Rent YoY
- —
- Metro
- —
- State GDP YoY
- ▲ 4.51%
- F500 in state
- 6
Industry mix (Fortune 500 HQ in ID)
| Industry | F500 HQs | Revenue |
|---|---|---|
| Retail | 1 | $79B |
|
||
| Technology | 1 | $25B |
|
||
| Food / Agriculture | 1 | $6B |
|
||
Price history
1 event — show timeline
- 2026-05-11 Listed $55,000 IMLS
Property tax history
+3.0%/yrLatest (2025): $225 · +47.1% YoY. Source: county tax records.
Cash-flow waterfall
monthlySold comps — $/sqft
last 12 mo · ≤1 miLoading sold comps…