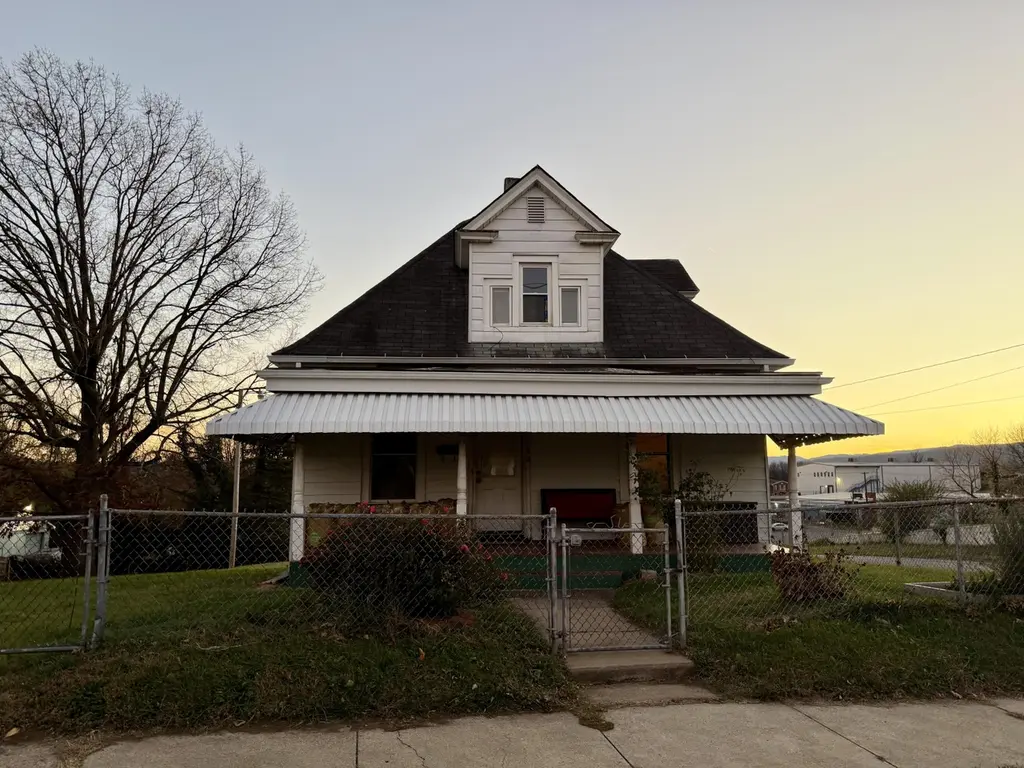
1730 Moorman Ave NW · Roanoke, VA
Flood risk 1/10 · Minimal
- FEMA flood zone
- X (unshaded)
- Chance of flooding over 30 yrs
- 0.0%
- Est. flood insurance / yr
- $507 – $1,088
Fire risk 1/10 · Minimal
- Est. fire insurance / yr
- $666 – $1,236
Heat risk 5/10 · Moderate
- Hot days now (above 101°F)
- 7 days/yr
- Hot days in 30 yrs
- 18 days/yr
Wind risk 2/10 · Minimal
- Chance of severe wind over 30 yrs
- 1.0%
Air-quality risk 1/10 · Minimal
- Unhealthy air days now
- 0 days/yr
- Unhealthy air days in 30 yrs
- 0 days/yr
Risk factors via First Street. Map © Google.
Why this score? — see what drove the D grade
The composite is a weighted blend of 9 inputs, each scored 0–100. Each bar is that input's sub-score; the figure is the points it added to the 100-point composite (weight × sub-score).
- Cash flow +18.0/30.0
- DSCR +5.6/10.0
- Schools +4.1/10.0
- 1% rule +4.0/10.0
- Rent growth +3.9/5.0
- Livability +3.7/5.0
- Condition / age +2.5/5.0
- ARV discount +0.0/15.0
- Appreciation +0.0/10.0
$159,950
🖨 Deal sheet 📄 Offer letter ✓ Due diligence
Listing remarks MLS
Discover a rare gem at 1730 Moorman Ave, Roanoke, VA 24017! This well-maintained three-bedroom, two-full-bathroom home comes with TWO lots, offering a level to gently sloping yard that's fully fenced-in--perfect for kids, pets, or simply enjoying extra privacy and room to roam. The first lot has a concrete pad for parking or a shed. The second lot could easily serve as a future building lot or additional play space. Inside, you'll love the updated bathroom flooring and easy-care tilt-in windows, while the covered front porch with beautiful mosaic tile welcomes you home. Enjoy the convenience of sidewalk-lined streets and public transportation right at your doorstep with the bus line just steps away. Whether you're a first-time buyer, a growing family, or looking for room to expand Schedule your tour today this one won't last long!
Key facts
- Covered front porch
- Two lots
- Fully fenced-in yard
Tags
Neighborhood map
What this means for you Summary
Snapshot
- This is a 3-bed/2.0-bath single-family listed at $160k.
Deal economics
- At list price, monthly cash flow is $138 ($2k/yr) — positive.
- The deal already cash-flows at list — no discount required.
- To meet the 1% rule (rent ≥ 1% of price), the offer needs to be $143k (10.3% below list).
- Recommended offer: $141k (12.0% below list) — sets the bar for market timing.
- Cap rate 7.3% vs local median 4.2% in Roanoke — top-decile yield for the area; either an underpriced asset or a hidden risk that comps aren't pricing in. Stress-test before assuming the spread holds.
Location & tenants
- Location reads 73/100 on livability (#163 in VA) — a middle-class / working-renter tenant base. Strengths: cost of living A+, health & safety A+, housing A; Watch: amenities C-, employment D, crime F.
- Roanoke City Public School District (urban): math 40% / reading 58% proficiency, ranked #102 of 131 in VA (top 78%) — families likely to look elsewhere, expect single-tenant / working-renter base with shorter leases; 67% free/reduced lunch — lower-income household profile, screen leases tightly.
- Market conditions: Rents rising fast (+5.7%/yr); 151 active listings in the ZIP; 27 comparable units currently listed for rent nearby; rentals lingering (median 44d on market — plan ~5-8 weeks vacancy on turnover, expect pricing pressure); 52% of comp listings sitting > 30 days — soft ceiling on asking rent; 113 units permitted in Roanoke city in 2024 (0 in 5+ unit buildings).
- This rent runs 36% of the median local income ($47k/yr) — at the standard rent-burdened threshold; future hikes will face affordability resistance.
Forward outlook
- Local home prices are declining (-3.0%/yr); year-one equity from $1k of loan paydown is wiped out by about $5k of value loss. Plan a longer hold.
- Roanoke County population projected at +11% by 2050 — modest demand growth; plan on rents tracking national, not racing it.
Negotiation context
- It's been on market 174 days — a 12% lower offer ($141k) is reasonable based on typical stale-listing flexibility.
- 5 sale attempts since 21y ago with the ask held roughly flat each time — persistent listings suggest the price (not the market) is what's stuck; bring a comps-based counter.
- Current owner paid $17k; list at $160k implies a 852% gain — meaningful room to come down on a strong offer.
Risks & watch-outs
- Watch-outs: built in 1900 — expect roof / HVAC / electrical / plumbing capex.
- Climate carrying-cost: extreme-heat days projected 7→18/yr by 2055 (HVAC capex compounding) — expect insurance premiums to compound above CPI over the hold.
Questions for the listing agent
- It's been on market 174 days. Have you received any prior offers? Is the seller open to a 12% concession, seller financing, or rate buy-down credit?
- Built in 1900 — when were the roof, HVAC, electrical panel, plumbing, and water heater last replaced?
- Why hasn't it sold? Are there any deal-killer items the seller is aware of (foundation, flood, title, zoning, code violations)?
- Is there a deadline driving the sale (1031 exchange, divorce, estate, relocation)? That informs how much negotiation room exists.
- Schools are A-rated — typically a magnet for longer-tenancy family renters. What's the average tenant stay here, and is there a school-zone premium baked into asking?
- Crime grade is F in this area — have there been break-ins, vandalism, or insurance claims at this property in the last 3 years? What carrier currently insures it and at what premium?
- The area grade is low — what's the realistic commute time and amenity access for the typical tenant pool here? Any planned neighborhood developments (good or bad) we should know about?
- What's the average days-on-market for RENTAL listings here right now (not sales)? A rising rental-DOM trend means longer vacancies and softer asking-rent achievability than the comps imply.
- What's the recent tenant-quality profile in this submarket — average credit score on applications, eviction rate, late-payment / NSF rate, and stable-employment percentage? A property-management company in the area should have these aggregated.
- How much new for-sale + rental construction is in the pipeline within 1–3 miles? Heavy new supply typically softens prices + rents 12–24 months out; constrained supply supports both.
Investment metrics
- 1% rule
- 0.90% ✗
- Cap rate
- 7.33%
- Cash-on-cash
- 3.71%
- DSCR
- 1.16
- GRM
- 9.3
CMA / ARV
- ARV (median comp)
- $131,133
- List price
- $159,950
- Delta
- 21.98%
- Verdict
- OVERPRICED
- Comps
- 20 within 1.0 mi
Show comp detail 12 sales within ~0.75 mi
| Address | Dist | Beds/Ba | Sqft | Sold | Price | $/sf | Match |
|---|---|---|---|---|---|---|---|
| 1625 Moorman Ave NW | 0.10mi | 2/1.0 (-1) | 1,422 (+1%) | 7mo | $90,000 | $63 | 78 |
| 1724 Orange Ave NW | 0.17mi | 3/1.0 | 1,286 (-8%) | 3mo | $55,000 | $43 | 72 |
| 1326 Gilmer Ave NW | 0.36mi | 3/2.0 | 1,278 (-9%) | 3mo | $160,000 | $125 | 66 |
| 1528 Melrose Ave NW | 0.21mi | 3/1.0 | 1,224 (-13%) | 4mo | $51,000 | $42 | 62 |
| 1211 Hanover Ave NW | 0.54mi | 3/2.0 | 1,461 (+4%) | 8mo | $67,000 | $46 | 61 |
| 1224 Thomas Ave NW | 0.69mi | 3/2.0 | 1,344 (-4%) | 4mo | $108,000 | $80 | 57 |
| 1115 Orange Ave NW | 0.58mi | 3/1.5 | 1,487 (+6%) | 6mo | $100,835 | $68 | 56 |
| 1124 13th St NW | 0.55mi | 3/2.0 | 1,240 (-12%) | 1mo | $206,000 | $166 | 54 |
| 2407 Maryland Ave NW | 0.61mi | 4/2.0 (+1) | 1,464 (+4%) | 6mo | $170,100 | $116 | 54 |
| 716 12th St NW | 0.51mi | 3/2.0 | 1,264 (-10%) | 8mo | $222,400 | $176 | 53 |
| 1025 Mercer Ave NW | 0.73mi | 3/1.0 | 1,296 (-8%) | 6mo | $50,000 | $39 | 44 |
| 915 Loudon Ave NW | 0.72mi | 2/1.0 (-1) | 1,293 (-8%) | 4mo | $190,000 | $147 | 41 |
Match score weights: distance 35% · size 25% · config 20% · recency 20%. Top-matched comps best support the ARV.
Projected returns pro-forma
-3.0% appreciation · 5.71% rent growth · sell at horizon
- IRR
- -7.8%
- Equity multiple
- 0.71×
- Total profit
- $-13,138
- Equity at exit
- $23,849
- IRR
- 4.7%
- Equity multiple
- 1.38×
- Total profit
- $17,141
- Equity at exit
- $13,830
Cash invested: $44,786 (down + closing). Projections, not guarantees.
Landlord ↔ Tenant lean methodology
- Overall (STATE)
- 55 Moderately Landlord-Leaning
- State Virginia
- 55 Moderately Landlord-Leaning · D+2
- County
- — inherits STATE
- City
- — inherits STATE
ZIP-level market 24017
- Home prices YoY
- -28.3%
- Rents YoY
- 5.7%
- Active inventory
- 151
- Price-to-rent
- 9.3×
Monthly cashflow live
- Estimated rent
- $1,434 high interval (Pro) →
- Mortgage (P&I)
- −$839
- Tax from tax record
- −$89 /mo · $1,072/yr
- Insurance
- −$67
- HOA
- −$0
- Vacancy / Maint / Mgmt
- −$301
- Net cashflow
- $138
Break-even live
UW: 25.0% down · 7.5% · 30yr · 1.5% tax · 5.0% vac · 8.0% maint · 8.0% mgmt
Financing live
Cash to close
- Down payment
- $39,988
- Closing costs
- $4,798
- Reserves months
- —
- Total cash needed
- —
Loan-product check · same deal, 3 products live
Conventional
25% down · 7.5% · 30yr
- Down + closing
- —
- Monthly P&I
- —
- Monthly cashflow
- —
- DSCR
- —
- Eligible?
- —
Personal DTI + credit; lowest rate.
DSCR
20% down · 8.5% · 30yr
- Down + closing
- —
- Monthly P&I
- —
- Monthly cashflow
- —
- DSCR
- —
- Eligible?
- —
No personal income docs; deal must DSCR.
Hard money
10% down · 12.0% · 12mo
- Down + closing
- —
- Monthly P&I
- —
- Monthly cashflow
- —
- DSCR
- —
- Eligible?
- —
Short-term bridge; refi at stabilization.
Rent comps 27 comps
| Address | Beds | Baths | Sqft | Rent | $/sqft | DOM | Units | Dist |
|---|---|---|---|---|---|---|---|---|
| 10 12 1/2 St SW Roanoke, VA | 3.0 | 1.5 | 999 | $1,023 | $1.02 | 43d | 1 | 0.58mi |
| 821 12th St NW Roanoke, VA | 3.0 | 2.0 | 1508 | $1,625 | $1.08 | 43d | 1 | 0.59mi |
| 1533 Rugby Blvd NW Roanoke, VA | 3.0 | 1.0 | 1500 | $1,475 | $0.98 | 43d | 1 | 0.63mi |
| 1825 Patterson Ave SW Unit B Roanoke, VA | 2.0 | 1.0 | 1000 | $850 | $0.85 | 43d | 1 | 0.65mi |
| 1007 Gilmer Ave NW Roanoke, VA | 2.0 | 2.0 | 1187 | $1,175 | $0.99 | 21d | 1 | 0.67mi |
| 1630 Patterson Ave SW Unit B Roanoke, VA | 3.0 | 1.0 | 1200 | $1,395 | $1.16 | 43d | 1 | 0.68mi |
| 1531 Syracuse Ave NW Roanoke, VA | 3.0 | 1.0 | 1488 | $1,675 | $1.13 | 43d | 1 | 0.70mi |
| 1609 Chapman Ave SW Unit B Roanoke, VA | 4.0 | 1.0 | 1400 | $1,545 | $1.10 | 21d | 1 | 0.72mi |
| 1117 Rugby Blvd NW Unit B Roanoke, VA | 2.0 | 1.0 | 1048 | $778 | $0.74 | 21d | 1 | 0.72mi |
| 1115 Grayson Ave NW Roanoke, VA | 4.0 | 2.0 | 1094 | $2,300 | $2.10 | 43d | 1 | 0.79mi |
| 813 Gilmer Ave NW Roanoke, VA | 2.0 | 1.0 | 1050 | $1,322 | $1.26 | 21d | 1 | 0.83mi |
| 2744 Melrose Ave NW Roanoke, VA | 1.0–2.0 | 1.0–1.5 | 936 | $1,045 | $1.12 | 13d | 7 | 0.87mi |
| 733 29th St NW Roanoke, VA | 2.0–3.0 | 2.0 | 1022 | $1,625 | $1.59 | 13d | 4 | 0.89mi |
| 2608 Florida Ave NW Roanoke, VA | 3.0 | 1.0 | 1394 | $1,600 | $1.15 | 21d | 1 | 0.93mi |
| 701 Salem Ave SW Roanoke, VA | 2.0 | 1.0 | 1250 | $1,950 | $1.56 | 43d | 1 | 0.99mi |
| 401 Rutherford Ave NW Roanoke, VA | 3.0 | 1.0 | 1064 | $1,450 | $1.36 | 43d | 1 | 1.19mi |
| 333 Harrison Ave NW Roanoke, VA | 3.0 | 2.0 | 1186 | $1,123 | $0.95 | 21d | 1 | 1.20mi |
| 2731 Cove Rd NW Roanoke, VA | 3.0 | 2.5 | 1427 | $1,523 | $1.07 | 43d | 1 | 1.21mi |
| 1701 Westover Ave SW Roanoke, VA | 1.0–2.0 | 1.0 | 876 | $1,045 | $1.19 | 43d | 4 | 1.28mi |
| 216 Patton Ave NW Unit 2 Roanoke, VA | 2.0 | 1.0 | 1240 | $1,025 | $0.83 | 21d | 1 | 1.33mi |
| 602 Elm Ave Unit B Roanoke, VA | 2.0 | 1.0 | 1804 | $1,250 | $0.69 | 43d | 1 | 1.34mi |
| 430 Day Ave SW Unit A Roanoke, VA | 2.0 | 1.0 | 1444 | $1,650 | $1.14 | 43d | 1 | 1.41mi |
| 2216 Memorial Ave SW Unit 2218 Roanoke, VA | 2.0 | 1.0 | 1000 | $1,200 | $1.20 | 43d | 1 | 1.44mi |
| 2307 Memorial Ave SW Roanoke, VA | 2.0 | 1.5 | 1100 | $1,035 | $0.94 | 13d | 1 | 1.46mi |
| 1331 Main St SW Roanoke, VA | 2.0 | 1.0 | 877 | $1,023 | $1.17 | 21d | 1 | 1.49mi |
| 2325 Memorial Ave SW Unit 6 Roanoke, VA | 2.0 | 1.0 | 1050 | $1,125 | $1.07 | 21d | 1 | 1.49mi |
| 2325 Memorial Avenue SW Roanoke, VA | 1.0–2.0 | 1.0 | 925 | $1,225 | $1.32 | 13d | 3 | 1.49mi |
Listing history 19 events
-
2026-06-03status $159,950 Pending 174 DOM
-
2026-06-02days on market $159,950 Active 174 DOM
-
2026-06-01days on market $159,950 Active 173 DOM
-
2026-05-31days on market $159,950 Active 172 DOM
-
2026-05-30days on market $159,950 Active 171 DOM
-
2025-12-09$159,950 Active 842-char remark
Show marketing remark (842 chars)
Discover a rare gem at 1730 Moorman Ave, Roanoke, VA 24017! This well-maintained three-bedroom, two-full-bathroom home comes with TWO lots, offering a level to gently sloping yard that's fully fenced-in--perfect for kids, pets, or simply enjoying extra privacy and room to roam. The first lot has a concrete pad for parking or a shed. The second lot could easily serve as a future building lot or additional play space. Inside, you'll love the updated bathroom flooring and easy-care tilt-in windows, while the covered front porch with beautiful mosaic tile welcomes you home. Enjoy the convenience of sidewalk-lined streets and public transportation right at your doorstep with the bus line just steps away. Whether you're a first-time buyer, a growing family, or looking for room to expand Schedule your tour today this one won't last long!
-
2011-12-29soldstatus $16,800
-
2011-11-14historical
-
2011-06-07$29,950
-
2011-04-13soldstatus $27,140
-
2006-07-27soldstatus $37,000
-
2006-07-12soldstatus $37,000
-
2006-07-12soldstatus $37,000
-
2006-06-06$39,900
-
2006-04-19historical
-
2006-01-12$44,500
-
2005-12-10soldstatus $56,193
-
2005-05-20historical
-
2005-04-01$44,500
ⓘ Source: listings_history table (triggers on properties + properties_extension) + one-shot
backfill from property_details.listing_events for pre-trigger history.
Tax reassessment forecast VA · Resets to sale price
- Current annual tax
- $1,072 · $89/mo
- Projected year-2 tax
- $1,312 · $109/mo
- Expected delta
- +$240/yr (+$20/mo · 22.4%)
ⓘ Screening estimate from a state-policy table — verify with the county assessor before closing.
Climate risk First Street
- Flood 1/10 Low FEMA zone X (unshaded) · 0% chance over 30 yrs
- Wildfire 1/10 Low
- Heat 5/10 Major 7 d/yr ≥101°F today · 18 d/yr by 30 yrs out
- Wind 2/10 Low 100% chance of damaging wind over 30 yrs
- Air quality 1/10 Low 0 unhealthy d/yr today · 0 by 30 yrs out
Nearby sold comps map
Loading sold comps map…
Walkable amenities ~0.75 mi
Loading nearby amenities…
Taxation est. · year 1
- Rental income
- $17,211
- − Mortgage interest
- −$8,960
- − Property taxes
- −$1,072
- − Insurance
- −$800
- − Repairs & maintenance
- −$1,377
- − Management
- −$1,377
- − Depreciation
- −$4,653
- Taxable loss
- −$1,027
- Est. tax savings @ 24.0%
- +$246
- After-tax cash flow
- $1,906/yr
For passive investors: Depreciation is non-cash, so a rental often shows a tax loss while cash-flowing — sheltering income. Rental losses are passive: they offset passive income freely, and up to $25,000/yr can offset ordinary (W-2) income if you actively participate and your MAGI is under $100k (phasing out to $0 by $150k); unused losses carry forward. On sale, claimed depreciation is recaptured at up to 25%, and gains may owe capital-gains tax (a 1031 exchange can defer both). Figures are a year-1 estimate at your 24.0% rate — not tax advice; consult a CPA.
Schools (NCES district)
- District
- Roanoke City Public School District
- NCES district ID
- 5103300
- Math proficiency
- 40% ▼ -38.00%
- Reading proficiency
- 58% ▼ -12.00%
- Median HH income
- $38,592
- Composite
- 40.8/100
- National rank
- #3639
- State rank
- #102 of 131 in VA
Livability — Roanoke
- Score
- 73/100
- State rank
- #163
- US rank
- #5055
Category grades
Schools grade is shown separately in the Schools card above.
Census & demographics
- Census place
- Roanoke, VA
- County
- Roanoke City · 101,625 people
- City population
- 168,930
- Metro
- Roanoke, VA
- Population (ZIP)
- 23,678
- Household income
- $47,360
- Rent vs Own
- Severe rent burden
- 913.0
Population outlook (Roanoke County) Hauer SSP2
- Today (2025)
- 106,094 people
- By 2030
- 108,927 · +2.7%
- By 2040
- 114,104 · +7.5%
- By 2050
- 118,032 · +11.3%
- By 2075
- 123,363 · +16.3%
- By 2100
- 116,827 · +10.1%
Race, ethnicity, and origin ACS 2023
- Neighborhood character
- Diverse neighborhood (Simpson 0.58)
- Race & ethnicity
- Black 59% White 25% Hispanic / Latino 9% Asian 4% Two or more races 4%
- Hispanic origin (detail)
- Mexican 2% Cuban 1%
- Common ancestry
- Slovak 1% Romanian 1% Lithuanian 1%
- Foreign-born
- 9% · Canada, China, Vietnam
- Languages at home
- 87% English-only · Spanish 8% Other Indo-European 3% German/W. Germanic 1%
Political lean MEDSL · Roanoke
- 2024 margin
- Strong D (+23.6) · D 61.1% · R 37.5% · Other 1.4%
- 2008→2024 swing
- +0.2pp no change · 2008: 23.4pp · 2024: 23.6pp
- All cycles
- 2024: D+23.6 2020: D+25.8 2016: D+17.6 2012: D+21.5 2008: D+23.4
Not yet ingested
- Civics
- —
Market trends
- HPI YoY
- ▼ -78.29%
- Current HPI
- 198.5991
- Rent YoY
- ▲ 5.71%
- Metro
- Roanoke, VA
- State GDP YoY
- ▲ 2.40%
- F500 in state
- 50
Industry mix (Fortune 500 HQ in VA)
| Industry | F500 HQs | Revenue |
|---|---|---|
| Aerospace / Defense | 4 | $236B |
|
||
| Technology / Defense | 3 | $32B |
|
||
| Financial Services | 2 | $176B |
|
||
| Utilities | 2 | $27B |
|
||
| Insurance | 2 | $25B |
|
||
| Technology | 2 | $15B |
|
||
Price history
+259.4% since first listed14 events — show timeline
- 2025-12-09 Listed $159,950 MLSRV
- 2011-12-29 Sold (Public Records) $16,800 Public Records
- 2011-11-14 Listing Removed — MLSRV
- 2011-06-07 Listed $29,950 MLSRV
- 2011-04-13 Sold (Public Records) $27,140 Public Records
- 2006-07-27 Sold (MLS) $37,000 MLSRV
- 2006-07-12 Sold (Public Records) $37,000 Public Records
- 2006-07-12 Sold (Public Records) $37,000 Public Records
- 2006-06-06 Listed $39,900 MLSRV
- 2006-04-19 Listing Removed — MLSRV
- 2006-01-12 Listed $44,500 MLSRV
- 2005-12-10 Sold (Public Records) $56,193 Public Records
- 2005-05-20 Listing Removed — MLSRV
- 2005-04-01 Listed $44,500 MLSRV
Property tax history
+11.8%/yrLatest (2025): $1,072 · +10.7% YoY. Source: county tax records.
Cash-flow waterfall
monthlySold comps — $/sqft
last 12 mo · ≤1 miLoading sold comps…