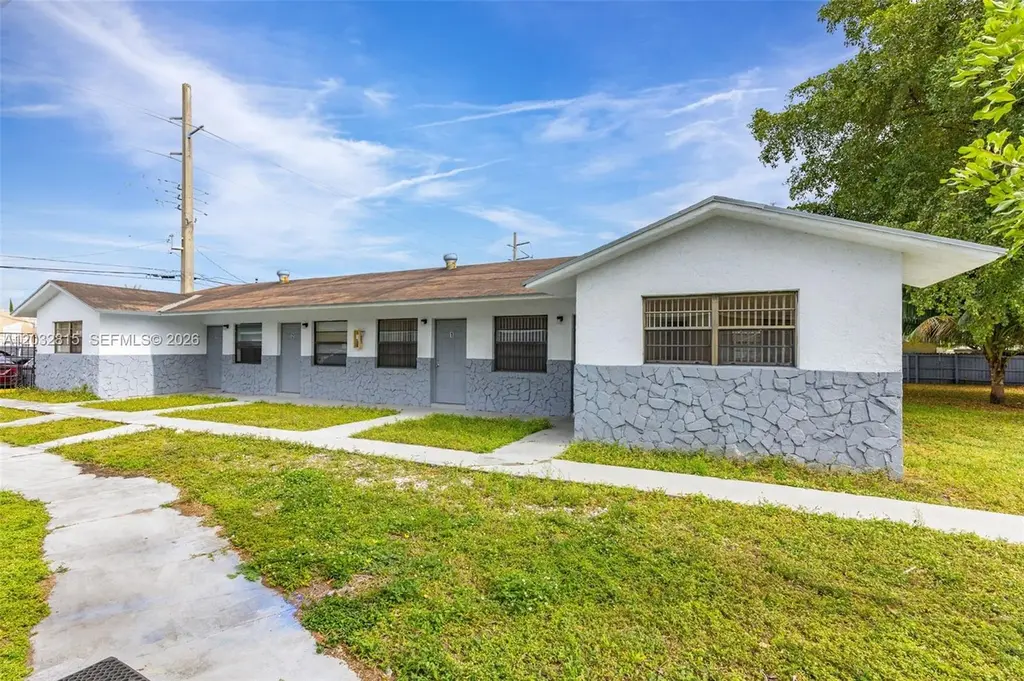
 Duplex
4120 SW 19th St · West Park, FL
Flood risk 1/10 · Minimal
- FEMA flood zone
- X (unshaded)
- Chance of flooding over 30 yrs
- 0.0%
- Est. flood insurance / yr
- $507 – $1,088
Fire risk 1/10 · Minimal
- Est. fire insurance / yr
- $947 – $1,759
Heat risk 10/10 · Severe
- Hot days now (above 105°F)
- 7 days/yr
- Hot days in 30 yrs
- 27 days/yr
Wind risk 10/10 · Severe
- Chance of severe wind over 30 yrs
- 99.0%
Air-quality risk 2/10 · Minimal
- Unhealthy air days now
- 2 days/yr
- Unhealthy air days in 30 yrs
- 2 days/yr
Risk factors via First Street. Map © Google.
Why this score? — see what drove the C- grade
The composite is a weighted blend of 9 inputs, each scored 0–100. Each bar is that input's sub-score; the figure is the points it added to the 100-point composite (weight × sub-score).
- Cash flow +18.4/30.0
- ARV discount +10.5/15.0
- DSCR +5.8/10.0
- 1% rule +4.9/10.0
- Schools +4.1/10.0
- Livability +3.7/5.0
- Rent growth +2.6/5.0
- Condition / age +2.2/5.0
- Appreciation +0.0/10.0
$599,999
🖨 Deal sheet (PDF) 📄 Offer letter ✓ Due diligence
Multi-family units
County records classify this as Multi-Family (2-4 Unit). Listing-text estimate: 2 units. confirmed
Listing remarks MLS
Beautiful Duplex, Freshly painted. Both Units are leased annually Only access with an accepted offer * * * *
Key facts
- Tenant occupied
- Cash flow
- Roof from 2012
Tags
Property features AI
Finance
- Financial info: Property contains multiple rental units (3 units total: two 3-bed/2-bath units and one 3-bed/2-bath unit); Reported actual rents: $2,600 and $2,500 for listed units; Units shown as leased
Exterior
- Parking: Total of 4 parking spaces; Parking spaces associated with units
- Utilities: Public sewer; Cable not available
- Home design: Single-story property; Resale
- Construction: Block construction; Shingle roof
- Exterior features: Less than quarter acre lot
Interior
- Kitchen: Range; Microwave; Refrigerator; Dishwasher (listed in unit description)
- Bedrooms: Two units with 3 bedrooms each
- Flooring: Tile
- Bathrooms: Two full bathrooms in each unit
- Heating & cooling: Central heating; Central air
- Interior features: Tile flooring; Central air conditioning; Central heating
- Laundry & utility: Washer (in at least one unit); Dryer (in at least one unit)
Neighborhood map
What this means for you Summary
Snapshot
- This is a 2 × 3-bed/2.0-bath units multifamily listed at $600k. Condition is rated fair.
Deal economics
- At list price, monthly cash flow is $564 ($7k/yr) — positive. Per door: $282/mo.
- The deal already cash-flows at list — no discount required.
- To meet the 1% rule (rent ≥ 1% of price), the offer needs to be $596k (0.6% below list).
- Recommended offer: $596k (0.6% below list) — sets the bar for 1% rule.
Location & tenants
- Location reads 74/100 on livability (#280 in FL, #4,501 nationally) — a middle-class / working-renter tenant base. Strengths: housing A+, health & safety A+, cost of living A; Watch: employment D+, amenities F.
- Broward (suburban): math 42% / reading 53% proficiency, ranked #46 of 73 in FL (top 63%) — families likely to look elsewhere, expect single-tenant / working-renter base with shorter leases.
- Zoned schools: Nova Blanche Forman Elementary (math 35% / reading 55%, grade D-, #1,271 of 2,144 statewide, top 60%, 769 students, 72% FRL); Nova Middle School (math 44% / reading 53%, grade C-, #274 of 571 statewide, top 50%, 1,284 students, 68% FRL); Nova High School (math 22% / reading 56%, grade F, #312 of 667 statewide, top 48%, 2,227 students, 59% FRL) — zoned schools average 66% FRL vs 51% district-wide (15 pts higher); higher-poverty schools than district average — tighter screening recommended.
- Market conditions: Rents flat; 287 active listings in the ZIP; 2,111 units permitted in Broward County in 2024 (1,265 in 5+ unit buildings).
- At $5,962/mo this rent would consume 96% of the median local household income ($75k/yr) (locally 2567% of renters already pay >50% of income on rent) — very limited rent-growth headroom before tenants either downsize or default.
Forward outlook
- Local home prices are declining (-3.0%/yr); year-one equity from $4k of loan paydown is wiped out by about $18k of value loss. Plan a longer hold.
- Broward County population projected at +34% by 2050 — long-run rental-demand tailwind backs the buy-and-hold thesis.
Negotiation context
- Only 13 days on market — expect competitive offers; lowballing is unlikely to land.
- 3 sale attempts since 12y ago; this cycle's ask has dropped $100k (14%) from the opening price — seller is motivated, your offer sets the floor, not the list.
- Current owner paid $500k; 20% above their basis — modest negotiation headroom, anchor on the comps not their cost.
Risks & watch-outs
- Climate carrying-cost: severe wind risk, 99% chance of damaging wind over 30y; extreme-heat days projected 7→27/yr by 2055 (HVAC capex compounding) — expect insurance premiums to compound above CPI over the hold.
Questions for the listing agent
- Can we see the unit-by-unit rent roll, current vacancy, and any below-market leases? What's the average tenancy length?
- What capital expenditures (roof, boiler, parking lot, exteriors) have been made in the last 5 years, and what's planned in the next 2?
- Have any recent inspections been done? Can we get a copy of the seller's disclosures and any deferred-maintenance estimates?
- Is there a deadline driving the sale (1031 exchange, divorce, estate, relocation)? That informs how much negotiation room exists.
- Schools are B-rated — typically a magnet for longer-tenancy family renters. What's the average tenant stay here, and is there a school-zone premium baked into asking?
- What's the average days-on-market for RENTAL listings here right now (not sales)? A rising rental-DOM trend means longer vacancies and softer asking-rent achievability than the comps imply.
- What's the recent tenant-quality profile in this submarket — average credit score on applications, eviction rate, late-payment / NSF rate, and stable-employment percentage? A property-management company in the area should have these aggregated.
- How much new apartment / multifamily construction is in the pipeline within 1–3 miles? Heavy new supply (>2% of stock underway) typically softens rents 12–24 months out; light construction supports rent growth.
Investment metrics
- 1% rule
- 0.99% ✗
- Cap rate
- 7.42%
- Cash-on-cash
- 4.03%
- DSCR
- 1.18
- GRM
- 8.4
CMA / ARV
- ARV (on-the-fly)
- $643,500
- Comps found
- 1
Show comp detail 1 sale within ~0.75 mi
| Address | Dist | Beds/Ba | Sqft | Sold | Price | $/sf | Match |
|---|---|---|---|---|---|---|---|
| 4100 SW 19th St | 0.01mi | 9/6.0 (+1) | 2,342 (+4%) | 24mo | $669,000 | $286 | 68 |
Match score weights: distance 35% · size 25% · config 20% · recency 20%. Top-matched comps best support the ARV.
Projected returns pro-forma
-3.0% appreciation · 0.34% rent growth · sell at horizon
- IRR
- -13.0%
- Equity multiple
- 0.54×
- Total profit
- $-76,789
- Equity at exit
- $89,462
- IRR
- -8.8%
- Equity multiple
- 0.52×
- Total profit
- $-80,762
- Equity at exit
- $51,877
Cash invested: $168,000 (down + closing). Projections, not guarantees.
Landlord ↔ Tenant lean methodology
- Overall (STATE)
- 87 Strongly Landlord-Friendly
- State Florida
- 87 Strongly Landlord-Friendly · R+3
- County
- — inherits STATE
- City
- — inherits STATE
ZIP-level market 33023
- Rents YoY
- 0.3%
- Active inventory
- 287
- Price-to-rent
- 16.8×
Monthly cashflow live
- Estimated rent
- $5,962 high interval (Pro) →
- Mortgage (P&I)
- −$3,146
- Tax est. 1.5%
- −$750 /mo · $9,000/yr
- Insurance
- −$250
- HOA
- −$0
- Vacancy / Maint / Mgmt
- −$1,252
- Net cashflow
- $564
Break-even live
Sensitivity live
| Price | -10% $978 | -5% $771 | +0% $564 | +5% $356 | +10% $149 |
|---|---|---|---|---|---|
| Rent | -10% $93 | -5% $328 | +0% $564 | +5% $799 | +10% $1,035 |
| Rate | -1.0pp $866 | -0.5pp $716 | base $564 | +0.5pp $408 | +1.0pp $250 |
2-unit breakdown (identical units grouped — click to expand)
| Units | Beds | Baths | Est. rent |
|---|---|---|---|
| 2× units | 3 | 2 | $5,962 |
| #1 | 3 | 2 | $2,981 |
| #2 | 3 | 2 | $2,981 |
| Total (2 units) | $5,962 | ||
UW: 25.0% down · 7.5% · 30yr · 1.5% tax · 5.0% vac · 8.0% maint · 8.0% mgmt
Financing live
Cash to close
- Down payment
- $150,000
- Closing costs
- $18,000
- Reserves months
- —
- Total cash needed
- —
Loan-product check · same deal, 3 products live
Conventional
25% down · 7.5% · 30yr
- Down + closing
- —
- Monthly P&I
- —
- Monthly cashflow
- —
- DSCR
- —
- Eligible?
- —
Personal DTI + credit; lowest rate.
DSCR
20% down · 8.5% · 30yr
- Down + closing
- —
- Monthly P&I
- —
- Monthly cashflow
- —
- DSCR
- —
- Eligible?
- —
No personal income docs; deal must DSCR.
Hard money
10% down · 12.0% · 12mo
- Down + closing
- —
- Monthly P&I
- —
- Monthly cashflow
- —
- DSCR
- —
- Eligible?
- —
Short-term bridge; refi at stabilization.
Listing history 24 events
-
2026-06-21days on market $599,999 Active 13 DOM
-
2026-06-18days on market $599,999 Active 10 DOM
-
2026-06-17pricedays on market $599,999 Active 9 DOM
-
2026-06-16days on market $600,000 Active 8 DOM
-
2026-06-15days on market $600,000 Active 7 DOM
-
2026-06-13days on market $600,000 Active 5 DOM
-
2026-06-08remarks 695-char remark
-
2026-06-08pricedays on market $600,000 Active 1 DOM
-
2026-06-04days on market $620,000 Active 142 DOM
-
2026-06-03days on market $620,000 Active 141 DOM
-
2026-06-02days on market $620,000 Active 140 DOM
-
2026-06-01days on market $620,000 Active 139 DOM
-
2026-05-31days on market $620,000 Active 138 DOM
-
2026-04-27price $620,000
-
2026-04-15price $640,000
-
2026-02-04price $660,000
-
2026-01-13$700,000 Active
-
2022-06-03soldstatus $500,000 Closed 114-char remark
Show marketing remark (114 chars)
Beautiful Duplex, Freshly painted. Both Units are leased annually Only access with an accepted offer * * * *
-
2022-05-04status Pending 114-char remark
Show marketing remark (114 chars)
Beautiful Duplex, Freshly painted. Both Units are leased annually Only access with an accepted offer * * * *
-
2022-04-13$500,000 Active 114-char remark
Show marketing remark (114 chars)
Beautiful Duplex, Freshly painted. Both Units are leased annually Only access with an accepted offer * * * *
-
2014-07-13soldstatus $164,000 Sold 369-char remark
Show marketing remark (369 chars)
INVESTORS DREAM! GREAT INCOME PRODUCING PROPERTIES - 3 SIDE BY SIDE BUILDINGS FOR SALE (PRICED SEPERATELY BUT SOLD TOGETHER ONLY, SEE ML# A1942174, A1942038 ). 8 UNITS TOTAL, OVER $7300 GROSS MONTHLY INCOME, TENANTS ALL SCREENED. PROPERTIES FENCED FOR PR IVACY AND SECURITY. NEW ROOF IN 07. PLEASE DRIVE BY ONLY FIRST. DO NOT DISTURB TENANTS, CALL L/A FOR APPOINTMENT.
-
2014-05-21status Pending 369-char remark
Show marketing remark (369 chars)
INVESTORS DREAM! GREAT INCOME PRODUCING PROPERTIES - 3 SIDE BY SIDE BUILDINGS FOR SALE (PRICED SEPERATELY BUT SOLD TOGETHER ONLY, SEE ML# A1942174, A1942038 ). 8 UNITS TOTAL, OVER $7300 GROSS MONTHLY INCOME, TENANTS ALL SCREENED. PROPERTIES FENCED FOR PR IVACY AND SECURITY. NEW ROOF IN 07. PLEASE DRIVE BY ONLY FIRST. DO NOT DISTURB TENANTS, CALL L/A FOR APPOINTMENT.
-
2014-04-28$199,000 Active 369-char remark
Show marketing remark (369 chars)
INVESTORS DREAM! GREAT INCOME PRODUCING PROPERTIES - 3 SIDE BY SIDE BUILDINGS FOR SALE (PRICED SEPERATELY BUT SOLD TOGETHER ONLY, SEE ML# A1942174, A1942038 ). 8 UNITS TOTAL, OVER $7300 GROSS MONTHLY INCOME, TENANTS ALL SCREENED. PROPERTIES FENCED FOR PR IVACY AND SECURITY. NEW ROOF IN 07. PLEASE DRIVE BY ONLY FIRST. DO NOT DISTURB TENANTS, CALL L/A FOR APPOINTMENT.
-
2011-06-03soldstatus $115,000
ⓘ Source: listings_history table (triggers on properties + properties_extension) + one-shot
backfill from property_details.listing_events for pre-trigger history.
Climate risk First Street
- Flood 1/10 Low FEMA zone X (unshaded) · 0% chance over 30 yrs
- Wildfire 1/10 Low
- Heat 10/10 Extreme 7 d/yr ≥105°F today · 27 d/yr by 30 yrs out
- Wind 10/10 Extreme 99% chance of damaging wind over 30 yrs
- Air quality 2/10 Low 2 unhealthy d/yr today · 2 by 30 yrs out
Nearby sold comps map
Loading sold comps map…
Walkable amenities ~0.75 mi
Loading nearby amenities…
Taxation est. · year 1
- Rental income
- $71,544
- − Mortgage interest
- −$33,609
- − Property taxes
- −$9,000
- − Insurance
- −$3,000
- − Repairs & maintenance
- −$5,724
- − Management
- −$5,724
- − Depreciation
- −$17,455
- Taxable loss
- −$2,967
- Est. tax savings @ 24.0%
- +$712
- After-tax cash flow
- $7,474/yr
For passive investors: Depreciation is non-cash, so a rental often shows a tax loss while cash-flowing — sheltering income. Rental losses are passive: they offset passive income freely, and up to $25,000/yr can offset ordinary (W-2) income if you actively participate and your MAGI is under $100k (phasing out to $0 by $150k); unused losses carry forward. On sale, claimed depreciation is recaptured at up to 25%, and gains may owe capital-gains tax (a 1031 exchange can defer both). Figures are a year-1 estimate at your 24.0% rate — not tax advice; consult a CPA.
Condition & rehab AI · 13 photos
This multi-family property offers two units with average condition, requiring moderate repairs and updates to enhance its resale and rental value.
Repairs flagged
- Minor kitchen cabinets — dated and could be updated
- Minor bathroom fixtures — standard and could be upgraded
- Moderate exterior paint — faded and could be refreshed
- Minor landscaping — some overgrown areas
Value-add opportunities
- Both update kitchen cabinets — enhances both resale and rental appeal
- Both update bathroom fixtures — enhances both resale and rental appeal
- Both refresh exterior paint — enhances both resale and rental appeal
Renovation cost estimate screening
| Repair item | Severity | Est. cost |
|---|---|---|
| kitchen cabinets · dated and could be updated | Minor | $500–3,000 |
| bathroom fixtures · standard and could be upgraded | Minor | $500–3,000 |
| exterior paint · faded and could be refreshed | Moderate | $3,000–15,000 |
| landscaping · some overgrown areas | Minor | $500–3,000 |
| Total estimated repair cost · 4 items | $4,500–24,000 |
Value-add ROI direction
- Both update kitchen cabinets — enhances both resale and rental appeal ↑
- Both update bathroom fixtures — enhances both resale and rental appeal ↑
- Both refresh exterior paint — enhances both resale and rental appeal ↑
ⓘ Cost ranges are severity-bucket heuristics (US national rule-of-thumb). Get contractor quotes + a written scope before underwriting a rehab budget.
Schools (NCES district)
- District
- Broward
- NCES district ID
- 1200180
- Math proficiency
- 42% ▼ -18.00%
- Reading proficiency
- 53% ▼ -5.00%
- Median HH income
- $52,139
- Composite
- 40.88/100
- National rank
- #3621
- State rank
- #46 of 73 in FL
Livability — West Park
- Score
- 74/100
- State rank
- #280
- US rank
- #4501
Category grades
Schools grade is shown separately in the Schools card above.
Census & demographics
- Census place
- West Park, FL
- County
- Broward County · 1,963,430 people
- Metro
- Miami-Fort Lauderdale-Pompano Beach, FL
- Population (ZIP)
- 72,344
- Household income
- $74,709
- Rent vs Own
- Severe rent burden
- 2567.0
Population outlook (Broward County) Hauer SSP2
- Today (2025)
- 2,207,033 people
- By 2030
- 2,360,704 · +7.0%
- By 2040
- 2,661,208 · +20.6%
- By 2050
- 2,946,698 · +33.5%
- By 2075
- 3,602,273 · +63.2%
- By 2100
- 3,970,984 · +79.9%
Race, ethnicity, and origin ACS 2023
- Neighborhood character
- Diverse neighborhood (Simpson 0.60)
- Race & ethnicity
- Black 51% Hispanic / Latino 37% Two or more races 19% White 8% Asian 2%
- Hispanic origin (detail)
- Mexican 2% Puerto Rican 5% Cuban 9% Dominican 6%
- Common ancestry
- Hispanic 14%
- Foreign-born
- 44% · Canada, Jamaica, Dominican Republic
- Languages at home
- 50% English-only · Spanish 32% French/Haitian/Cajun 13% Other Indo-European 1%
Political lean MEDSL · Broward
- 2024 margin
- D (+17.0) · D 58.0% · R 41.0%
- 2008→2024 swing
- -17.8pp toward R · 2008: 34.7pp · 2024: 17.0pp
- All cycles
- 2024: D+17.0 2020: D+29.8 2016: D+35.0 2012: D+34.9 2008: D+34.7
Not yet ingested
- Civics
- —
Market trends
- HPI YoY
- ▼ -442.33%
- Current HPI
- 534.7664
- Rent YoY
- ▲ 0.34%
- Metro
- Miami-Fort Lauderdale-Pompano Beach, FL
- State GDP YoY
- ▲ 3.28%
- F500 in state
- 36
Industry mix (Fortune 500 HQ in FL)
| Industry | F500 HQs | Revenue |
|---|---|---|
| Industrial Technology | 2 | $29B |
|
||
| Insurance | 2 | $17B |
|
||
| Retail | 1 | $60B |
|
||
| Technology Distribution | 1 | $58B |
|
||
| Homebuilding | 1 | $35B |
|
||
| Technology Manufacturing | 1 | $35B |
|
||
Price history
+439.1% since first listed11 events — show timeline
- 2026-04-27 Price Changed $620,000 MARMLS
- 2026-04-15 Price Changed $640,000 MARMLS
- 2026-02-04 Price Changed $660,000 MARMLS
- 2026-01-13 Listed $700,000 MARMLS
- 2022-06-03 Sold (MLS) $500,000 MARMLS
- 2022-05-04 Pending — MARMLS
- 2022-04-13 Listed $500,000 MARMLS
- 2014-07-13 Sold (MLS) $164,000 MARMLS
- 2014-05-21 Pending — MARMLS
- 2014-04-28 Listed $199,000 MARMLS
- 2011-06-03 Sold (MLS) $115,000 MARMLS
Cash-flow waterfall
monthlySold comps — $/sqft
last 12 mo · ≤1 miLoading sold comps…