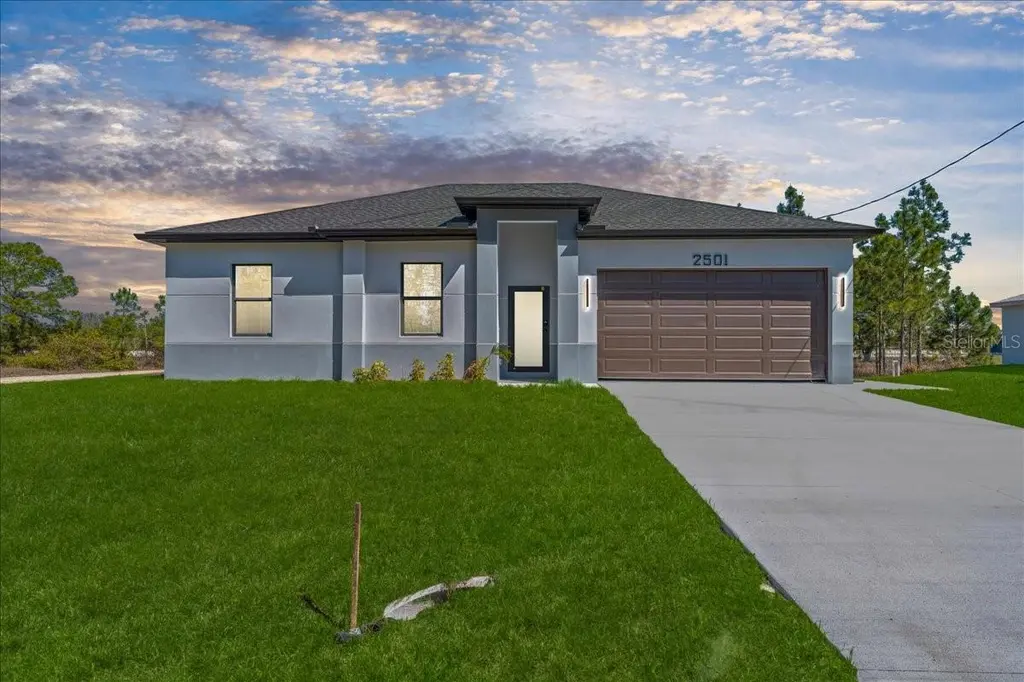
2501 E 15th St · Lehigh Acres, FL
Flood risk 4/10 · Minor
- FEMA flood zone
- AE
- Chance of flooding over 30 yrs
- 0.21%
- Est. flood insurance / yr
- $1,737 – $8,500
Fire risk 3/10 · Minor
- Est. fire insurance / yr
- $947 – $1,759
Heat risk 10/10 · Severe
- Hot days now (above 108°F)
- 7 days/yr
- Hot days in 30 yrs
- 28 days/yr
Wind risk 10/10 · Severe
- Chance of severe wind over 30 yrs
- 99.0%
Air-quality risk 2/10 · Minimal
- Unhealthy air days now
- 2 days/yr
- Unhealthy air days in 30 yrs
- 2 days/yr
Risk factors via First Street. Map © Google.
Why this score? — see what drove the F grade
The composite is a weighted blend of 9 inputs, each scored 0–100. Each bar is that input's sub-score; the figure is the points it added to the 100-point composite (weight × sub-score).
- ARV discount +7.5/15.0
- Cash flow +7.1/30.0
- Schools +4.1/10.0
- Rent growth +3.8/5.0
- Livability +3.0/5.0
- Condition / age +2.5/5.0
- 1% rule +2.0/10.0
- DSCR +1.3/10.0
- Appreciation +0.0/10.0
$279,900
🖨 Deal sheet (PDF) 📄 Offer letter ✓ Due diligence
Listing remarks MLS
One or more photo(s) has been virtually staged. One or more photo(s) has been virtually staged, AI generated or rendered. Beautiful new construction home in Lehigh Acres featuring 3 bedrooms and 2 bathrooms with a modern open floor plan and quality finishes throughout. The home offers a bright living area, spacious bedrooms, and a contemporary kitchen designed for comfortable living. Conveniently located near schools, shopping, and major roads, making commuting easy. No HOA. Perfect opportunity for first-time buyers, families, or investors.
Key facts
- 2 garage spots
- Built 2026
- Listed 81 days
Property features AI
Finance
- Financial info: No pet restrictions
Exterior
- Parking: Attached 2-car garage; Driveway
- Utilities: Well water; Septic tank; Cable available
- Home design: Single-story; New construction
- Construction: Block construction; Shingle roof
- Exterior features: Less than quarter acre lot; No notable exterior features listed; South-facing
Interior
- Kitchen: Dishwasher; Electric range; Microwave; Refrigerator
- Flooring: Tile flooring
- Bathrooms: 2 full bathrooms
- Heating & cooling: Central heating; Central air conditioning
- Interior features: Bedroom on main level; Walk-in closet(s)
Neighborhood map
What this means for you Summary
Snapshot
- This is a 3-bed/2.0-bath land listed at $280k.
Deal economics
- At list price, monthly cash flow is $-820 ($-10k/yr) — negative.
- To cash-flow at today's rent, offer at most $161k (42.4% below list).
- To meet the 1% rule (rent ≥ 1% of price), the offer needs to be $195k (30.3% below list).
- Recommended offer: $161k (42.4% below list) — sets the bar for cash-flow.
Location & tenants
- Location reads 59/100 on livability (#826 in FL) — a working-class tenant base; expect higher turnover. Strengths: cost of living A+, housing A+; Watch: crime C-, employment D+, amenities F.
- Lee (suburban): math 47% / reading 50% proficiency, ranked #42 of 73 in FL (top 58%) — families likely to look elsewhere, expect single-tenant / working-renter base with shorter leases.
- Zoned schools: Veterans Park Academy For The Arts (math 41% / reading 45%, grade F, #1,366 of 2,144 statewide, top 64%, 2,133 students, 36% FRL); Oak Hammock Middle School (math 43% / reading 41%, grade D-, #340 of 571 statewide, top 61%, 1,563 students, 56% FRL); Lehigh Senior High School (math 23% / reading 45%, grade F, #394 of 667 statewide, top 60%, 2,476 students, 57% FRL).
- Market conditions: Rents rising fast (+5.3%/yr); 1620 active listings in the ZIP; 7 comparable units currently listed for rent nearby; rentals at typical pace (median 26d on market — plan ~3-4 weeks tenant-placement turnaround); 15,411 units permitted in Lee County in 2024 (4,686 in 5+ unit buildings).
- This rent runs 32% of the median local income ($74k/yr) — at the standard rent-burdened threshold; future hikes will face affordability resistance.
Forward outlook
- Local home prices are declining (-3.0%/yr); year-one equity from $2k of loan paydown is wiped out by about $8k of value loss. Plan a longer hold.
- Lee County population projected at +44% by 2050 — long-run rental-demand tailwind backs the buy-and-hold thesis.
Negotiation context
- It's been on market 81 days — a 6% lower offer ($263k) is reasonable based on typical stale-listing flexibility.
- 6 sale attempts since 21y ago with the ask held roughly flat each time — persistent listings suggest the price (not the market) is what's stuck; bring a comps-based counter.
- Current owner paid $27k; list at $280k implies a 937% gain — meaningful room to come down on a strong offer.
Risks & watch-outs
- Watch-outs: flood insurance adds $427/mo.
- Climate carrying-cost: in FEMA flood zone AE (mandatory federal flood insurance); severe wind risk, 99% chance of damaging wind over 30y; extreme-heat days projected 7→28/yr by 2055 (HVAC capex compounding) — expect insurance premiums to compound above CPI over the hold.
Questions for the listing agent
- What do current leases actually rent for vs. the listed asking? Can we see a recent rent roll and the last 12 months of T-12 income?
- It's been on market 81 days. Have you received any prior offers? Is the seller open to a 42% concession, seller financing, or rate buy-down credit?
- What's the actual annual flood-insurance premium (NFIP or private), and is the property in a SFHA with mandatory coverage?
- Why hasn't it sold? Are there any deal-killer items the seller is aware of (foundation, flood, title, zoning, code violations)?
- Is there a deadline driving the sale (1031 exchange, divorce, estate, relocation)? That informs how much negotiation room exists.
- Schools are D-rated, which usually means shorter tenancies and higher turnover. Who's the typical renter profile here, and what's been the actual vacancy rate?
- The area grade is low — what's the realistic commute time and amenity access for the typical tenant pool here? Any planned neighborhood developments (good or bad) we should know about?
- What's the average days-on-market for RENTAL listings here right now (not sales)? A rising rental-DOM trend means longer vacancies and softer asking-rent achievability than the comps imply.
- What's the recent tenant-quality profile in this submarket — average credit score on applications, eviction rate, late-payment / NSF rate, and stable-employment percentage? A property-management company in the area should have these aggregated.
- How much new for-sale + rental construction is in the pipeline within 1–3 miles? Heavy new supply typically softens prices + rents 12–24 months out; constrained supply supports both.
Investment metrics
- 1% rule
- 0.70% ✗
- Cap rate
- 4.61%
- Cash-on-cash
- -6.02%
- DSCR
- 0.73
- GRM
- 12.0
CMA / ARV
No comps found within radius.
Projected returns pro-forma
-3.0% appreciation · 5.33% rent growth · sell at horizon
- IRR
- -36.1%
- Equity multiple
- -0.18×
- Total profit
- $-92,600
- Equity at exit
- $41,734
- IRR
- -32.8%
- Equity multiple
- -0.61×
- Total profit
- $-126,546
- Equity at exit
- $24,201
Cash invested: $78,372 (down + closing). Projections, not guarantees.
Landlord ↔ Tenant lean methodology
- Overall (STATE)
- 87 Strongly Landlord-Friendly
- State Florida
- 87 Strongly Landlord-Friendly · R+3
- County
- — inherits STATE
- City
- — inherits STATE
ZIP-level market 33972
- Home prices YoY
- -13.6%
- Rents YoY
- 5.3%
- Active inventory
- 1620
- Price-to-rent
- 12.0×
Monthly cashflow live
- Estimated rent
- $1,951 high interval (Pro) →
- Mortgage (P&I)
- −$1,468
- Tax est. 1.5%
- −$350 /mo · $4,198/yr
- Insurance
- −$117
- Flood insurance flood zone
- −$427 /mo · $5,118/yr
- HOA
- −$0
- Vacancy / Maint / Mgmt
- −$410
- Net cashflow
- $-820
Break-even live
Sensitivity live
| Price | -10% $-626 | -5% $-723 | +0% $-820 | +5% $-917 | +10% $-1,013 |
|---|---|---|---|---|---|
| Rent | -10% $-974 | -5% $-897 | +0% $-820 | +5% $-743 | +10% $-666 |
| Rate | -1.0pp $-679 | -0.5pp $-749 | base $-820 | +0.5pp $-892 | +1.0pp $-966 |
UW: 25.0% down · 7.5% · 30yr · 1.5% tax · 5.0% vac · 8.0% maint · 8.0% mgmt
Financing live
Cash to close
- Down payment
- $69,975
- Closing costs
- $8,397
- Reserves months
- —
- Total cash needed
- —
Loan-product check · same deal, 3 products live
Conventional
25% down · 7.5% · 30yr
- Down + closing
- —
- Monthly P&I
- —
- Monthly cashflow
- —
- DSCR
- —
- Eligible?
- —
Personal DTI + credit; lowest rate.
DSCR
20% down · 8.5% · 30yr
- Down + closing
- —
- Monthly P&I
- —
- Monthly cashflow
- —
- DSCR
- —
- Eligible?
- —
No personal income docs; deal must DSCR.
Hard money
10% down · 12.0% · 12mo
- Down + closing
- —
- Monthly P&I
- —
- Monthly cashflow
- —
- DSCR
- —
- Eligible?
- —
Short-term bridge; refi at stabilization.
Rent comps 7 comps
| Address | Beds | Baths | Sqft | Rent | $/sqft | DOM | Units | Dist |
|---|---|---|---|---|---|---|---|---|
| 1224 Hamilton Ave Lehigh Acres, FL | 3.0 | 2.0 | 1347 | $1,595 | $1.18 | 17d | 1 | 0.67mi |
| 2701 E 18th St Lehigh Acres, FL | 4.0 | 2.0 | 1577 | $2,000 | $1.27 | 25d | 1 | 0.76mi |
| 1943 E 12th St Lehigh Acres, FL | 3.0 | 2.0 | 1600 | $1,850 | $1.16 | 25d | 1 | 0.90mi |
| 1108 Truman Ave Lehigh Acres, FL | 2.0 | 1.0 | 1512 | $1,650 | $1.09 | 5d | 1 | 1.19mi |
| 1221 E 12th St Lehigh Acres, FL | 3.0 | 2.0 | 1217 | $1,550 | $1.27 | 25d | 1 | 1.32mi |
| 134 Viewpoint Dr Lehigh Acres, FL | 2.0 | 2.0 | 1042 | $1,650 | $1.58 | 5d | 1 | 1.48mi |
| 1917 Lorna Ave Lehigh Acres, FL | 2.0 | 2.0 | 1042 | $1,675 | $1.61 | 25d | 1 | 1.49mi |
Listing history 32 events
-
2026-06-22days on market $279,900 Active 81 DOM
-
2026-06-17days on market $279,900 Active 77 DOM
-
2026-06-16days on market $279,900 Active 76 DOM
-
2026-06-15days on market $279,900 Active 75 DOM
-
2026-06-13remarks 469-char remark
-
2026-06-13days on market $279,900 Active 73 DOM
-
2026-06-10days on market $279,900 Active 70 DOM
-
2026-06-09days on market $279,900 Active 69 DOM
-
2026-06-07remarks 412-char remark
-
2026-06-07days on market $279,900 Active 67 DOM
-
2026-06-03days on market $279,900 Active 63 DOM
-
2026-06-02days on market $279,900 Active 62 DOM
-
2026-06-01days on market $279,900 Active 61 DOM
-
2026-06-01days on market $279,900 Active 60 DOM
-
2026-04-01$279,900 Active 546-char remark
Show marketing remark (498 chars)
One or more photo(s) has been virtually staged, AI generated or rendered. Beautiful new construction home in Lehigh Acres featuring 3 bedrooms and 2 bathrooms with a modern open floor plan and quality finishes throughout. The home offers a bright living area, spacious bedrooms, and a contemporary kitchen designed for comfortable living. Conveniently located near schools, shopping, and major roads, making commuting easy. No HOA. Perfect opportunity for first-time buyers, families, or investors.
-
2026-04-01$279,900 Active
Show marketing remark (498 chars)
One or more photo(s) has been virtually staged, AI generated or rendered. Beautiful new construction home in Lehigh Acres featuring 3 bedrooms and 2 bathrooms with a modern open floor plan and quality finishes throughout. The home offers a bright living area, spacious bedrooms, and a contemporary kitchen designed for comfortable living. Conveniently located near schools, shopping, and major roads, making commuting easy. No HOA. Perfect opportunity for first-time buyers, families, or investors.
-
2026-04-01$279,900 Active 498-char remark
Show marketing remark (498 chars)
One or more photo(s) has been virtually staged, AI generated or rendered. Beautiful new construction home in Lehigh Acres featuring 3 bedrooms and 2 bathrooms with a modern open floor plan and quality finishes throughout. The home offers a bright living area, spacious bedrooms, and a contemporary kitchen designed for comfortable living. Conveniently located near schools, shopping, and major roads, making commuting easy. No HOA. Perfect opportunity for first-time buyers, families, or investors.
-
2025-06-27soldstatus $27,000
-
2024-02-09soldstatus $32,953
-
2023-12-04soldstatus $17,000
-
2023-12-01soldstatus $18,000 Closed
-
2023-10-23status Pending
-
2023-09-04status Active
-
2023-08-16status Pending
-
2023-06-18price $18,000
-
2023-06-06price $20,000
-
2023-05-25$25,000 Active
-
2005-09-11historical
-
2005-08-02soldstatus $900,000
-
2005-05-24soldstatus $42,500
-
2005-03-11$33,000
-
2003-12-04soldstatus $14,900
ⓘ Source: listings_history table (triggers on properties + properties_extension) + one-shot
backfill from property_details.listing_events for pre-trigger history.
Climate risk First Street
- Flood 4/10 Moderate FEMA zone AE · 21% chance over 30 yrs
- Wildfire 3/10 Moderate
- Heat 10/10 Extreme 7 d/yr ≥108°F today · 28 d/yr by 30 yrs out
- Wind 10/10 Extreme 99% chance of damaging wind over 30 yrs
- Air quality 2/10 Low 2 unhealthy d/yr today · 2 by 30 yrs out
Nearby sold comps map
Loading sold comps map…
Walkable amenities ~0.75 mi
Loading nearby amenities…
Taxation est. · year 1
- Rental income
- $23,408
- − Mortgage interest
- −$15,679
- − Property taxes
- −$4,198
- − Insurance
- −$6,518
- − Repairs & maintenance
- −$1,873
- − Management
- −$1,873
- − Depreciation
- −$8,143
- Taxable loss
- −$14,875
- Est. tax savings @ 24.0%
- +$3,570
- After-tax cash flow
- $-6,268/yr
For passive investors: Depreciation is non-cash, so a rental often shows a tax loss while cash-flowing — sheltering income. Rental losses are passive: they offset passive income freely, and up to $25,000/yr can offset ordinary (W-2) income if you actively participate and your MAGI is under $100k (phasing out to $0 by $150k); unused losses carry forward. On sale, claimed depreciation is recaptured at up to 25%, and gains may owe capital-gains tax (a 1031 exchange can defer both). Figures are a year-1 estimate at your 24.0% rate — not tax advice; consult a CPA.
Schools (NCES district)
- District
- Lee
- NCES district ID
- 1201080
- Math proficiency
- 47% ▼ -11.00%
- Reading proficiency
- 50% ▼ -4.00%
- Median HH income
- $49,518
- Composite
- 41.49/100
- National rank
- #3458
- State rank
- #42 of 73 in FL
Livability — Lehigh Acres
- Score
- 59/100
- State rank
- #826
- US rank
- #20055
Category grades
Schools grade is shown separately in the Schools card above.
Census & demographics
- Census place
- Lehigh Acres, FL
- County
- Lee County · 788,662 people
- City population
- 130,638
- Metro
- Cape Coral-Fort Myers, FL
- Population (ZIP)
- 17,285
- Household income
- $73,819
- Rent vs Own
- Severe rent burden
- 190.0
Population outlook (Lee County) Hauer SSP2
- Today (2025)
- 871,946 people
- By 2030
- 955,468 · +9.6%
- By 2040
- 1,113,587 · +27.7%
- By 2050
- 1,256,891 · +44.1%
- By 2075
- 1,560,270 · +78.9%
- By 2100
- 1,726,848 · +98.0%
Race, ethnicity, and origin ACS 2023
- Neighborhood character
- Diverse neighborhood (Simpson 0.65)
- Race & ethnicity
- White 44% Hispanic / Latino 38% Two or more races 21% Black 13%
- Hispanic origin (detail)
- Mexican 8% Puerto Rican 7% Cuban 18%
- Common ancestry
- Hispanic 6% Italian 2% Romanian 2%
- Foreign-born
- 27% · Canada, Guatemala
- Languages at home
- 61% English-only · Spanish 32% French/Haitian/Cajun 4% Other Indo-European 1%
Political lean MEDSL · Lee
- 2024 margin
- Strong R (+28.4) · D 35.5% · R 63.9%
- 2008→2024 swing
- -18.0pp toward R · 2008: -10.4pp · 2024: -28.4pp
- All cycles
- 2024: R+28.4 2020: R+19.2 2016: R+20.4 2012: R+16.6 2008: R+10.4
Not yet ingested
- Civics
- —
Market trends
- HPI YoY
- ▼ -53.97%
- Current HPI
- 343.484
- Rent YoY
- ▲ 5.33%
- Metro
- Cape Coral-Fort Myers, FL
- State GDP YoY
- ▲ 3.28%
- F500 in state
- 36
Industry mix (Fortune 500 HQ in FL)
| Industry | F500 HQs | Revenue |
|---|---|---|
| Industrial Technology | 2 | $29B |
|
||
| Insurance | 2 | $17B |
|
||
| Retail | 1 | $60B |
|
||
| Technology Distribution | 1 | $58B |
|
||
| Homebuilding | 1 | $35B |
|
||
| Technology Manufacturing | 1 | $35B |
|
||
Price history
+1778.5% since first listed18 events — show timeline
- 2026-04-01 Listed $279,900 NAPLESMLS
- 2026-04-01 Listed $279,900 MARMLS
- 2026-04-01 Listed $279,900 Stellar MLS as Distributed by MLS Grid
- 2025-06-27 Sold (Public Records) $27,000 Public Records
- 2024-02-09 Sold (Public Records) $32,953 Public Records
- 2023-12-04 Sold (Public Records) $17,000 Public Records
- 2023-12-01 Sold (MLS) $18,000 FORTMLS
- 2023-10-23 Pending — FORTMLS
- 2023-09-04 Relisted — FORTMLS
- 2023-08-16 Pending — FORTMLS
- 2023-06-18 Price Changed $18,000 FORTMLS
- 2023-06-06 Price Changed $20,000 FORTMLS
- 2023-05-25 Listed $25,000 FORTMLS
- 2005-09-11 Listing Removed — FORTMLS
- 2005-08-02 Sold (Public Records) $900,000 Public Records
- 2005-05-24 Sold (Public Records) $42,500 Public Records
- 2005-03-11 Listed $33,000 FORTMLS
- 2003-12-04 Sold (Public Records) $14,900 Public Records
Property tax history
+18.2%/yrLatest (2025): $389 · +11.2% YoY. Source: county tax records.
Cash-flow waterfall
monthlySold comps — $/sqft
last 12 mo · ≤1 miLoading sold comps…