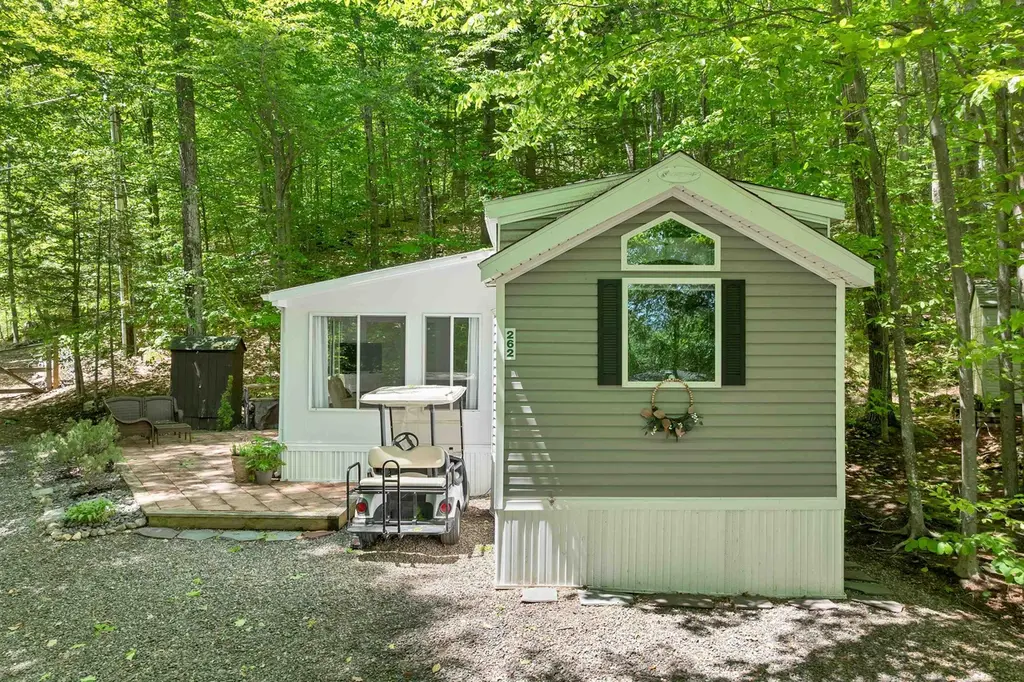
262 High Country Way · Holderness, NH
Flood risk 1/10 · Minimal
- FEMA flood zone
- X (unshaded)
- Chance of flooding over 30 yrs
- 0.0%
- Est. flood insurance / yr
- $507 – $1,088
Fire risk 1/10 · Minimal
- Est. fire insurance / yr
- $507 – $941
Heat risk 2/10 · Minimal
- Hot days now (above 91°F)
- 7 days/yr
- Hot days in 30 yrs
- 16 days/yr
Wind risk 3/10 · Minor
- Chance of severe wind over 30 yrs
- 5.0%
Air-quality risk 2/10 · Minimal
- Unhealthy air days now
- 1 days/yr
- Unhealthy air days in 30 yrs
- 1 days/yr
Risk factors via First Street. Map © Google.
Why this score? — see what drove the D grade
The composite is a weighted blend of 9 inputs, each scored 0–100. Each bar is that input's sub-score; the figure is the points it added to the 100-point composite (weight × sub-score).
- Appreciation +10.0/10.0
- Cash flow +8.4/30.0
- ARV discount +7.5/15.0
- Schools +5.0/10.0
- 1% rule +3.2/10.0
- Rent growth +2.5/5.0
- Livability +2.5/5.0
- Condition / age +2.5/5.0
- DSCR +2.3/10.0
$275,000
🖨 Deal sheet 📄 Offer letter ✓ Due diligence
Listing remarks
Tucked among the trees in one of the Lakes Region’s best-kept secrets, this turn-key retreat offers the kind of lifestyle people dream about but rarely find. Welcome to 262 High Country Way, where mornings begin with coffee in the sunroom surrounded by nature, afternoons are spent poolside, and evenings end relaxing after a day exploring nearby lakes and everything the Lakes Region has to offer. Built in 2019, this thoughtfully designed home offers approximately 648 square feet of efficient yet surprisingly spacious living space with two bedrooms, one and a half bathrooms, central air, forced hot air heat, in-unit washer and dryer, and modern finishes throughout. Warm wood tones, over
Key facts
- Turn-key retreat
- Clubhouse
- Fitness room
Tags
Property features AI
Finance
- Other: Located in Squam Lakes Camp Resort (mobile park); Mobile park approval: Unknown
- HOA & community: Monthly association fee of 305; HOA fee includes cable, sewer, trash and condo association services
Exterior
- Parking: Gravel driveway
- Utilities: Private water; Private sewer; Circuit breaker electrical service; Cable internet available
- Home design: Manufactured/Mobile home; Entry status: Existing; Faces: Not specified
- Construction: Built in 2019; Vinyl siding; Asphalt shingle roof
- Exterior features: Mountain view; Secluded setting; Scenic view; Wooded lot; Privately maintained road frontage; Gravel driveway
Interior
- Flooring: Carpet
- Bathrooms: 1 full bathroom; 1 half bathroom
- Heating & cooling: Natural gas forced air heating
- Interior features: 4 total rooms; Carpet flooring
Neighborhood map
What this means for you Summary
Snapshot
- This is a 1-bed/1.0-bath manufactured listed at $275k.
Deal economics
- At list price, monthly cash flow is $-249 ($-3k/yr) — negative.
- To cash-flow at today's rent, offer at most $231k (16.0% below list).
- To meet the 1% rule (rent ≥ 1% of price), the offer needs to be $224k (18.4% below list).
- Recommended offer: $224k (18.4% below list) — sets the bar for 1% rule.
Location & tenants
- Location reads: area grade D — affects rentability + tenant quality, not the cash-flow math above.
- Pemi-Baker Regional School District (rural): math 45% / reading 70% proficiency, ranked #77 of 171 in NH (top 45%) — acceptable for families but not a draw, mixed tenant base, ~2y average lease.
- Market conditions: 26 active listings in the ZIP; 487 units permitted in Grafton County in 2024 (127 in 5+ unit buildings).
Forward outlook
- In year one you build about $29k of equity ($2k loan paydown + $28k appreciation (10.0% local appreciation)).
- Grafton County population projected at -13% by 2050 — secular population decline; favor cash flow + early exit over multi-decade hold.
- By year 2, paydown + projected appreciation supports a ~$47k cash-out refi (75% LTV) — recoverable capital for the next deal without selling this one.
Negotiation context
- It's been on market 15 days — a 2% lower offer ($271k) is reasonable based on typical stale-listing flexibility.
Questions for the listing agent
- What do current leases actually rent for vs. the listed asking? Can we see a recent rent roll and the last 12 months of T-12 income?
- What does the HOA fee cover, when was the last increase, and are there any pending special assessments or reserve-fund shortfalls?
- Is there a deadline driving the sale (1031 exchange, divorce, estate, relocation)? That informs how much negotiation room exists.
- The area grade is low — what's the realistic commute time and amenity access for the typical tenant pool here? Any planned neighborhood developments (good or bad) we should know about?
- What's the average days-on-market for RENTAL listings here right now (not sales)? A rising rental-DOM trend means longer vacancies and softer asking-rent achievability than the comps imply.
- What's the recent tenant-quality profile in this submarket — average credit score on applications, eviction rate, late-payment / NSF rate, and stable-employment percentage? A property-management company in the area should have these aggregated.
- How much new for-sale + rental construction is in the pipeline within 1–3 miles? Heavy new supply typically softens prices + rents 12–24 months out; constrained supply supports both.
Investment metrics
- 1% rule
- 0.82% ✗
- Cap rate
- 5.21%
- Cash-on-cash
- -3.88%
- DSCR
- 0.83
- GRM
- 10.2
CMA / ARV
No comps found within radius.
Projected returns pro-forma
10.0% appreciation · 3.0% rent growth · sell at horizon
- IRR
- 21.5%
- Equity multiple
- 2.74×
- Total profit
- $134,022
- Equity at exit
- $247,742
- IRR
- 19.4%
- Equity multiple
- 6.29×
- Total profit
- $407,357
- Equity at exit
- $534,265
Cash invested: $77,000 (down + closing). Projections, not guarantees.
Landlord ↔ Tenant lean methodology
- Overall (STATE)
- 56 Moderately Landlord-Leaning
- State New Hampshire
- 56 Moderately Landlord-Leaning · D+1
- County
- — inherits STATE
- City
- — inherits STATE
ZIP-level market 03245
- Active inventory
- 26
- Price-to-rent
- 10.2×
Monthly cashflow live
- Estimated rent
- $2,243 medium interval (Pro) →
- Mortgage (P&I)
- −$1,442
- Tax from tax record
- −$159 /mo · $1,908/yr
- Insurance
- −$115
- HOA
- −$305
- Vacancy / Maint / Mgmt
- −$471
- Net cashflow
- $-249
Break-even live
UW: 25.0% down · 7.5% · 30yr · 1.5% tax · 5.0% vac · 8.0% maint · 8.0% mgmt
Financing live
Cash to close
- Down payment
- $68,750
- Closing costs
- $8,250
- Reserves months
- —
- Total cash needed
- —
Loan-product check · same deal, 3 products live
Conventional
25% down · 7.5% · 30yr
- Down + closing
- —
- Monthly P&I
- —
- Monthly cashflow
- —
- DSCR
- —
- Eligible?
- —
Personal DTI + credit; lowest rate.
DSCR
20% down · 8.5% · 30yr
- Down + closing
- —
- Monthly P&I
- —
- Monthly cashflow
- —
- DSCR
- —
- Eligible?
- —
No personal income docs; deal must DSCR.
Hard money
10% down · 12.0% · 12mo
- Down + closing
- —
- Monthly P&I
- —
- Monthly cashflow
- —
- DSCR
- —
- Eligible?
- —
Short-term bridge; refi at stabilization.
HOA detail
- Monthly dues
- $305 · $3,660/yr
- Likely covers
- pool
Listing history 13 events
-
2026-06-18days on market $275,000 Active 15 DOM
-
2026-06-17days on market $275,000 Active 14 DOM
-
2026-06-16days on market $275,000 Active 13 DOM
-
2026-06-15days on market $275,000 Active 12 DOM
-
2026-06-13days on market $275,000 Active 10 DOM
-
2026-06-12days on market $275,000 Active 9 DOM
-
2026-06-09days on market $275,000 Active 6 DOM
-
2026-06-08days on market $275,000 Active 5 DOM
-
2026-06-07days on market $275,000 Active 4 DOM
-
2026-06-07days on market $275,000 Active 3 DOM
-
2026-06-05days on market $275,000 Active 2 DOM
-
2026-06-04remarks 693-char remark
-
2026-06-04$275,000 Active 1 DOM
ⓘ Source: listings_history table (triggers on properties + properties_extension) + one-shot
backfill from property_details.listing_events for pre-trigger history.
Tax reassessment forecast NH · Partial reset (capped growth)
- Current annual tax
- $1,908 · $159/mo
- Projected year-2 tax
- $3,952 · $329/mo
- Expected delta
- +$2,044/yr (+$170/mo · 107.1%)
ⓘ Screening estimate from a state-policy table — verify with the county assessor before closing.
Climate risk First Street
- Flood 1/10 Low FEMA zone X (unshaded) · 0% chance over 30 yrs
- Wildfire 1/10 Low
- Heat 2/10 Low 7 d/yr ≥91°F today · 16 d/yr by 30 yrs out
- Wind 3/10 Moderate 5% chance of damaging wind over 30 yrs
- Air quality 2/10 Low 1 unhealthy d/yr today · 1 by 30 yrs out
Nearby sold comps map
Loading sold comps map…
Walkable amenities ~0.75 mi
Loading nearby amenities…
Taxation est. · year 1
- Rental income
- $26,912
- − Mortgage interest
- −$15,404
- − Property taxes
- −$1,908
- − Insurance
- −$1,375
- − Repairs & maintenance
- −$2,153
- − Management
- −$2,153
- − HOA
- −$3,660
- − Depreciation
- −$8,000
- Taxable loss
- −$7,741
- Est. tax savings @ 24.0%
- +$1,858
- After-tax cash flow
- $-1,130/yr
For passive investors: Depreciation is non-cash, so a rental often shows a tax loss while cash-flowing — sheltering income. Rental losses are passive: they offset passive income freely, and up to $25,000/yr can offset ordinary (W-2) income if you actively participate and your MAGI is under $100k (phasing out to $0 by $150k); unused losses carry forward. On sale, claimed depreciation is recaptured at up to 25%, and gains may owe capital-gains tax (a 1031 exchange can defer both). Figures are a year-1 estimate at your 24.0% rate — not tax advice; consult a CPA.
Schools (NCES district)
- District
- Pemi-Baker Regional School District
- NCES district ID
- 3399965
- Math proficiency
- 45% ▲ 10.00%
- Reading proficiency
- 70% ▲ 15.00%
- Median HH income
- $42,275
- Composite
- 49.93/100
- National rank
- #4161
- State rank
- #77 of 171 in NH
Livability — Holderness
No livability data for this city. (Only ~50 U.S. cities are tracked.)
Census & demographics
- Population (ZIP)
- 1,927
Population outlook (Grafton County) Hauer SSP2
- Today (2025)
- 88,798 people
- By 2030
- 87,131 · -1.9%
- By 2040
- 82,000 · -7.7%
- By 2050
- 77,064 · -13.2%
- By 2075
- 68,769 · -22.6%
- By 2100
- 61,631 · -30.6%
Race, ethnicity, and origin ACS 2023
- Neighborhood character
- Predominantly White (94%)
- Race & ethnicity
- White 94% Two or more races 5% Hispanic / Latino 4%
- Common ancestry
- Lithuanian 26% Iranian 5% Romanian 3%
- Foreign-born
- 3% · Canada
- Languages at home
- 94% English-only · Spanish 2% German/W. Germanic 2% French/Haitian/Cajun 1%
Political lean MEDSL · Grafton
- 2024 margin
- D (+19.9) · D 59.4% · R 39.4% · Other 1.2%
- 2008→2024 swing
- -7.8pp toward R · 2008: 27.7pp · 2024: 19.9pp
- All cycles
- 2024: D+19.9 2020: D+24.6 2016: D+19.0 2012: D+23.8 2008: D+27.7
Not yet ingested
- Civics
- —
Market trends
- HPI YoY
- ▲ 119.42%
- Current HPI
- 460.2832
- Rent YoY
- —
- Metro
- —
- State GDP YoY
- —
- F500 in state
- 0
Price history
1 event — show timeline
- 2026-06-03 Listed $275,000 PrimeMLS
Property tax history
+13.6%/yrLatest (2025): $1,908 · +8.9% YoY. Source: county tax records.
Cash-flow waterfall
monthlySold comps — $/sqft
last 12 mo · ≤1 miLoading sold comps…