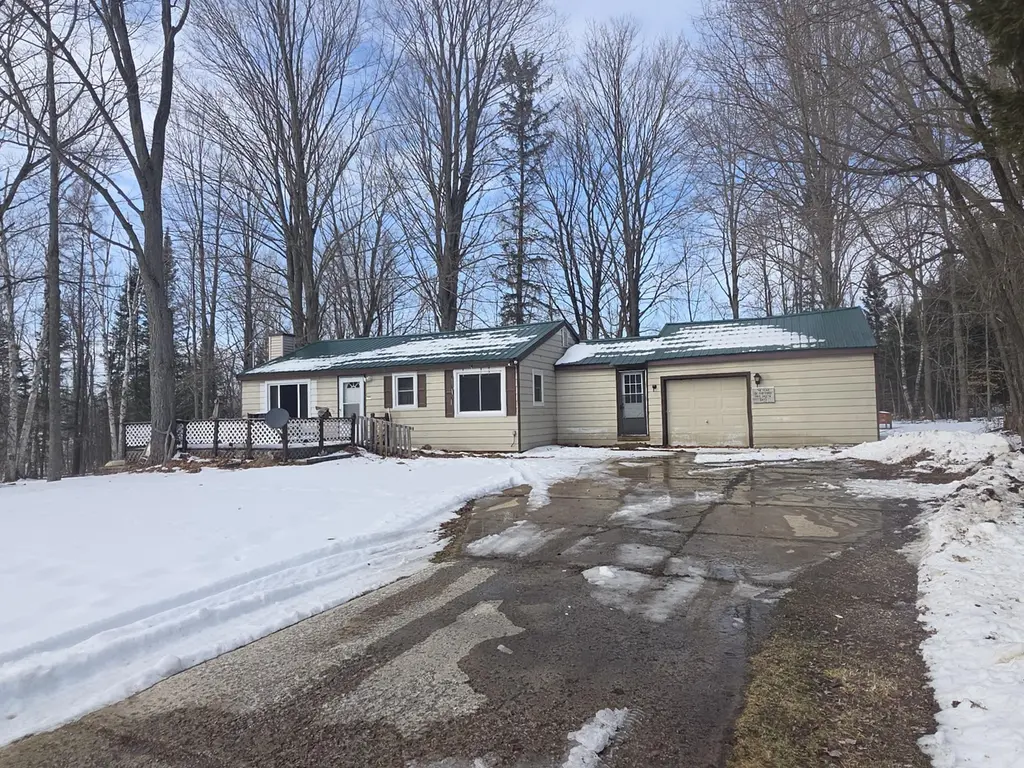
8446 Bamfield Rd · South Branch, MI
Flood risk 1/10 · Minimal
- FEMA flood zone
- X (unshaded)
- Chance of flooding over 30 yrs
- 0.0%
- Est. flood insurance / yr
- $507 – $1,088
Fire risk 5/10 · Moderate
- Est. fire insurance / yr
- $784 – $1,456
Heat risk 1/10 · Minimal
- Hot days now (above 94°F)
- 7 days/yr
- Hot days in 30 yrs
- 13 days/yr
Wind risk 1/10 · Minimal
- Chance of severe wind over 30 yrs
- —
Air-quality risk 2/10 · Minimal
- Unhealthy air days now
- 0 days/yr
- Unhealthy air days in 30 yrs
- 1 days/yr
Risk factors via First Street. Map © Google.
Why this score? — see what drove the B grade
The composite is a weighted blend of 9 inputs, each scored 0–100. Each bar is that input's sub-score; the figure is the points it added to the 100-point composite (weight × sub-score).
- Cash flow +26.2/30.0
- ARV discount +15.0/15.0
- DSCR +8.9/10.0
- 1% rule +5.8/10.0
- Appreciation +5.3/10.0
- Schools +2.9/10.0
- Rent growth +2.5/5.0
- Livability +2.5/5.0
- Condition / age +2.5/5.0
$90,000
🖨 Deal sheet (PDF) 📄 Offer letter ✓ Due diligence
Listing remarks MLS
This country cutie is tucked in amongst some mighty maple trees! Many updates have been done on this 2 bed, one bathroom home. From the roof to the furnace & so much more in between, this home is waiting for someone to add their own finishing touches to make it complete! With a little more luvin', this would be a wonderful full-time home or up-north retreat. Walk through the front door to be greeted by a beautiful fieldstone fireplace that was converted to gas. Nice to warm up by without the mess of dragging wood through the house! There is a 'whatever-you-want' room off the dining area that could be used as a den or office or even for overflow guests. Located near the AuSable River & thousands of acres of the Huron National Forest, there is something for every outdoor enthusiast!
Key facts
- Converted to gas
- Fieldstone fireplace
- Near ausable river
Tags
Neighborhood map
What this means for you Summary
Snapshot
- This is a 2-bed/1.0-bath single-family listed at $90k.
Deal economics
- At list price, monthly cash flow is $230 ($3k/yr) — positive.
- The deal already cash-flows at list — no discount required.
- Meets the 1% rule at list price ($974 rent vs $90k).
- Recommended offer: $82k (9.0% below list) — sets the bar for market timing.
Location & tenants
- Location reads: area grade B — affects rentability + tenant quality, not the cash-flow math above.
- Oscoda Area Schools (rural): math 31% / reading 38% proficiency, ranked #313 of 540 in MI (top 58%) — families likely to look elsewhere, expect single-tenant / working-renter base with shorter leases.
- Market conditions: 22 active listings in the ZIP; 38 units permitted in Alcona County in 2024 (0 in 5+ unit buildings).
Forward outlook
- In year one you build about $1k of equity ($622 loan paydown + $487 appreciation (0.5% local appreciation)).
- Alcona County population projected at -37% by 2050 — secular population decline; favor cash flow + early exit over multi-decade hold.
- At projected returns (0.5% appreciation + 3.0% rent growth), your $25k cash investment doubles in ~6 years — after that, you're playing with house money.
Negotiation context
- It's been on market 103 days — a 9% lower offer ($82k) is reasonable based on typical stale-listing flexibility.
- 7 sale attempts since 12y ago; this cycle's ask has dropped $20k (18%) from the opening price — seller is motivated, your offer sets the floor, not the list.
- Current owner paid $57k; list at $90k implies a 59% gain — meaningful room to come down on a strong offer.
Risks & watch-outs
- Watch-outs: built in 1954 — expect roof / HVAC / electrical / plumbing capex.
- Climate carrying-cost: moderate wildfire risk — expect insurance premiums to compound above CPI over the hold.
Questions for the listing agent
- It's been on market 103 days. Have you received any prior offers? Is the seller open to a 9% concession, seller financing, or rate buy-down credit?
- Built in 1954 — when were the roof, HVAC, electrical panel, plumbing, and water heater last replaced?
- Why hasn't it sold? Are there any deal-killer items the seller is aware of (foundation, flood, title, zoning, code violations)?
- Is there a deadline driving the sale (1031 exchange, divorce, estate, relocation)? That informs how much negotiation room exists.
- What's the average days-on-market for RENTAL listings here right now (not sales)? A rising rental-DOM trend means longer vacancies and softer asking-rent achievability than the comps imply.
- What's the recent tenant-quality profile in this submarket — average credit score on applications, eviction rate, late-payment / NSF rate, and stable-employment percentage? A property-management company in the area should have these aggregated.
- How much new for-sale + rental construction is in the pipeline within 1–3 miles? Heavy new supply typically softens prices + rents 12–24 months out; constrained supply supports both.
Investment metrics
- 1% rule
- 1.08% ✓
- Cap rate
- 9.35%
- Cash-on-cash
- 10.93%
- DSCR
- 1.49
- GRM
- 7.7
CMA / ARV
- ARV (median comp)
- $108,703
- List price
- $90,000
- Delta
- -17.21%
- Verdict
- UNDERPRICED
- Comps
- 12 within 1.0 mi
Show comp detail 4 sales within ~0.75 mi
| Address | Dist | Beds/Ba | Sqft | Sold | Price | $/sf | Match |
|---|---|---|---|---|---|---|---|
| 8105 Bamfield Rd | 0.15mi | 1/1.0 (-1) | 1,176 (+7%) | 10mo | $181,000 | $154 | 68 |
| 3059 Rose St | 0.48mi | 3/1.0 (+1) | 1,060 (-4%) | 3mo | $162,000 | $153 | 64 |
| 3042 Brodie Rd | 0.41mi | 2/1.0 | 1,176 (+7%) | 12mo | $175,000 | $149 | 60 |
| 8331 Wissmiller Rd | 0.70mi | 3/1.0 (+1) | 1,176 (+7%) | 16mo | $245,000 | $208 | 38 |
Match score weights: distance 35% · size 25% · config 20% · recency 20%. Top-matched comps best support the ARV.
Projected returns pro-forma
0.54% appreciation · 3.0% rent growth · sell at horizon
- IRR
- 11.4%
- Equity multiple
- 1.57×
- Total profit
- $14,271
- Equity at exit
- $28,595
- IRR
- 15.6%
- Equity multiple
- 2.81×
- Total profit
- $45,598
- Equity at exit
- $36,405
Cash invested: $25,200 (down + closing). Projections, not guarantees.
Landlord ↔ Tenant lean methodology
- Overall (STATE)
- 62 Landlord-Friendly
- State Michigan
- 62 Landlord-Friendly · EVEN
- County
- — inherits STATE
- City
- — inherits STATE
ZIP-level market 48761
- Home prices YoY
- 0.3%
- Active inventory
- 22
- Price-to-rent
- 7.7×
Monthly cashflow live
- Estimated rent
- $974 medium interval (Pro) →
- Mortgage (P&I)
- −$472
- Tax from tax record
- −$31 /mo · $368/yr
- Insurance
- −$38
- HOA
- −$0
- Vacancy / Maint / Mgmt
- −$205
- Net cashflow
- $230
Break-even live
Sensitivity live
| Price | -10% $281 | -5% $255 | +0% $230 | +5% $204 | +10% $179 |
|---|---|---|---|---|---|
| Rent | -10% $153 | -5% $191 | +0% $230 | +5% $268 | +10% $307 |
| Rate | -1.0pp $275 | -0.5pp $253 | base $230 | +0.5pp $206 | +1.0pp $183 |
UW: 25.0% down · 7.5% · 30yr · 1.5% tax · 5.0% vac · 8.0% maint · 8.0% mgmt
Financing live
Cash to close
- Down payment
- $22,500
- Closing costs
- $2,700
- Reserves months
- —
- Total cash needed
- —
Loan-product check · same deal, 3 products live
Conventional
25% down · 7.5% · 30yr
- Down + closing
- —
- Monthly P&I
- —
- Monthly cashflow
- —
- DSCR
- —
- Eligible?
- —
Personal DTI + credit; lowest rate.
DSCR
20% down · 8.5% · 30yr
- Down + closing
- —
- Monthly P&I
- —
- Monthly cashflow
- —
- DSCR
- —
- Eligible?
- —
No personal income docs; deal must DSCR.
Hard money
10% down · 12.0% · 12mo
- Down + closing
- —
- Monthly P&I
- —
- Monthly cashflow
- —
- DSCR
- —
- Eligible?
- —
Short-term bridge; refi at stabilization.
Listing history 35 events
-
2026-06-16status $90,000 Pending 103 DOM
-
2026-06-15days on market $90,000 Active 103 DOM
-
2026-06-13days on market $90,000 Active 101 DOM
-
2026-06-12days on market $90,000 Active 100 DOM
-
2026-06-09days on market $90,000 Active 97 DOM
-
2026-06-08days on market $90,000 Active 96 DOM
-
2026-06-07days on market $90,000 Active 95 DOM
-
2026-06-07days on market $90,000 Active 94 DOM
-
2026-06-04days on market $90,000 Active 91 DOM
-
2026-06-02days on market $90,000 Active 90 DOM
-
2026-06-01days on market $90,000 Active 89 DOM
-
2026-05-31days on market $90,000 Active 88 DOM
-
2026-05-31days on market $90,000 Active 87 DOM
-
2026-04-13price $90,000 803-char remark
Show marketing remark (803 chars)
This country cutie is tucked in amongst some mighty maple trees! Many updates have been done on this 2 bed, one bathroom home. From the roof to the furnace & so much more in between, this home is waiting for someone to add their own finishing touches to make it complete! With a little more luvin', this would be a wonderful full-time home or up-north retreat. Walk through the front door to be greeted by a beautiful fieldstone fireplace that was converted to gas. Nice to warm up by without the mess of dragging wood through the house! There is a 'whatever-you-want' room off the dining area that could be used as a den or office or even for overflow guests. Located near the AuSable River & thousands of acres of the Huron National Forest, there is something for every outdoor enthusiast!
-
2026-03-02$110,000 Active 803-char remark
Show marketing remark (803 chars)
This country cutie is tucked in amongst some mighty maple trees! Many updates have been done on this 2 bed, one bathroom home. From the roof to the furnace & so much more in between, this home is waiting for someone to add their own finishing touches to make it complete! With a little more luvin', this would be a wonderful full-time home or up-north retreat. Walk through the front door to be greeted by a beautiful fieldstone fireplace that was converted to gas. Nice to warm up by without the mess of dragging wood through the house! There is a 'whatever-you-want' room off the dining area that could be used as a den or office or even for overflow guests. Located near the AuSable River & thousands of acres of the Huron National Forest, there is something for every outdoor enthusiast!
-
2026-02-16historical
-
2026-02-14historical
-
2025-09-20price $120,000
-
2025-09-19price $120,000
-
2025-08-16price $135,000
-
2025-08-15price $135,000
-
2025-06-25price $145,000
-
2025-06-24price $145,000
-
2025-06-03$150,000 Active
-
2025-06-02$150,000 Active
-
2015-12-20historical
-
2015-12-20historical
-
2015-06-20$60,000
-
2015-06-20$60,000
-
2015-05-01historical
-
2015-05-01historical
-
2014-05-08$65,000
-
2014-05-08$65,000
-
2007-11-26soldstatus $56,650
-
2004-10-16soldstatus $55,000
ⓘ Source: listings_history table (triggers on properties + properties_extension) + one-shot
backfill from property_details.listing_events for pre-trigger history.
Tax reassessment forecast MI · Partial reset (capped growth)
- Current annual tax
- $368 · $31/mo
- Projected year-2 tax
- $877 · $73/mo
- Expected delta
- +$509/yr (+$42/mo · 138.1%)
ⓘ Screening estimate from a state-policy table — verify with the county assessor before closing.
Climate risk First Street
- Flood 1/10 Low FEMA zone X (unshaded) · 0% chance over 30 yrs
- Wildfire 5/10 Major
- Heat 1/10 Low 7 d/yr ≥94°F today · 13 d/yr by 30 yrs out
- Wind 1/10 Low
- Air quality 2/10 Low 0 unhealthy d/yr today · 1 by 30 yrs out
Nearby sold comps map
Loading sold comps map…
Walkable amenities ~0.75 mi
Loading nearby amenities…
Taxation est. · year 1
- Rental income
- $11,693
- − Mortgage interest
- −$5,041
- − Property taxes
- −$368
- − Insurance
- −$450
- − Repairs & maintenance
- −$935
- − Management
- −$935
- − Depreciation
- −$2,618
- Taxable income
- $1,344
- Est. tax owed @ 24.0%
- −$323
- After-tax cash flow
- $2,433/yr
For passive investors: Depreciation is non-cash, so a rental often shows a tax loss while cash-flowing — sheltering income. Rental losses are passive: they offset passive income freely, and up to $25,000/yr can offset ordinary (W-2) income if you actively participate and your MAGI is under $100k (phasing out to $0 by $150k); unused losses carry forward. On sale, claimed depreciation is recaptured at up to 25%, and gains may owe capital-gains tax (a 1031 exchange can defer both). Figures are a year-1 estimate at your 24.0% rate — not tax advice; consult a CPA.
Schools (NCES district)
- District
- Oscoda Area Schools
- NCES district ID
- 2626970
- Math proficiency
- 31% ▼ -7.00%
- Reading proficiency
- 38% ▼ -9.00%
- Median HH income
- $36,275
- Composite
- 28.6/100
- National rank
- #6714
- State rank
- #313 of 540 in MI
Livability — South Branch
No livability data for this city. (Only ~50 U.S. cities are tracked.)
Census & demographics
- Population (ZIP)
- 804
Population outlook (Alcona County) Hauer SSP2
- Today (2025)
- 9,071 people
- By 2030
- 8,331 · -8.2%
- By 2040
- 6,852 · -24.5%
- By 2050
- 5,691 · -37.3%
- By 2075
- 4,229 · -53.4%
- By 2100
- 3,149 · -65.3%
Race, ethnicity, and origin ACS 2023
- Neighborhood character
- Predominantly White (97%)
- Race & ethnicity
- White 97% Two or more races 3%
- Common ancestry
- Lithuanian 14% Romanian 13% Slovak 5%
- Foreign-born
- 1% · Canada
- Languages at home
- 98% English-only · Spanish 1%
Political lean MEDSL · Alcona
- 2024 margin
- Solid R (+41.7) · D 28.6% · R 70.3% · Other 1.1%
- 2008→2024 swing
- -33.8pp toward R · 2008: -7.9pp · 2024: -41.7pp
- All cycles
- 2024: R+41.7 2020: R+38.3 2016: R+40.0 2012: R+18.2 2008: R+7.9
Not yet ingested
- Civics
- —
Market trends
- HPI YoY
- ▲ 0.54%
- Current HPI
- 176.0313
- Rent YoY
- —
- Metro
- —
- State GDP YoY
- ▲ 1.37%
- F500 in state
- 28
Industry mix (Fortune 500 HQ in MI)
| Industry | F500 HQs | Revenue |
|---|---|---|
| Automotive Parts | 3 | $48B |
|
||
| Automotive | 2 | $372B |
|
||
| Chemicals | 1 | $45B |
|
||
| Automotive Retail | 1 | $29B |
|
||
| Healthcare / Medical Devices | 1 | $23B |
|
||
| Automotive Technology | 1 | $20B |
|
||
Price history
+63.6% since first listed22 events — show timeline
- 2026-04-13 Price Changed $90,000 WWMLS
- 2026-03-02 Listed $110,000 WWMLS
- 2026-02-16 Listing Removed — MiRealSource-MiMLS
- 2026-02-14 Listing Removed — REALCOMP
- 2025-09-20 Price Changed $120,000 MiRealSource-MiMLS
- 2025-09-19 Price Changed $120,000 REALCOMP
- 2025-08-16 Price Changed $135,000 MiRealSource-MiMLS
- 2025-08-15 Price Changed $135,000 REALCOMP
- 2025-06-25 Price Changed $145,000 MiRealSource-MiMLS
- 2025-06-24 Price Changed $145,000 REALCOMP
- 2025-06-03 Listed $150,000 REALCOMP
- 2025-06-02 Listed $150,000 MiRealSource-MiMLS
- 2015-12-20 Listing Removed — REALCOMP
- 2015-12-20 Listing Removed — MiRealSource-MiMLS
- 2015-06-20 Listed $60,000 REALCOMP
- 2015-06-20 Listed $60,000 MiRealSource-MiMLS
- 2015-05-01 Listing Removed — REALCOMP
- 2015-05-01 Listing Removed — MiRealSource-MiMLS
- 2014-05-08 Listed $65,000 REALCOMP
- 2014-05-08 Listed $65,000 MiRealSource-MiMLS
- 2007-11-26 Sold (Public Records) $56,650 Public Records
- 2004-10-16 Sold (Public Records) $55,000 Public Records
Property tax history
-2.5%/yrLatest (2025): $368 · +12.2% YoY. Source: county tax records.
Cash-flow waterfall
monthlySold comps — $/sqft
last 12 mo · ≤1 miLoading sold comps…