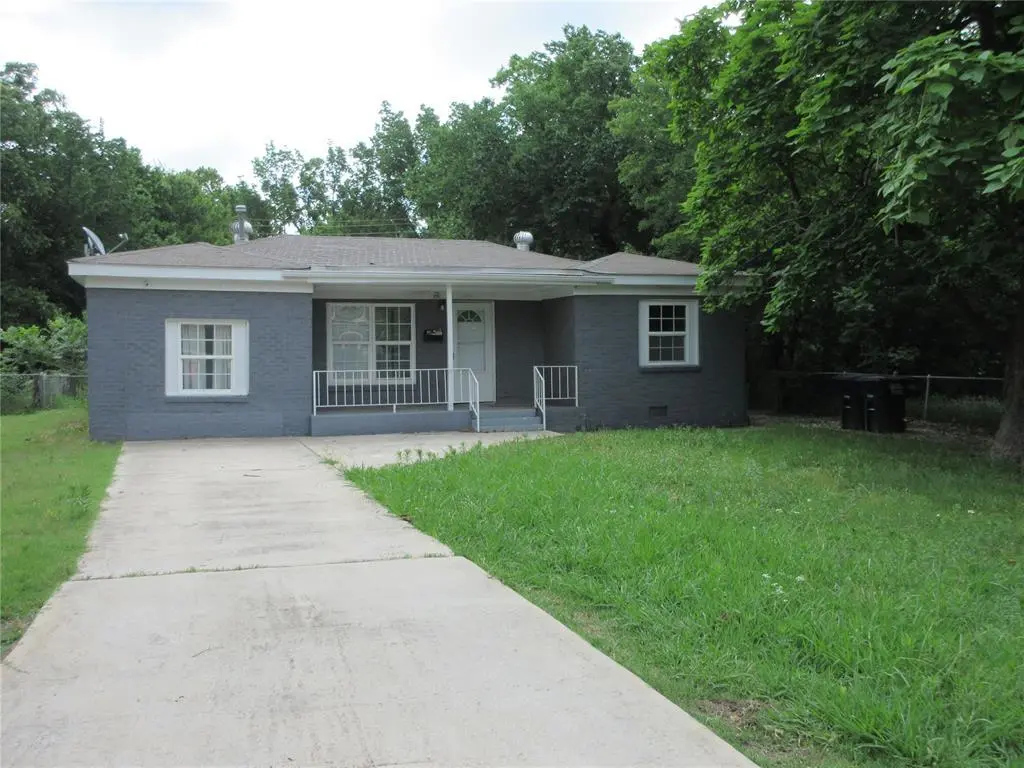
1411 N Philadelphia Ave · Shawnee, OK
Flood risk 1/10 · Minimal
- FEMA flood zone
- X (unshaded)
- Chance of flooding over 30 yrs
- 0.0%
- Est. flood insurance / yr
- $507 – $1,088
Fire risk 3/10 · Minor
- Est. fire insurance / yr
- $2,463 – $4,575
Heat risk 5/10 · Moderate
- Hot days now (above 109°F)
- 7 days/yr
- Hot days in 30 yrs
- 18 days/yr
Wind risk 3/10 · Minor
- Chance of severe wind over 30 yrs
- 6.0%
Air-quality risk 2/10 · Minimal
- Unhealthy air days now
- 1 days/yr
- Unhealthy air days in 30 yrs
- 1 days/yr
Risk factors via First Street. Map © Google.
Why this score? — see what drove the B grade
The composite is a weighted blend of 9 inputs, each scored 0–100. Each bar is that input's sub-score; the figure is the points it added to the 100-point composite (weight × sub-score).
- Cash flow +30.0/30.0
- 1% rule +10.0/10.0
- DSCR +10.0/10.0
- ARV discount +7.5/15.0
- Rent growth +3.2/5.0
- Livability +3.2/5.0
- Appreciation +2.7/10.0
- Condition / age +2.5/5.0
- Schools +1.1/10.0
$69,500
🖨 Deal sheet (PDF) 📄 Offer letter ✓ Due diligence
Listing remarks
Great Investment Opportunity! A little work goes a long way—clean up and reap the rewards. 3-bedroom home in a convenient location close to banking, dining, and shopping. Features include central heat and air, a fenced backyard, and an outdoor storm cellar. Whether you're looking for an investment property or a place to call home, this property offers excellent potential. Selling as-is.
Key facts
- Outdoor storm cellar
- Convenient location
- Fenced backyard
Tags
Property features AI
Finance
- Financial info: Listing offered as-is
- HOA & community: No mandatory association dues
Exterior
- Security: Outdoor storm shelter
- Utilities: Public utilities
- Home design: Single family residence; One story; Property faces west; Existing property
- Construction: Brick and frame construction; Composition roof; Built with conventional foundation
- Exterior features: Outbuildings on the property; Chain link fencing; Interior lot
Interior
- Kitchen: Free‑standing range and oven (electric)
- Bedrooms: 3 bedrooms
- Flooring: Carpet; Laminate
- Bathrooms: 1 full bathroom
- Interior features: Refrigerator included; One living area; Total 6 rooms
- Laundry & utility: Conventional foundation
Neighborhood map
What this means for you Summary
Snapshot
- This is a 3-bed/2.0-bath single-family listed at $70k.
Deal economics
- At list price, monthly cash flow is $391 ($5k/yr) — positive.
- The deal already cash-flows at list — no discount required.
- Meets the 1% rule at list price ($1k rent vs $70k).
- Cap rate 13.0% vs local median 3.9% in Shawnee — top-decile yield for the area; either an underpriced asset or a hidden risk that comps aren't pricing in. Stress-test before assuming the spread holds.
Location & tenants
- Location reads 63/100 on livability (#217 in OK) — a middle-class / working-renter tenant base. Strengths: cost of living A+, housing A+; Watch: crime F, amenities F, commute F.
- Shawnee (town): math 11% / reading 17% proficiency, ranked #238 of 270 in OK (top 88%) — low school quality limits family demand, transient renter base, plan for 1-2y turnover; 70% free/reduced lunch — lower-income household profile, screen leases tightly.
- Zoned schools: Shawnee Ec Ctr (384 students, 0% FRL); Shawnee Hs (math 16% / reading 35%, grade F, #142 of 447 statewide, top 32%, 987 students, 0% FRL) — zoned schools average 0% FRL vs 70% district-wide (70 pts lower); this property's tenant base skews higher-income than the district average.
- Market conditions: Rents rising (+2.8%/yr); 192 active listings in the ZIP; 4 comparable units currently listed for rent nearby; rentals leasing fast (median 5d on market — plan ~1-2 weeks tenant-placement turnaround); 183 units permitted in Pottawatomie County in 2024 (16 in 5+ unit buildings).
Forward outlook
- Local home prices are declining (-3.0%/yr); year-one equity from $481 of loan paydown is wiped out by about $2k of value loss. Plan a longer hold.
- Pottawatomie County population projected at +12% by 2050 — modest demand growth; plan on rents tracking national, not racing it.
- At projected returns (-3.0% appreciation + 2.8% rent growth), your $19k cash investment doubles in ~6 years — after that, you're playing with house money.
Negotiation context
- Only 7 days on market — expect competitive offers; lowballing is unlikely to land.
Risks & watch-outs
- Watch-outs: built in 1952 — expect roof / HVAC / electrical / plumbing capex.
- Climate carrying-cost: extreme-heat days projected 7→18/yr by 2055 (HVAC capex compounding) — expect insurance premiums to compound above CPI over the hold.
Questions for the listing agent
- Built in 1952 — when were the roof, HVAC, electrical panel, plumbing, and water heater last replaced?
- Is there a deadline driving the sale (1031 exchange, divorce, estate, relocation)? That informs how much negotiation room exists.
- Schools are F-rated, which usually means shorter tenancies and higher turnover. Who's the typical renter profile here, and what's been the actual vacancy rate?
- Crime grade is F in this area — have there been break-ins, vandalism, or insurance claims at this property in the last 3 years? What carrier currently insures it and at what premium?
- What's the average days-on-market for RENTAL listings here right now (not sales)? A rising rental-DOM trend means longer vacancies and softer asking-rent achievability than the comps imply.
- What's the recent tenant-quality profile in this submarket — average credit score on applications, eviction rate, late-payment / NSF rate, and stable-employment percentage? A property-management company in the area should have these aggregated.
- How much new for-sale + rental construction is in the pipeline within 1–3 miles? Heavy new supply typically softens prices + rents 12–24 months out; constrained supply supports both.
Investment metrics
- 1% rule
- 1.53% ✓
- Cap rate
- 13.04%
- Cash-on-cash
- 24.09%
- DSCR
- 2.07
- GRM
- 5.4
CMA / ARV
- ARV (on-the-fly)
- $144,668
- Comps found
- 12
Show comp detail 12 sales within ~0.75 mi
| Address | Dist | Beds/Ba | Sqft | Sold | Price | $/sf | Match |
|---|---|---|---|---|---|---|---|
| 1817 N Bell Ave | 0.40mi | 3/1.0 | 1,181 (-4%) | 6mo | $162,500 | $138 | 66 |
| 1539 N Pennsylvania Ave | 0.25mi | 3/1.0 | 1,086 (-11%) | 3mo | $129,000 | $119 | 63 |
| 508 E Wallace St | 0.53mi | 3/1.5 | 1,145 (-7%) | 3mo | $107,000 | $93 | 60 |
| 1028 E Chandler St | 0.67mi | 3/1.5 | 1,180 (-4%) | 2mo | $129,000 | $109 | 58 |
| 1416 N Mckinley Ave | 0.42mi | 3/1.0 | 1,076 (-12%) | 4mo | $134,900 | $125 | 53 |
| 902 N Beard Ave | 0.54mi | 3/2.0 | 1,056 (-14%) | 1mo | $160,900 | $152 | 50 |
| 1816 N Bell Ave | 0.42mi | 2/1.0 (-1) | 1,052 (-14%) | 4mo | $120,000 | $114 | 44 |
| 1505 N Louisa Ave | 0.51mi | 2/1.0 (-1) | 1,056 (-14%) | 2mo | $24,900 | $24 | 42 |
| 907 N Mckinley Ave | 0.72mi | 2/2.0 (-1) | 1,086 (-11%) | 4mo | $99,000 | $91 | 39 |
| 1925 N Park Ave | 0.66mi | 2/1.0 (-1) | 1,088 (-11%) | 5mo | $139,000 | $128 | 37 |
| 1815 N Louisa Ave | 0.62mi | 2/1.0 (-1) | 1,396 (+14%) | 4mo | $152,000 | $109 | 36 |
| 2001 N Mckinley Ave | 0.66mi | 2/1.5 (-1) | 1,059 (-14%) | 6mo | $125,000 | $118 | 35 |
Match score weights: distance 35% · size 25% · config 20% · recency 20%. Top-matched comps best support the ARV.
Projected returns pro-forma
-3.0% appreciation · 2.82% rent growth · sell at horizon
- IRR
- 17.1%
- Equity multiple
- 1.69×
- Total profit
- $13,426
- Equity at exit
- $10,363
- IRR
- 25.5%
- Equity multiple
- 3.21×
- Total profit
- $42,937
- Equity at exit
- $6,009
Cash invested: $19,460 (down + closing). Projections, not guarantees.
Landlord ↔ Tenant lean methodology
- Overall (STATE)
- 83 Strongly Landlord-Friendly
- State Oklahoma
- 83 Strongly Landlord-Friendly · R+20
- County
- — inherits STATE
- City
- — inherits STATE
ZIP-level market 74801
- Home prices YoY
- -1.7%
- Rents YoY
- 2.8%
- Active inventory
- 192
- Price-to-rent
- 5.4×
Monthly cashflow live
- Estimated rent
- $1,065 medium interval (Pro) →
- Mortgage (P&I)
- −$364
- Tax from tax record
- −$58 /mo · $690/yr
- Insurance
- −$29
- HOA
- −$0
- Vacancy / Maint / Mgmt
- −$224
- Net cashflow
- $391
Break-even live
Sensitivity live
| Price | -10% $430 | -5% $410 | +0% $391 | +5% $371 | +10% $351 |
|---|---|---|---|---|---|
| Rent | -10% $307 | -5% $349 | +0% $391 | +5% $433 | +10% $475 |
| Rate | -1.0pp $426 | -0.5pp $408 | base $391 | +0.5pp $373 | +1.0pp $354 |
UW: 25.0% down · 7.5% · 30yr · 1.5% tax · 5.0% vac · 8.0% maint · 8.0% mgmt
Financing live
Cash to close
- Down payment
- $17,375
- Closing costs
- $2,085
- Reserves months
- —
- Total cash needed
- —
Loan-product check · same deal, 3 products live
Conventional
25% down · 7.5% · 30yr
- Down + closing
- —
- Monthly P&I
- —
- Monthly cashflow
- —
- DSCR
- —
- Eligible?
- —
Personal DTI + credit; lowest rate.
DSCR
20% down · 8.5% · 30yr
- Down + closing
- —
- Monthly P&I
- —
- Monthly cashflow
- —
- DSCR
- —
- Eligible?
- —
No personal income docs; deal must DSCR.
Hard money
10% down · 12.0% · 12mo
- Down + closing
- —
- Monthly P&I
- —
- Monthly cashflow
- —
- DSCR
- —
- Eligible?
- —
Short-term bridge; refi at stabilization.
Rent comps 4 comps
| Address | Beds | Baths | Sqft | Rent | $/sqft | DOM | Units | Dist |
|---|---|---|---|---|---|---|---|---|
| 721 E Wallace St Shawnee, OK | 2.0 | 1.0 | 1176 | $850 | $0.72 | 5d | 1 | 0.62mi |
| 1001 E Independence St Shawnee, OK | 1.0–2.0 | 1.0 | 690 | $900 | $1.30 | 5d | 2 | 0.63mi |
| 414 N Aydelotte Ave Shawnee, OK | 2.0 | 2.0 | 864 | $1,250 | $1.45 | 5d | 1 | 1.17mi |
| 515 W 10th St Shawnee, OK | 3.0 | 1.0 | 1131 | $825 | $0.73 | 21d | 1 | 1.27mi |
Listing history 8 events
-
2026-06-18status $69,500 Pending 7 DOM
-
2026-06-18days on market $69,500 Active 7 DOM
-
2026-06-17days on market $69,500 Active 6 DOM
-
2026-06-16days on market $69,500 Active 5 DOM
-
2026-06-15days on market $69,500 Active 4 DOM
-
2026-06-14days on market $69,500 Active 2 DOM
-
2026-06-12remarks 389-char remark
-
2026-06-12$69,500 Active 1 DOM
ⓘ Source: listings_history table (triggers on properties + properties_extension) + one-shot
backfill from property_details.listing_events for pre-trigger history.
Tax reassessment forecast OK · Resets to sale price
- Current annual tax
- $690 · $58/mo
- Projected year-2 tax
- $690 · $58/mo
- Expected delta
- $0/yr ($0/mo · 0.0%)
ⓘ Screening estimate from a state-policy table — verify with the county assessor before closing.
Climate risk First Street
- Flood 1/10 Low FEMA zone X (unshaded) · 0% chance over 30 yrs
- Wildfire 3/10 Moderate
- Heat 5/10 Major 7 d/yr ≥109°F today · 18 d/yr by 30 yrs out
- Wind 3/10 Moderate 6% chance of damaging wind over 30 yrs
- Air quality 2/10 Low 1 unhealthy d/yr today · 1 by 30 yrs out
Nearby sold comps map
Loading sold comps map…
Walkable amenities ~0.75 mi
Loading nearby amenities…
Taxation est. · year 1
- Rental income
- $12,784
- − Mortgage interest
- −$3,893
- − Property taxes
- −$690
- − Insurance
- −$348
- − Repairs & maintenance
- −$1,023
- − Management
- −$1,023
- − Depreciation
- −$2,022
- Taxable income
- $3,786
- Est. tax owed @ 24.0%
- −$909
- After-tax cash flow
- $3,780/yr
For passive investors: Depreciation is non-cash, so a rental often shows a tax loss while cash-flowing — sheltering income. Rental losses are passive: they offset passive income freely, and up to $25,000/yr can offset ordinary (W-2) income if you actively participate and your MAGI is under $100k (phasing out to $0 by $150k); unused losses carry forward. On sale, claimed depreciation is recaptured at up to 25%, and gains may owe capital-gains tax (a 1031 exchange can defer both). Figures are a year-1 estimate at your 24.0% rate — not tax advice; consult a CPA.
Schools (NCES district)
- District
- Shawnee
- NCES district ID
- 4027570
- Math proficiency
- 11% ▼ -10.00%
- Reading proficiency
- 17% ▼ -10.00%
- Median HH income
- $32,128
- Composite
- 11.21/100
- National rank
- #9724
- State rank
- #238 of 270 in OK
Livability — Shawnee
- Score
- 63/100
- State rank
- #217
- US rank
- #15593
Category grades
Schools grade is shown separately in the Schools card above.
Census & demographics
- Census place
- Shawnee, OK
- County
- Pottawatomie County · 45,194 people
- City population
- 45,194
- Metro
- Shawnee, OK
- Population (ZIP)
- 21,967
- Household income
- $55,077
- Rent vs Own
- Severe rent burden
- 594.0
Population outlook (Pottawatomie County) Hauer SSP2
- Today (2025)
- 76,622 people
- By 2030
- 78,816 · +2.9%
- By 2040
- 82,766 · +8.0%
- By 2050
- 86,031 · +12.3%
- By 2075
- 93,316 · +21.8%
- By 2100
- 95,820 · +25.1%
Race, ethnicity, and origin ACS 2023
- Neighborhood character
- Predominantly White (67%)
- Race & ethnicity
- White 67% Native American 15% Two or more races 10% Hispanic / Latino 7% Black 3%
- Hispanic origin (detail)
- Mexican 6%
- Common ancestry
- Lithuanian 1% Slovak 1% Italian 1%
- Foreign-born
- 2% · Canada
- Languages at home
- 96% English-only · Spanish 2% Other Asian/Pacific 1%
Political lean MEDSL · Pottawatomie
- 2024 margin
- Solid R (+47.4) · D 25.2% · R 72.7% · Other 2.1%
- 2008→2024 swing
- -9.1pp toward R · 2008: -38.4pp · 2024: -47.4pp
- All cycles
- 2024: R+47.4 2020: R+46.0 2016: R+46.5 2012: R+38.7 2008: R+38.4
Not yet ingested
- Civics
- —
Market trends
- HPI YoY
- ▼ -4.66%
- Current HPI
- 266.7965
- Rent YoY
- ▲ 2.82%
- Metro
- Shawnee, OK
- State GDP YoY
- ▲ 1.55%
- F500 in state
- 6
Industry mix (Fortune 500 HQ in OK)
| Industry | F500 HQs | Revenue |
|---|---|---|
| Energy | 3 | $48B |
|
||
Price history
1 event — show timeline
- 2026-06-11 Listed $69,500 MLSOK
Property tax history
+4.4%/yrLatest (2025): $690 · +4.1% YoY. Source: county tax records.
Cash-flow waterfall
monthlySold comps — $/sqft
last 12 mo · ≤1 miLoading sold comps…