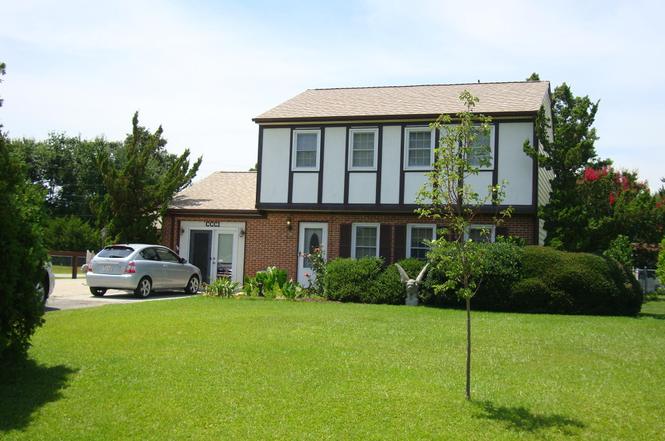
301 Murdoch Rd · Newport, NC
Flood risk 5/10 · Moderate
- FEMA flood zone
- X (unshaded)
- Chance of flooding over 30 yrs
- 0.67%
- Est. flood insurance / yr
- $507 – $1,088
Fire risk 4/10 · Minor
- Est. fire insurance / yr
- $906 – $1,684
Heat risk 9/10 · Severe
- Hot days now (above 102°F)
- 7 days/yr
- Hot days in 30 yrs
- 20 days/yr
Wind risk 8/10 · Major
- Chance of severe wind over 30 yrs
- 99.0%
Air-quality risk 2/10 · Minimal
- Unhealthy air days now
- 2 days/yr
- Unhealthy air days in 30 yrs
- 2 days/yr
Risk factors via First Street. Map © Google.
Why this score? — see what drove the D+ grade
The composite is a weighted blend of 9 inputs, each scored 0–100. Each bar is that input's sub-score; the figure is the points it added to the 100-point composite (weight × sub-score).
- Cash flow +15.0/30.0
- ARV discount +7.5/15.0
- Schools +5.1/10.0
- 1% rule +5.0/10.0
- DSCR +5.0/10.0
- Livability +3.2/5.0
- Rent growth +2.5/5.0
- Condition / age +2.5/5.0
- Appreciation +0.0/10.0
$285,000
🖨 Deal sheet (PDF) 📄 Offer letter ✓ Due diligence
Listing remarks MLS
This one has it all! Updated kitchen w/ granite, updated bathrooms, den/home office with storage, garage/man-cave, patio w/ a new auto remote 'SunSetters' awning and a fenced in back yard. Appliances: Shades & Rods Floors: Laminate
Key facts
- One car garage
- Full fence
- Added den space
Tags
Neighborhood map
What this means for you Summary
Snapshot
- This is a 4-bed/3.0-bath other listed at $285k.
Deal economics
- At list price, monthly cash flow is $10k ($121k/yr) — positive.
- The deal already cash-flows at list — no discount required.
- Meets the 1% rule at list price ($15k rent vs $285k).
- Recommended offer: $251k (12.0% below list) — sets the bar for market timing.
- Cap rate 48.6% vs local median 31.4% in Newport — top-decile yield for the area; either an underpriced asset or a hidden risk that comps aren't pricing in. Stress-test before assuming the spread holds.
Location & tenants
- Location reads 63/100 on livability (#385 in NC) — a middle-class / working-renter tenant base. Strengths: cost of living A+, housing A+; Watch: employment C-, amenities F, commute F.
- Carteret County Public Schools (rural): math 59% / reading 61% proficiency, ranked #31 of 178 in NC (top 17%) — acceptable for families but not a draw, mixed tenant base, ~2y average lease.
- Zoned schools: Newport Elementary (math 48% / reading 45%, grade D-, #542 of 1,410 statewide, top 39%, 645 students, 100% FRL); Newport Middle (math 39% / reading 56%, grade C-, #140 of 475 statewide, top 30%, 378 students, 98% FRL); West Carteret High (math 82% / reading 71%, grade A-, #89 of 535 statewide, top 16%, 1,146 students, 40% FRL) — zoned schools average 79% FRL vs 39% district-wide (40 pts higher); higher-poverty schools than district average — tighter screening recommended.
- Market conditions: 216 active listings in the ZIP; 935 units permitted in Carteret County in 2024 (360 in 5+ unit buildings).
- At $15,059/mo this rent would consume 257% of the median local household income ($70k/yr) (locally 461% of renters already pay >50% of income on rent) — very limited rent-growth headroom before tenants either downsize or default.
Forward outlook
- Local home prices are declining (-3.0%/yr); year-one equity from $2k of loan paydown is wiped out by about $9k of value loss. Plan a longer hold.
- Carteret County population projected at +9% by 2050 — modest demand growth; plan on rents tracking national, not racing it.
- At projected returns (-3.0% appreciation + 3.0% rent growth), your $80k cash investment doubles in ~1 year — after that, you're playing with house money.
Negotiation context
- It's been on market 187 days — a 12% lower offer ($251k) is reasonable based on typical stale-listing flexibility.
- 9 sale attempts since 21y ago with the ask held roughly flat each time — persistent listings suggest the price (not the market) is what's stuck; bring a comps-based counter.
- Current owner paid $143k; list at $285k implies a 99% gain — meaningful room to come down on a strong offer.
Risks & watch-outs
- Climate carrying-cost: moderate flood risk; severe wind risk, 99% chance of damaging wind over 30y; extreme-heat days projected 7→20/yr by 2055 (HVAC capex compounding) — expect insurance premiums to compound above CPI over the hold.
Questions for the listing agent
- It's been on market 187 days. Have you received any prior offers? Is the seller open to a 12% concession, seller financing, or rate buy-down credit?
- Why hasn't it sold? Are there any deal-killer items the seller is aware of (foundation, flood, title, zoning, code violations)?
- Is there a deadline driving the sale (1031 exchange, divorce, estate, relocation)? That informs how much negotiation room exists.
- The area grade is low — what's the realistic commute time and amenity access for the typical tenant pool here? Any planned neighborhood developments (good or bad) we should know about?
- What's the average days-on-market for RENTAL listings here right now (not sales)? A rising rental-DOM trend means longer vacancies and softer asking-rent achievability than the comps imply.
- What's the recent tenant-quality profile in this submarket — average credit score on applications, eviction rate, late-payment / NSF rate, and stable-employment percentage? A property-management company in the area should have these aggregated.
- How much new for-sale + rental construction is in the pipeline within 1–3 miles? Heavy new supply typically softens prices + rents 12–24 months out; constrained supply supports both.
Investment metrics
- 1% rule
- 5.28% ✓
- Cap rate
- 48.61%
- Cash-on-cash
- 151.13%
- DSCR
- 7.72
- GRM
- 1.6
CMA / ARV
No comps found within radius.
Projected returns pro-forma
-3.0% appreciation · 3.0% rent growth · sell at horizon
- IRR
- —
- Equity multiple
- 8.44×
- Total profit
- $594,060
- Equity at exit
- $42,494
- IRR
- —
- Equity multiple
- 17.82×
- Total profit
- $1,342,132
- Equity at exit
- $24,642
Cash invested: $79,800 (down + closing). Projections, not guarantees.
Landlord ↔ Tenant lean methodology
- Overall (STATE)
- 85 Strongly Landlord-Friendly
- State North Carolina
- 85 Strongly Landlord-Friendly · R+3
- County
- — inherits STATE
- City
- — inherits STATE
ZIP-level market 28570
- Home prices YoY
- -16.2%
- Active inventory
- 216
- Price-to-rent
- 1.6×
Monthly cashflow live
- Estimated rent
- $15,059 medium interval (Pro) →
- Mortgage (P&I)
- −$1,495
- Tax from tax record
- −$233 /mo · $2,796/yr
- Insurance
- −$119
- HOA
- −$0
- Vacancy / Maint / Mgmt
- −$3,162
- Net cashflow
- $10,050
Break-even live
Sensitivity live
| Price | -10% $10,211 | -5% $10,131 | +0% $10,050 | +5% $9,969 | +10% $9,889 |
|---|---|---|---|---|---|
| Rent | -10% $8,860 | -5% $9,455 | +0% $10,050 | +5% $10,645 | +10% $11,240 |
| Rate | -1.0pp $10,194 | -0.5pp $10,123 | base $10,050 | +0.5pp $9,976 | +1.0pp $9,901 |
UW: 25.0% down · 7.5% · 30yr · 1.5% tax · 5.0% vac · 8.0% maint · 8.0% mgmt
Financing live
Cash to close
- Down payment
- $71,250
- Closing costs
- $8,550
- Reserves months
- —
- Total cash needed
- —
Loan-product check · same deal, 3 products live
Conventional
25% down · 7.5% · 30yr
- Down + closing
- —
- Monthly P&I
- —
- Monthly cashflow
- —
- DSCR
- —
- Eligible?
- —
Personal DTI + credit; lowest rate.
DSCR
20% down · 8.5% · 30yr
- Down + closing
- —
- Monthly P&I
- —
- Monthly cashflow
- —
- DSCR
- —
- Eligible?
- —
No personal income docs; deal must DSCR.
Hard money
10% down · 12.0% · 12mo
- Down + closing
- —
- Monthly P&I
- —
- Monthly cashflow
- —
- DSCR
- —
- Eligible?
- —
Short-term bridge; refi at stabilization.
Listing history 24 events
-
2026-04-20status Pending
-
2026-03-26status Active
-
2026-03-26historical
-
2026-02-21status Active
-
2026-02-20historical
-
2026-01-08status Active
-
2026-01-08price $285,000
-
2025-10-31price $287,000
-
2025-10-09status Active
-
2025-10-04status Pending
-
2025-10-04historical
-
2025-09-05price $287,500
-
2025-08-11price $290,500
-
2025-07-08$295,500 Active
-
2013-12-13soldstatus $143,000 235-char remark
Show marketing remark (235 chars)
This one has it all! Updated kitchen w/ granite, updated bathrooms, den/home office with storage, garage/man-cave, patio w/ a new auto remote 'SunSetters' awning and a fenced in back yard. Appliances: Shades & Rods Floors: Laminate
-
2013-12-13soldstatus $143,000
Show marketing remark (235 chars)
This one has it all! Updated kitchen w/ granite, updated bathrooms, den/home office with storage, garage/man-cave, patio w/ a new auto remote 'SunSetters' awning and a fenced in back yard. Appliances: Shades & Rods Floors: Laminate
-
2013-07-29$149,000 235-char remark
Show marketing remark (235 chars)
This one has it all! Updated kitchen w/ granite, updated bathrooms, den/home office with storage, garage/man-cave, patio w/ a new auto remote 'SunSetters' awning and a fenced in back yard. Appliances: Shades & Rods Floors: Laminate
-
2012-08-13historical
-
2012-04-11$174,000
-
2008-10-31historical
-
2008-03-25$175,000
-
2005-06-30soldstatus $148,500
-
2005-06-29soldstatus $148,500
-
2005-01-01$159,900
ⓘ Source: listings_history table (triggers on properties + properties_extension) + one-shot
backfill from property_details.listing_events for pre-trigger history.
Tax reassessment forecast NC · Resets to sale price
- Current annual tax
- $2,796 · $233/mo
- Projected year-2 tax
- $2,796 · $233/mo
- Expected delta
- $0/yr ($0/mo · 0.0%)
ⓘ Screening estimate from a state-policy table — verify with the county assessor before closing.
Climate risk First Street
- Flood 5/10 Major FEMA zone X (unshaded) · 67% chance over 30 yrs
- Wildfire 4/10 Moderate
- Heat 9/10 Extreme 7 d/yr ≥102°F today · 20 d/yr by 30 yrs out
- Wind 8/10 Severe 99% chance of damaging wind over 30 yrs
- Air quality 2/10 Low 2 unhealthy d/yr today · 2 by 30 yrs out
Nearby sold comps map
Loading sold comps map…
Walkable amenities ~0.75 mi
Loading nearby amenities…
Taxation est. · year 1
- Rental income
- $180,703
- − Mortgage interest
- −$15,964
- − Property taxes
- −$2,796
- − Insurance
- −$1,425
- − Repairs & maintenance
- −$14,456
- − Management
- −$14,456
- − Depreciation
- −$8,291
- Taxable income
- $123,315
- Est. tax owed @ 24.0%
- −$29,596
- After-tax cash flow
- $91,005/yr
For passive investors: Depreciation is non-cash, so a rental often shows a tax loss while cash-flowing — sheltering income. Rental losses are passive: they offset passive income freely, and up to $25,000/yr can offset ordinary (W-2) income if you actively participate and your MAGI is under $100k (phasing out to $0 by $150k); unused losses carry forward. On sale, claimed depreciation is recaptured at up to 25%, and gains may owe capital-gains tax (a 1031 exchange can defer both). Figures are a year-1 estimate at your 24.0% rate — not tax advice; consult a CPA.
Schools (NCES district)
- District
- Carteret County Public Schools
- NCES district ID
- 3700630
- Math proficiency
- 59% ▲ 5.00%
- Reading proficiency
- 61% ▲ 2.00%
- Median HH income
- $48,330
- Composite
- 50.92/100
- National rank
- #1786
- State rank
- #31 of 178 in NC
Livability — Newport
- Score
- 63/100
- State rank
- #385
- US rank
- #15094
Category grades
Schools grade is shown separately in the Schools card above.
Census & demographics
- County
- Carteret County · 52,389 people
- City population
- 22,197
- Metro
- Morehead City, NC
- Population (ZIP)
- 22,197
- Household income
- $70,229
- Rent vs Own
- Severe rent burden
- 461.0
Population outlook (Carteret County) Hauer SSP2
- Today (2025)
- 73,443 people
- By 2030
- 75,344 · +2.6%
- By 2040
- 78,142 · +6.4%
- By 2050
- 80,091 · +9.1%
- By 2075
- 86,120 · +17.3%
- By 2100
- 89,408 · +21.7%
Race, ethnicity, and origin ACS 2023
- Neighborhood character
- Predominantly White (82%)
- Race & ethnicity
- White 82% Hispanic / Latino 7% Two or more races 6% Black 3% Asian 1%
- Hispanic origin (detail)
- Mexican 4%
- Common ancestry
- Slovak 3% Romanian 3% Lithuanian 2%
- Foreign-born
- 5% · Canada, Dominican Republic
- Languages at home
- 92% English-only · Spanish 6% German/W. Germanic 1%
Political lean MEDSL · Carteret
- 2024 margin
- Solid R (+43.1) · D 28.0% · R 71.1%
- 2008→2024 swing
- -8.4pp toward R · 2008: -34.7pp · 2024: -43.1pp
- All cycles
- 2024: R+43.1 2020: R+42.0 2016: R+44.5 2012: R+41.0 2008: R+34.7
Not yet ingested
- Civics
- —
Market trends
- HPI YoY
- ▼ -53.54%
- Current HPI
- 276.6589
- Rent YoY
- —
- Metro
- Morehead City, NC
- State GDP YoY
- ▲ 3.28%
- F500 in state
- 26
Industry mix (Fortune 500 HQ in NC)
| Industry | F500 HQs | Revenue |
|---|---|---|
| Financial Services | 2 | $213B |
|
||
| Retail | 2 | $95B |
|
||
| Industrial Conglomerate | 1 | $38B |
|
||
| Metals / Steel | 1 | $35B |
|
||
| Utilities | 1 | $30B |
|
||
| Industrial Machinery | 1 | $19B |
|
||
Price history
+78.2% since first listed24 events — show timeline
- 2026-04-20 Pending — Hive MLS
- 2026-03-26 Relisted — Hive MLS
- 2026-03-26 Listing Removed — Hive MLS
- 2026-02-21 Relisted — Hive MLS
- 2026-02-20 Listing Removed — Hive MLS
- 2026-01-08 Relisted — Hive MLS
- 2026-01-08 Price Changed $285,000 Hive MLS
- 2025-10-31 Price Changed $287,000 Hive MLS
- 2025-10-09 Relisted — Hive MLS
- 2025-10-04 Pending — Hive MLS
- 2025-10-04 Listing Removed — Hive MLS
- 2025-09-05 Price Changed $287,500 Hive MLS
- 2025-08-11 Price Changed $290,500 Hive MLS
- 2025-07-08 Listed $295,500 Hive MLS
- 2013-12-13 Sold (Public Records) $143,000 Public Records
- 2013-12-13 Sold (MLS) $143,000 Hive MLS
- 2013-07-29 Listed $149,000 Hive MLS
- 2012-08-13 Listing Removed — Hive MLS
- 2012-04-11 Listed $174,000 Hive MLS
- 2008-10-31 Listing Removed — Hive MLS
- 2008-03-25 Listed $175,000 Hive MLS
- 2005-06-30 Sold (Public Records) $148,500 Public Records
- 2005-06-29 Sold (MLS) $148,500 Hive MLS
- 2005-01-01 Listed $159,900 Hive MLS
Property tax history
+15.7%/yrLatest (2025): $2,796 · +3.2% YoY. Source: county tax records.
Cash-flow waterfall
monthlySold comps — $/sqft
last 12 mo · ≤1 miLoading sold comps…