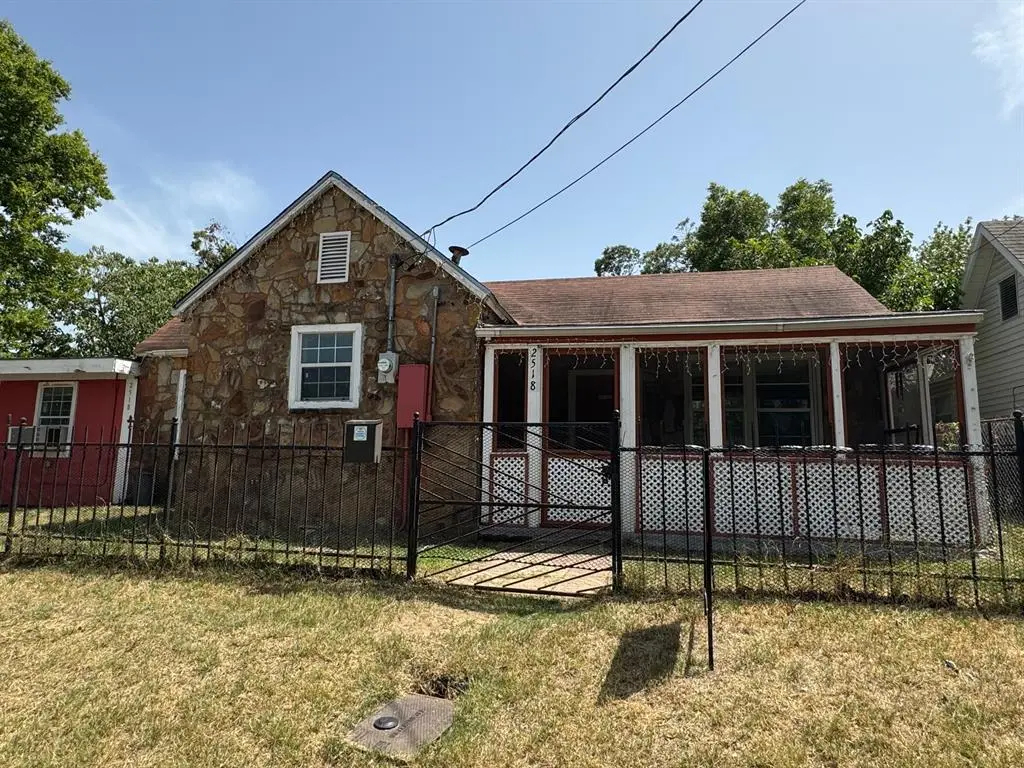
2518 McLemore Ave · Fort Worth, TX
Flood risk 1/10 · Minimal
- FEMA flood zone
- X (unshaded)
- Chance of flooding over 30 yrs
- 0.0%
- Est. flood insurance / yr
- $507 – $1,088
Fire risk 1/10 · Minimal
- Est. fire insurance / yr
- $1,222 – $2,270
Heat risk 8/10 · Major
- Hot days now (above 109°F)
- 7 days/yr
- Hot days in 30 yrs
- 23 days/yr
Wind risk 4/10 · Minor
- Chance of severe wind over 30 yrs
- 24.0%
Air-quality risk 4/10 · Minor
- Unhealthy air days now
- 4 days/yr
- Unhealthy air days in 30 yrs
- 5 days/yr
Risk factors via First Street. Map © Google.
Why this score? — see what drove the C- grade
The composite is a weighted blend of 9 inputs, each scored 0–100. Each bar is that input's sub-score; the figure is the points it added to the 100-point composite (weight × sub-score).
- Cash flow +16.9/30.0
- ARV discount +15.0/15.0
- 1% rule +6.4/10.0
- DSCR +5.2/10.0
- Livability +4.0/5.0
- Rent growth +2.6/5.0
- Condition / age +2.5/5.0
- Schools +2.0/10.0
- Appreciation +0.0/10.0
$164,900
🖨 Deal sheet (PDF) 📄 Offer letter ✓ Due diligence
Listing remarks
* * Investor’s Dream! Prime Location Near Downtown Fort Worth * * Excellent opportunity for investors or owner-occupants in one of Fort Worth’s fastest-growing areas. This * * move-in-ready * * home is all about location—just minutes from Downtown Fort Worth and close to Topgolf, Trinity River trails, Gateway Park, Coyote Drive-In, and a variety of dining, shopping, and entertainment options. The property offers quick access to major highways, making commuting throughout the DFW Metroplex easy and convenient. Situated on a generously sized lot with mature pecan trees, it provides strong long-term value and flexibility. Offered * * for sale * * , this property
Key facts
- Fresh renovations
- Large backyard
- Investor fixer-upper
Tags
Property features AI
Exterior
- Home design: House
- Construction: 964 sq ft living area
- Exterior features: Lot approximately 10,542 sq ft
Neighborhood map
What this means for you Summary
Snapshot
- This is a 2-bed/1.0-bath single-family listed at $165k.
Deal economics
- At list price, monthly cash flow is $108 ($1k/yr) — positive.
- The deal already cash-flows at list — no discount required.
- Meets the 1% rule at list price ($2k rent vs $165k).
- Recommended offer: $162k (1.5% below list) — sets the bar for market timing.
- Cap rate 7.1% vs local median 3.9% in Fort Worth — top-decile yield for the area; either an underpriced asset or a hidden risk that comps aren't pricing in. Stress-test before assuming the spread holds.
Location & tenants
- Location reads 80/100 on livability (#49 in TX, #1,954 nationally) — a professional / high-income tenant draw. Strengths: amenities A+, cost of living A+, housing A+; Watch: schools D+, crime F.
- Fort Worth ISD (urban): math 18% / reading 28% proficiency, ranked #742 of 826 in TX (top 90%) — low school quality limits family demand, transient renter base, plan for 1-2y turnover; 73% free/reduced lunch — lower-income household profile, screen leases tightly.
- Market conditions: Rents flat; 71 active listings in the ZIP; 34 comparable units currently listed for rent nearby; rentals leasing fast (median 9d on market — plan ~1-2 weeks tenant-placement turnaround); 18,938 units permitted in Tarrant County in 2024 (8,336 in 5+ unit buildings).
- This rent runs 37% of the median local income ($60k/yr) — at the standard rent-burdened threshold; future hikes will face affordability resistance.
Forward outlook
- Local home prices are declining (-3.0%/yr); year-one equity from $1k of loan paydown is wiped out by about $5k of value loss. Plan a longer hold.
- Tarrant County population projected at +41% by 2050 — long-run rental-demand tailwind backs the buy-and-hold thesis.
Negotiation context
- It's been on market 17 days — a 2% lower offer ($162k) is reasonable based on typical stale-listing flexibility.
- 5 sale attempts since 2y ago with the ask held roughly flat each time — persistent listings suggest the price (not the market) is what's stuck; bring a comps-based counter.
Risks & watch-outs
- Watch-outs: property tax is 3.2% of price; built in 1943 — expect roof / HVAC / electrical / plumbing capex.
- Climate carrying-cost: extreme-heat days projected 7→23/yr by 2055 (HVAC capex compounding) — expect insurance premiums to compound above CPI over the hold.
Questions for the listing agent
- Built in 1943 — when were the roof, HVAC, electrical panel, plumbing, and water heater last replaced?
- Property tax is high relative to price — has the assessment been appealed recently, and will the sale trigger a re-assessment?
- Is there a deadline driving the sale (1031 exchange, divorce, estate, relocation)? That informs how much negotiation room exists.
- Schools are D-rated, which usually means shorter tenancies and higher turnover. Who's the typical renter profile here, and what's been the actual vacancy rate?
- Crime grade is F in this area — have there been break-ins, vandalism, or insurance claims at this property in the last 3 years? What carrier currently insures it and at what premium?
- What's the average days-on-market for RENTAL listings here right now (not sales)? A rising rental-DOM trend means longer vacancies and softer asking-rent achievability than the comps imply.
- What's the recent tenant-quality profile in this submarket — average credit score on applications, eviction rate, late-payment / NSF rate, and stable-employment percentage? A property-management company in the area should have these aggregated.
- How much new for-sale + rental construction is in the pipeline within 1–3 miles? Heavy new supply typically softens prices + rents 12–24 months out; constrained supply supports both.
Investment metrics
- 1% rule
- 1.14% ✓
- Cap rate
- 7.08%
- Cash-on-cash
- 2.80%
- DSCR
- 1.12
- GRM
- 7.3
CMA / ARV
- ARV (median comp)
- $227,324
- List price
- $164,900
- Delta
- -23.02%
- Verdict
- UNDERPRICED
- Comps
- 20 within 1.0 mi
Show comp detail 12 sales within ~0.75 mi
| Address | Dist | Beds/Ba | Sqft | Sold | Price | $/sf | Match |
|---|---|---|---|---|---|---|---|
| 2518 Mclemore Ave | 0.00mi | 2/1.0 | 964 (0%) | 16mo | $179,900 | $187 | 86 |
| 2333 Bird St | 0.28mi | 2/1.0 | 867 (-10%) | 11mo | $209,900 | $242 | 61 |
| 2309 Primrose Ave | 0.59mi | 3/1.0 (+1) | 916 (-5%) | 0mo | $160,000 | $175 | 59 |
| 220 Blevins St | 0.68mi | 2/1.0 | 942 (-2%) | 10mo | $159,000 | $169 | 56 |
| 2504 Westbrook Ave | 0.37mi | 2/1.0 | 1,070 (+11%) | 12mo | $239,900 | $224 | 54 |
| 806 N Chandler Dr | 0.37mi | 2/1.0 | 1,028 (+7%) | 20mo | $235,000 | $229 | 54 |
| 601 Blevins St | 0.52mi | 2/2.0 | 1,056 (+10%) | 6mo | $180,000 | $170 | 51 |
| 2408 Bird St | 0.24mi | 3/2.0 (+1) | 1,036 (+8%) | 21mo | $254,900 | $246 | 50 |
| 2617 Marigold Ave | 0.64mi | 3/1.5 (+1) | 1,050 (+9%) | 2mo | $249,950 | $238 | 47 |
| 1109 N Riverside Dr | 0.58mi | 2/1.0 | 1,046 (+8%) | 22mo | $200,000 | $191 | 40 |
| 424 Colonial St | 0.65mi | 2/2.0 | 1,081 (+12%) | 9mo | $148,000 | $137 | 38 |
| 2820 Dell St | 0.28mi | 3/2.0 (+1) | 1,100 (+14%) | 24mo | $239,900 | $218 | 35 |
Match score weights: distance 35% · size 25% · config 20% · recency 20%. Top-matched comps best support the ARV.
Projected returns pro-forma
-3.0% appreciation · 0.45% rent growth · sell at horizon
- IRR
- -15.2%
- Equity multiple
- 0.47×
- Total profit
- $-24,367
- Equity at exit
- $24,587
- IRR
- -12.7%
- Equity multiple
- 0.35×
- Total profit
- $-29,952
- Equity at exit
- $14,258
Cash invested: $46,172 (down + closing). Projections, not guarantees.
Landlord ↔ Tenant lean methodology
- Overall (STATE)
- 87 Strongly Landlord-Friendly
- State Texas
- 87 Strongly Landlord-Friendly · R+5
- County
- — inherits STATE
- City
- — inherits STATE
ZIP-level market 76111
- Home prices YoY
- -19.2%
- Rents YoY
- 0.5%
- Active inventory
- 71
- Price-to-rent
- 7.3×
Monthly cashflow live
- Estimated rent
- $1,873 high interval (Pro) →
- Mortgage (P&I)
- −$865
- Tax from tax record
- −$439 /mo · $5,262/yr
- Insurance
- −$69
- HOA
- −$0
- Vacancy / Maint / Mgmt
- −$393
- Net cashflow
- $108
Break-even live
Sensitivity live
| Price | -10% $201 | -5% $155 | +0% $108 | +5% $61 | +10% $15 |
|---|---|---|---|---|---|
| Rent | -10% $-40 | -5% $34 | +0% $108 | +5% $182 | +10% $256 |
| Rate | -1.0pp $191 | -0.5pp $150 | base $108 | +0.5pp $65 | +1.0pp $22 |
UW: 25.0% down · 7.5% · 30yr · 1.5% tax · 5.0% vac · 8.0% maint · 8.0% mgmt
Financing live
Cash to close
- Down payment
- $41,225
- Closing costs
- $4,947
- Reserves months
- —
- Total cash needed
- —
Loan-product check · same deal, 3 products live
Conventional
25% down · 7.5% · 30yr
- Down + closing
- —
- Monthly P&I
- —
- Monthly cashflow
- —
- DSCR
- —
- Eligible?
- —
Personal DTI + credit; lowest rate.
DSCR
20% down · 8.5% · 30yr
- Down + closing
- —
- Monthly P&I
- —
- Monthly cashflow
- —
- DSCR
- —
- Eligible?
- —
No personal income docs; deal must DSCR.
Hard money
10% down · 12.0% · 12mo
- Down + closing
- —
- Monthly P&I
- —
- Monthly cashflow
- —
- DSCR
- —
- Eligible?
- —
Short-term bridge; refi at stabilization.
Rent comps 34 comps
| Address | Beds | Baths | Sqft | Rent | $/sqft | DOM | Units | Dist |
|---|---|---|---|---|---|---|---|---|
| 2413 Race St Fort Worth, TX | 2.0 | 1.0–2.0 | 849 | $2,009 | $2.37 | 1d | 14 | 0.08mi |
| 999 Scenic Hill Dr Fort Worth, TX | 2.0 | 1.0–2.5 | 1077 | $2,896 | $2.69 | 0d | 19 | 0.19mi |
| 2900 Race St Fort Worth, TX | 2.0 | 1.0–2.0 | 959 | $1,750 | $1.82 | 0d | 20 | 0.27mi |
| 2901 Race St Fort Worth, TX | 1.0–2.0 | 1.0–2.0 | 869 | $1,300 | $1.50 | 8d | 1 | 0.27mi |
| 336 Oakhurst Scenic Dr Fort Worth, TX | 2.0 | 1.0–2.0 | 939 | $2,095 | $2.23 | 1d | 26 | 0.30mi |
| 329 Blandin St Unit 1514811P Fort Worth, TX | 1.0 | 1.0 | 699 | $2,815 | $4.03 | 5d | 1 | 0.34mi |
| 1401 Oakhurst Scenic Dr Fort Worth, TX | 1.0 | 1.0 | 691 | $1,194 | $1.73 | 46d | 1 | 0.78mi |
| 1733 Greenfield Ave Fort Worth, TX | 3.0 | 2.0 | 744 | $1,495 | $2.01 | 1d | 1 | 0.81mi |
| 3417 Clary Ave Fort Worth, TX | 2.0 | 1.0 | 1057 | $1,595 | $1.51 | 16d | 1 | 0.85mi |
| 2001 E 4th St Fort Worth, TX | 2.0 | 1.0–2.0 | 872 | $2,724 | $3.12 | 23d | 42 | 0.91mi |
| 2001 E 4th St Fort Worth, TX | 2.0 | 1.0–2.0 | 872 | $2,759 | $3.16 | 1d | 117 | 0.91mi |
| 2001 E 4th St Unit 11006 Fort Worth, TX | 1.0 | 1.0 | 584 | $1,290 | $2.21 | 46d | 1 | 0.91mi |
| 1852 E Northside Dr Unit 1867 Fort Worth, TX | 1.0 | 1.0 | 691 | $1,460 | $2.11 | 0d | 1 | 0.92mi |
| 1852 E Northside Dr Unit 1867 Fort Worth, TX | 1.0 | 1.0 | 691 | $1,345 | $1.95 | 17d | 1 | 0.92mi |
| 1852 E Northside Dr Unit 1894 Fort Worth, TX | 1.0 | 1.0 | 594 | $1,355 | $2.28 | 0d | 1 | 0.92mi |
| 1852 E Northside Dr Unit 412 Fort Worth, TX | 1.0 | 1.0 | 691 | $1,340 | $1.94 | 16d | 1 | 0.92mi |
| 1852 E Northside Dr Unit 1873 Fort Worth, TX | 1.0 | 1.0 | 691 | $1,305 | $1.89 | 46d | 1 | 0.92mi |
| 1852 E Northside Dr Fort Worth, TX | 2.0 | 2.0 | 1083 | $2,055 | $1.90 | 21d | 1 | 0.93mi |
| 1852 E Northside Dr Fort Worth, TX | 1.0 | 1.0 | 691 | $1,600 | $2.32 | 46d | 1 | 0.93mi |
| 1852 E Northside Dr Fort Worth, TX | 1.0 | 1.0 | 691 | $1,700 | $2.46 | 23d | 1 | 0.93mi |
| 2621 E 12th St Fort Worth, TX | 2.0 | 1.0 | 975 | $1,495 | $1.53 | 24d | 1 | 1.11mi |
| 601 W Beach St Fort Worth, TX | 3.0 | 1.0 | 961 | $1,695 | $1.76 | 23d | 1 | 1.12mi |
| 701 N Hampton St Fort Worth, TX | 1.0–2.0 | 1.0–2.0 | 866 | $2,351 | $2.71 | 0d | 24 | 1.13mi |
| 2104 W Lotus Ave Fort Worth, TX | 2.0 | 1.0 | 1039 | $1,600 | $1.54 | 8d | 1 | 1.14mi |
| 301 Nichols St Unit 316 Fort Worth, TX | 1.0 | 1.0 | 780 | $1,593 | $2.04 | 0d | 1 | 1.26mi |
| 301 Nichols St Unit 316 Fort Worth, TX | 1.0 | 1.0 | 780 | $1,588 | $2.04 | 17d | 1 | 1.26mi |
| 301 Nichols St Unit 412 Fort Worth, TX | 1.0 | 1.0 | 780 | $1,542 | $1.98 | 15d | 1 | 1.26mi |
| 301 Nichols St Fort Worth, TX | 2.0 | 1.0 | 610 | $2,057 | $3.37 | 8d | 4 | 1.27mi |
| 520 Samuels Ave Fort Worth, TX | 3.0 | 1.0–2.0 | 1073 | $1,951 | $1.82 | 0d | 13 | 1.28mi |
| 769 Samuels Ave Fort Worth, TX | 1.0–3.0 | 1.0–3.0 | 1113 | $2,048 | $1.84 | 1d | 27 | 1.28mi |
| 637 Samuels Ave Fort Worth, TX | 1.0–2.0 | 1.0–2.0 | 1079 | $2,544 | $2.36 | 0d | 16 | 1.32mi |
| 100 Harding St Fort Worth, TX | 2.0 | 1.0–2.0 | 869 | $2,665 | $3.06 | 1d | 65 | 1.35mi |
| 2211 Barbell Ln Fort Worth, TX | 2.0 | 1.0 | 718 | $1,295 | $1.80 | 46d | 1 | 1.41mi |
| 701 E Bluff St Fort Worth, TX | 2.0 | 1.0–2.5 | 957 | $2,440 | $2.55 | 0d | 44 | 1.45mi |
Listing history 26 events
-
2026-06-21days on market $164,900 Active 17 DOM
-
2026-06-18days on market $164,900 Active 14 DOM
-
2026-06-17days on market $164,900 Active 13 DOM
-
2026-06-16days on market $164,900 Active 12 DOM
-
2026-06-15days on market $164,900 Active 11 DOM
-
2026-06-13days on market $164,900 Active 9 DOM
-
2026-06-09days on market $164,900 Active 5 DOM
-
2026-06-08days on market $164,900 Active 4 DOM
-
2026-06-07days on market $164,900 Active 3 DOM
-
2026-06-04pricestatusdays on market $164,900 Active 1 DOM
-
2026-05-12historical
-
2026-01-12$175,000 Active
-
2025-07-19historical
-
2025-04-20$185,000 Active
-
2025-02-12soldstatus
-
2025-02-07soldstatus Closed
-
2025-01-24status Pending
-
2025-01-20historical Active Option Contract
-
2025-01-07status Active
-
2024-11-04status Pending
-
2024-10-25historical Active Option Contract
-
2024-08-24price $179,900
-
2024-08-02$199,900 Active
-
2016-01-21soldstatus
-
1996-04-23soldstatus
-
1989-12-10soldstatus
ⓘ Source: listings_history table (triggers on properties + properties_extension) + one-shot
backfill from property_details.listing_events for pre-trigger history.
Tax reassessment forecast TX · Resets to sale price
- Current annual tax
- $5,262 · $439/mo
- Projected year-2 tax
- $5,262 · $439/mo
- Expected delta
- $0/yr ($0/mo · 0.0%)
ⓘ Screening estimate from a state-policy table — verify with the county assessor before closing.
Climate risk First Street
- Flood 1/10 Low FEMA zone X (unshaded) · 0% chance over 30 yrs
- Wildfire 1/10 Low
- Heat 8/10 Severe 7 d/yr ≥109°F today · 23 d/yr by 30 yrs out
- Wind 4/10 Moderate 24% chance of damaging wind over 30 yrs
- Air quality 4/10 Moderate 4 unhealthy d/yr today · 5 by 30 yrs out
Nearby sold comps map
Loading sold comps map…
Walkable amenities ~0.75 mi
Loading nearby amenities…
Taxation est. · year 1
- Rental income
- $22,479
- − Mortgage interest
- −$9,237
- − Property taxes
- −$5,262
- − Insurance
- −$824
- − Repairs & maintenance
- −$1,798
- − Management
- −$1,798
- − Depreciation
- −$4,797
- Taxable loss
- −$1,239
- Est. tax savings @ 24.0%
- +$297
- After-tax cash flow
- $1,592/yr
For passive investors: Depreciation is non-cash, so a rental often shows a tax loss while cash-flowing — sheltering income. Rental losses are passive: they offset passive income freely, and up to $25,000/yr can offset ordinary (W-2) income if you actively participate and your MAGI is under $100k (phasing out to $0 by $150k); unused losses carry forward. On sale, claimed depreciation is recaptured at up to 25%, and gains may owe capital-gains tax (a 1031 exchange can defer both). Figures are a year-1 estimate at your 24.0% rate — not tax advice; consult a CPA.
Schools (NCES district)
- District
- Fort Worth ISD
- NCES district ID
- 4819700
- Math proficiency
- 18% ▼ -16.00%
- Reading proficiency
- 28% ▼ -6.00%
- Median HH income
- $42,109
- Composite
- 19.61/100
- National rank
- #8753
- State rank
- #742 of 826 in TX
Livability — Fort Worth
- Score
- 80/100
- State rank
- #49
- US rank
- #1954
Category grades
Schools grade is shown separately in the Schools card above.
Census & demographics
- Census place
- Fort Worth, TX
- County
- Tarrant County · 2,033,669 people
- City population
- 911,619
- Metro
- Dallas-Fort Worth-Arlington, TX
- Population (ZIP)
- 20,989
- Household income
- $60,194
- Rent vs Own
- Severe rent burden
- 616.0
Population outlook (Tarrant County) Hauer SSP2
- Today (2025)
- 2,380,417 people
- By 2030
- 2,578,900 · +8.3%
- By 2040
- 2,974,995 · +25.0%
- By 2050
- 3,350,489 · +40.8%
- By 2075
- 4,216,909 · +77.2%
- By 2100
- 4,741,527 · +99.2%
Race, ethnicity, and origin ACS 2023
- Neighborhood character
- Predominantly Hispanic (67%)
- Race & ethnicity
- Hispanic / Latino 67% White 24% Two or more races 24% Black 4% Asian 3% Native American 1%
- Hispanic origin (detail)
- Mexican 62%
- Common ancestry
- Slovak 1%
- Foreign-born
- 25% · Canada, Vietnam
- Languages at home
- 45% English-only · Spanish 52% Other Asian/Pacific 1% Vietnamese 1%
Political lean MEDSL · Tarrant
- 2024 margin
- Lean R (+5.1) · D 46.7% · R 51.9% · Other 1.4%
- 2008→2024 swing
- +6.6pp toward D · 2008: -11.7pp · 2024: -5.1pp
- All cycles
- 2024: R+5.1 2020: D+0.2 2016: R+8.7 2012: R+15.7 2008: R+11.7
Not yet ingested
- Civics
- —
Market trends
- HPI YoY
- ▼ -74.75%
- Current HPI
- 315.1072
- Rent YoY
- ▲ 0.45%
- Metro
- Dallas-Fort Worth-Arlington, TX
- State GDP YoY
- ▲ 3.95%
- F500 in state
- 110
Industry mix (Fortune 500 HQ in TX)
| Industry | F500 HQs | Revenue |
|---|---|---|
| Energy | 16 | $1,198B |
|
||
| Technology | 5 | $198B |
|
||
| Engineering / Construction | 4 | $72B |
|
||
| Energy Services | 3 | $60B |
|
||
| Utilities | 3 | $41B |
|
||
| Healthcare | 2 | $330B |
|
||
Price history
-17.5% since first listed17 events — show timeline
- 2026-06-04 Listed $164,900 ForSaleByOwner.com
- 2026-05-12 Listing Removed — NTREIS
- 2026-01-12 Listed $175,000 NTREIS
- 2025-07-19 Listing Removed — NTREIS
- 2025-04-20 Listed $185,000 NTREIS
- 2025-02-12 Sold (Public Records) — Public Records
- 2025-02-07 Sold (MLS) — NTREIS
- 2025-01-24 Pending — NTREIS
- 2025-01-20 Contingent — NTREIS
- 2025-01-07 Relisted — NTREIS
- 2024-11-04 Pending — NTREIS
- 2024-10-25 Contingent — NTREIS
- 2024-08-24 Price Changed $179,900 NTREIS
- 2024-08-02 Listed $199,900 NTREIS
- 2016-01-21 Sold (Public Records) — Public Records
- 1996-04-23 Sold (Public Records) — Public Records
- 1989-12-10 Sold (Public Records) — Public Records
Property tax history
+8.7%/yrLatest (2025): $5,262 · -2.4% YoY. Source: county tax records.
Cash-flow waterfall
monthlySold comps — $/sqft
last 12 mo · ≤1 miLoading sold comps…