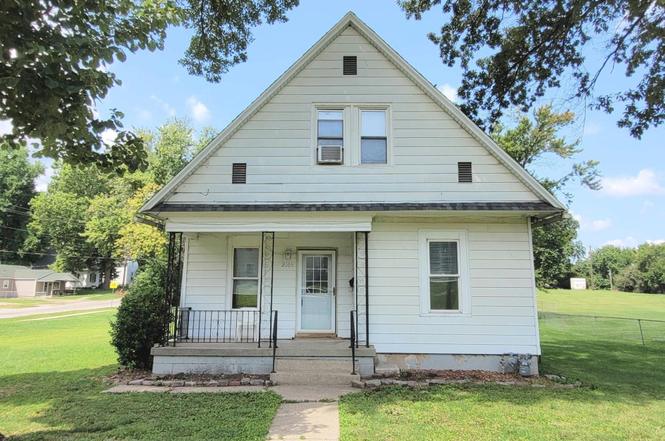
2105 Elizabeth St · Springfield, IL
Flood risk 3/10 · Minor
- FEMA flood zone
- X (unshaded)
- Chance of flooding over 30 yrs
- 0.2%
- Est. flood insurance / yr
- $473 – $860
Fire risk 1/10 · Minimal
- Est. fire insurance / yr
- $804 – $1,492
Heat risk 4/10 · Minor
- Hot days now (above 104°F)
- 7 days/yr
- Hot days in 30 yrs
- 20 days/yr
Wind risk 2/10 · Minimal
- Chance of severe wind over 30 yrs
- 1.0%
Air-quality risk 2/10 · Minimal
- Unhealthy air days now
- 1 days/yr
- Unhealthy air days in 30 yrs
- 1 days/yr
Risk factors via First Street. Map © Google.
Why this score? — see what drove the C+ grade
The composite is a weighted blend of 9 inputs, each scored 0–100. Each bar is that input's sub-score; the figure is the points it added to the 100-point composite (weight × sub-score).
- Cash flow +26.3/30.0
- DSCR +8.9/10.0
- 1% rule +7.9/10.0
- ARV discount +7.5/15.0
- Livability +4.0/5.0
- Rent growth +3.7/5.0
- Condition / age +2.5/5.0
- Schools +1.7/10.0
- Appreciation +0.0/10.0
$100,000
🖨 Deal sheet (PDF) 📄 Offer letter ✓ Due diligence
Listing remarks MLS
Coming Soon!!! Don't let the age of this home fool you. Since buying this home in 2016, most everything has been redone. Walls were stripped to the studs, insulated and re-drywalled or paneled. All plumbing has been replaced with PVC. Whole house has been rewired. Bathroom reconfigured with new tub, sink and toilet. New water heater and HVAC in 2016. New windows, new flooring, new garage door, added 1/2 bath upstairs, added closets including 2 walk-ins, and dishwasher. New roof in 2022 with a 50-year warranty. Porches on front and back. Huge lot that brings in $1,000 - $1500 for State Fair parking. Being sold As-Is.
Key facts
- New electrical
- Huge lot
- Updates since 2016
Tags
Neighborhood map
What this means for you Summary
Snapshot
- This is a 3-bed/1.5-bath other listed at $100k.
Deal economics
- At list price, monthly cash flow is $260 ($3k/yr) — positive.
- The deal already cash-flows at list — no discount required.
- Meets the 1% rule at list price ($1k rent vs $100k).
- Recommended offer: $98k (1.5% below list) — sets the bar for market timing.
- Cap rate 9.4% vs local median 4.9% in Springfield — top-decile yield for the area; either an underpriced asset or a hidden risk that comps aren't pricing in. Stress-test before assuming the spread holds.
Location & tenants
- Location reads 79/100 on livability (#122 in IL, #2,138 nationally) — a middle-class / working-renter tenant base. Strengths: amenities A+, commute A+, cost of living A+; Watch: crime F.
- Springfield SD 186 (urban): math 17% / reading 22% proficiency, ranked #438 of 620 in IL (top 71%) — low school quality limits family demand, transient renter base, plan for 1-2y turnover; 64% free/reduced lunch — lower-income household profile, screen leases tightly.
- Zoned schools: Ridgely Elem School (math 2% / reading 8%, grade F, #1,741 of 2,056 statewide, top 93%, 311 students, 0% FRL); Washington Middle School (math 3% / reading 6%, grade F, #650 of 665 statewide, top 98%, 531 students, 0% FRL); Lanphier High School (math 10% / reading 16%, grade F, #501 of 693 statewide, top 73%, 1,058 students, 0% FRL) — zoned schools average 0% FRL vs 64% district-wide (64 pts lower); this property's tenant base skews higher-income than the district average.
- Zoned-school proficiency averages 8% at this address vs 20% district-wide (-12 pts) — the specific schools serving this property underperform the Springfield SD 186 average; the district grade overstates school quality for this exact location.
- Market conditions: Rents rising fast (+5.0%/yr); 137 active listings in the ZIP; 5 comparable units currently listed for rent nearby; rentals at typical pace (median 23d on market — plan ~3-4 weeks tenant-placement turnaround); 225 units permitted in Sangamon County in 2024 (48 in 5+ unit buildings).
- This rent runs 30% of the median local income ($51k/yr) — at the standard rent-burdened threshold; future hikes will face affordability resistance.
Forward outlook
- Local home prices are declining (-3.0%/yr); year-one equity from $691 of loan paydown is wiped out by about $3k of value loss. Plan a longer hold.
- Sangamon County population projected to shrink 9% by 2050 — rents likely to lag national; underwrite the cash flow, not the appreciation.
- At projected returns (-3.0% appreciation + 5.0% rent growth), your $28k cash investment doubles in ~9 years — after that, you're playing with house money.
Negotiation context
- It's been on market 28 days — a 2% lower offer ($98k) is reasonable based on typical stale-listing flexibility.
- 4 sale attempts since 18y ago with the ask held roughly flat each time — persistent listings suggest the price (not the market) is what's stuck; bring a comps-based counter.
Risks & watch-outs
- Watch-outs: built in 1870 — expect roof / HVAC / electrical / plumbing capex.
Questions for the listing agent
- Built in 1870 — when were the roof, HVAC, electrical panel, plumbing, and water heater last replaced?
- Is there a deadline driving the sale (1031 exchange, divorce, estate, relocation)? That informs how much negotiation room exists.
- Schools are D-rated, which usually means shorter tenancies and higher turnover. Who's the typical renter profile here, and what's been the actual vacancy rate?
- Crime grade is F in this area — have there been break-ins, vandalism, or insurance claims at this property in the last 3 years? What carrier currently insures it and at what premium?
- What's the average days-on-market for RENTAL listings here right now (not sales)? A rising rental-DOM trend means longer vacancies and softer asking-rent achievability than the comps imply.
- What's the recent tenant-quality profile in this submarket — average credit score on applications, eviction rate, late-payment / NSF rate, and stable-employment percentage? A property-management company in the area should have these aggregated.
- How much new for-sale + rental construction is in the pipeline within 1–3 miles? Heavy new supply typically softens prices + rents 12–24 months out; constrained supply supports both.
Investment metrics
- 1% rule
- 1.29% ✓
- Cap rate
- 9.41%
- Cash-on-cash
- 11.12%
- DSCR
- 1.49
- GRM
- 6.5
CMA / ARV
No comps found within radius.
Projected returns pro-forma
-3.0% appreciation · 4.95% rent growth · sell at horizon
- IRR
- 2.7%
- Equity multiple
- 1.11×
- Total profit
- $2,971
- Equity at exit
- $14,910
- IRR
- 14.2%
- Equity multiple
- 2.26×
- Total profit
- $35,150
- Equity at exit
- $8,646
Cash invested: $28,000 (down + closing). Projections, not guarantees.
Landlord ↔ Tenant lean methodology
- Overall (STATE)
- 43 Moderately Tenant-Leaning
- State Illinois
- 43 Moderately Tenant-Leaning · D+7
- County
- — inherits STATE
- City
- — inherits STATE
ZIP-level market 62702
- Home prices YoY
- -34.9%
- Rents YoY
- 5.0%
- Active inventory
- 137
- Price-to-rent
- 6.5×
Monthly cashflow live
- Estimated rent
- $1,291 high interval (Pro) →
- Mortgage (P&I)
- −$524
- Tax from tax record
- −$194 /mo · $2,327/yr
- Insurance
- −$42
- HOA
- −$0
- Lot rent
- −$0
- Vacancy / Maint / Mgmt
- −$271
- Net cashflow
- $260
Break-even live
Sensitivity live
| Price | -10% $316 | -5% $288 | +0% $260 | +5% $231 | +10% $203 |
|---|---|---|---|---|---|
| Rent | -10% $158 | -5% $209 | +0% $260 | +5% $311 | +10% $362 |
| Rate | -1.0pp $310 | -0.5pp $285 | base $260 | +0.5pp $234 | +1.0pp $207 |
UW: 25.0% down · 7.5% · 30yr · 1.5% tax · 5.0% vac · 8.0% maint · 8.0% mgmt
Financing live
Cash to close
- Down payment
- $25,000
- Closing costs
- $3,000
- Reserves months
- —
- Total cash needed
- —
Loan-product check · same deal, 3 products live
Conventional
25% down · 7.5% · 30yr
- Down + closing
- —
- Monthly P&I
- —
- Monthly cashflow
- —
- DSCR
- —
- Eligible?
- —
Personal DTI + credit; lowest rate.
DSCR
20% down · 8.5% · 30yr
- Down + closing
- —
- Monthly P&I
- —
- Monthly cashflow
- —
- DSCR
- —
- Eligible?
- —
No personal income docs; deal must DSCR.
Hard money
10% down · 12.0% · 12mo
- Down + closing
- —
- Monthly P&I
- —
- Monthly cashflow
- —
- DSCR
- —
- Eligible?
- —
Short-term bridge; refi at stabilization.
Rent comps 5 comps
| Address | Beds | Baths | Sqft | Rent | $/sqft | DOM | Units | Dist |
|---|---|---|---|---|---|---|---|---|
| 1413 N 5th St Springfield, IL | 3.0 | 1.0 | 1200 | $1,200 | $1.00 | 23d | 1 | 0.86mi |
| 3501 E Ridgely Ave Unit FR21 Springfield, IL | 3.0 | 2.0 | 1216 | $1,129 | $0.93 | 23d | 1 | 0.97mi |
| 1224 N Rutledge St Springfield, IL | 2.0 | 2.0 | 1200 | $1,400 | $1.17 | 23d | 1 | 1.22mi |
| 920 N 19th St Springfield, IL | 3.0 | 1.0 | 1000 | $1,100 | $1.10 | 23d | 1 | 1.40mi |
| 401 W Elliott Ave Unit A Springfield, IL | 3.0 | 1.0 | 1100 | $1,300 | $1.18 | 46d | 1 | 1.44mi |
Listing history 10 events
-
2026-04-03status Pending
-
2026-03-06$100,000 Active
-
2024-09-27soldstatus $93,000 Closed 623-char remark
Show marketing remark (623 chars)
Coming Soon!!! Don't let the age of this home fool you. Since buying this home in 2016, most everything has been redone. Walls were stripped to the studs, insulated and re-drywalled or paneled. All plumbing has been replaced with PVC. Whole house has been rewired. Bathroom reconfigured with new tub, sink and toilet. New water heater and HVAC in 2016. New windows, new flooring, new garage door, added 1/2 bath upstairs, added closets including 2 walk-ins, and dishwasher. New roof in 2022 with a 50-year warranty. Porches on front and back. Huge lot that brings in $1,000 - $1500 for State Fair parking. Being sold As-Is.
-
2024-08-22status Pending 623-char remark
Show marketing remark (623 chars)
Coming Soon!!! Don't let the age of this home fool you. Since buying this home in 2016, most everything has been redone. Walls were stripped to the studs, insulated and re-drywalled or paneled. All plumbing has been replaced with PVC. Whole house has been rewired. Bathroom reconfigured with new tub, sink and toilet. New water heater and HVAC in 2016. New windows, new flooring, new garage door, added 1/2 bath upstairs, added closets including 2 walk-ins, and dishwasher. New roof in 2022 with a 50-year warranty. Porches on front and back. Huge lot that brings in $1,000 - $1500 for State Fair parking. Being sold As-Is.
-
2024-07-26$99,900 Active 623-char remark
Show marketing remark (623 chars)
Coming Soon!!! Don't let the age of this home fool you. Since buying this home in 2016, most everything has been redone. Walls were stripped to the studs, insulated and re-drywalled or paneled. All plumbing has been replaced with PVC. Whole house has been rewired. Bathroom reconfigured with new tub, sink and toilet. New water heater and HVAC in 2016. New windows, new flooring, new garage door, added 1/2 bath upstairs, added closets including 2 walk-ins, and dishwasher. New roof in 2022 with a 50-year warranty. Porches on front and back. Huge lot that brings in $1,000 - $1500 for State Fair parking. Being sold As-Is.
-
2014-10-03soldstatus $20,100 465-char remark
Show marketing remark (465 chars)
Come and check out this spacious 1.5 story bungalow situated on a large corner lot with convenient access to the State Fair Grounds. The main floor offers a bright living room, kitchen, 2 bedrooms, 1 bath and back enclosed area. The upstairs has a large 3rd bedroom and a den. Other amenities include front covered porch, unfinished basement for storage space and 1c detached garage. Choose FHA financing to qualify for $100 down payment. Equal Housing Opportunity.
-
2014-08-25$20,000 465-char remark
Show marketing remark (465 chars)
Come and check out this spacious 1.5 story bungalow situated on a large corner lot with convenient access to the State Fair Grounds. The main floor offers a bright living room, kitchen, 2 bedrooms, 1 bath and back enclosed area. The upstairs has a large 3rd bedroom and a den. Other amenities include front covered porch, unfinished basement for storage space and 1c detached garage. Choose FHA financing to qualify for $100 down payment. Equal Housing Opportunity.
-
2009-04-07soldstatus $70,000
-
2009-04-01soldstatus $69,900
-
2008-09-21$69,900
ⓘ Source: listings_history table (triggers on properties + properties_extension) + one-shot
backfill from property_details.listing_events for pre-trigger history.
Tax reassessment forecast IL · Partial reset (capped growth)
- Current annual tax
- $2,327 · $194/mo
- Projected year-2 tax
- $2,327 · $194/mo
- Expected delta
- $0/yr ($0/mo · 0.0%)
ⓘ Screening estimate from a state-policy table — verify with the county assessor before closing.
Climate risk First Street
- Flood 3/10 Moderate FEMA zone X (unshaded) · 20% chance over 30 yrs
- Wildfire 1/10 Low
- Heat 4/10 Moderate 7 d/yr ≥104°F today · 20 d/yr by 30 yrs out
- Wind 2/10 Low 100% chance of damaging wind over 30 yrs
- Air quality 2/10 Low 1 unhealthy d/yr today · 1 by 30 yrs out
Nearby sold comps map
Loading sold comps map…
Walkable amenities ~0.75 mi
Loading nearby amenities…
Taxation est. · year 1
- Rental income
- $15,487
- − Mortgage interest
- −$5,602
- − Property taxes
- −$2,327
- − Insurance
- −$500
- − Repairs & maintenance
- −$1,239
- − Management
- −$1,239
- − Depreciation
- −$2,909
- Taxable income
- $1,672
- Est. tax owed @ 24.0%
- −$401
- After-tax cash flow
- $2,714/yr
For passive investors: Depreciation is non-cash, so a rental often shows a tax loss while cash-flowing — sheltering income. Rental losses are passive: they offset passive income freely, and up to $25,000/yr can offset ordinary (W-2) income if you actively participate and your MAGI is under $100k (phasing out to $0 by $150k); unused losses carry forward. On sale, claimed depreciation is recaptured at up to 25%, and gains may owe capital-gains tax (a 1031 exchange can defer both). Figures are a year-1 estimate at your 24.0% rate — not tax advice; consult a CPA.
Schools (NCES district)
- District
- Springfield SD 186
- NCES district ID
- 1737080
- Math proficiency
- 17% ▼ -7.00%
- Reading proficiency
- 22% ▼ -5.00%
- Median HH income
- $43,744
- Composite
- 16.89/100
- National rank
- #9142
- State rank
- #438 of 620 in IL
Livability — Springfield
- Score
- 79/100
- State rank
- #122
- US rank
- #2138
Category grades
Schools grade is shown separately in the Schools card above.
Census & demographics
- Census place
- Springfield, IL
- County
- Sangamon County · 115,414 people
- City population
- 59,955
- Metro
- Springfield, IL
- Population (ZIP)
- 31,033
- Household income
- $51,136
- Rent vs Own
- Severe rent burden
- 1230.0
Population outlook (Sangamon County) Hauer SSP2
- Today (2025)
- 198,317 people
- By 2030
- 196,127 · -1.1%
- By 2040
- 188,664 · -4.9%
- By 2050
- 179,624 · -9.4%
- By 2075
- 155,027 · -21.8%
- By 2100
- 122,588 · -38.2%
Race, ethnicity, and origin ACS 2023
- Neighborhood character
- Predominantly White (72%)
- Race & ethnicity
- White 72% Black 17% Two or more races 8% Hispanic / Latino 3%
- Common ancestry
- Romanian 2% Slovak 2% Serbian 1%
- Foreign-born
- 2% · Canada
- Languages at home
- 96% English-only · Spanish 1% French/Haitian/Cajun 1% Other Indo-European 1%
Political lean MEDSL · Sangamon
- 2024 margin
- Toss-up / Even · D 46.6% · R 51.6% · Other 1.8%
- 2008→2024 swing
- -9.3pp toward R · 2008: 4.4pp · 2024: -5.0pp
- All cycles
- 2024: R+5.0 2020: R+4.4 2016: R+9.4 2012: R+8.7 2008: D+4.4
Not yet ingested
- Civics
- —
Market trends
- HPI YoY
- ▼ -79.98%
- Current HPI
- 149.1926
- Rent YoY
- ▲ 4.95%
- Metro
- Springfield, IL
- State GDP YoY
- ▲ 1.59%
- F500 in state
- 60
Industry mix (Fortune 500 HQ in IL)
| Industry | F500 HQs | Revenue |
|---|---|---|
| Insurance | 4 | $201B |
|
||
| Consumer Goods | 4 | $87B |
|
||
| Industrial Machinery | 3 | $64B |
|
||
| Healthcare | 2 | $55B |
|
||
| Retail / Pharmacy | 1 | $148B |
|
||
| Agriculture / Food | 1 | $86B |
|
||
Price history
+43.1% since first listed10 events — show timeline
- 2026-04-03 Pending — RMLSA as Distributed by MLS Grid
- 2026-03-06 Listed $100,000 RMLSA as Distributed by MLS Grid
- 2024-09-27 Sold (MLS) $93,000 RMLSA as Distributed by MLS Grid
- 2024-08-22 Pending — RMLSA as Distributed by MLS Grid
- 2024-07-26 Listed $99,900 RMLSA as Distributed by MLS Grid
- 2014-10-03 Sold (MLS) $20,100 RMLSA as Distributed by MLS Grid
- 2014-08-25 Listed $20,000 RMLSA as Distributed by MLS Grid
- 2009-04-07 Sold (Public Records) $70,000 Public Records
- 2009-04-01 Sold (MLS) $69,900 RMLSA as Distributed by MLS Grid
- 2008-09-21 Listed $69,900 RMLSA as Distributed by MLS Grid
Property tax history
+5.7%/yrLatest (2024): $2,327 · +4.0% YoY. Source: county tax records.
Cash-flow waterfall
monthlySold comps — $/sqft
last 12 mo · ≤1 miLoading sold comps…