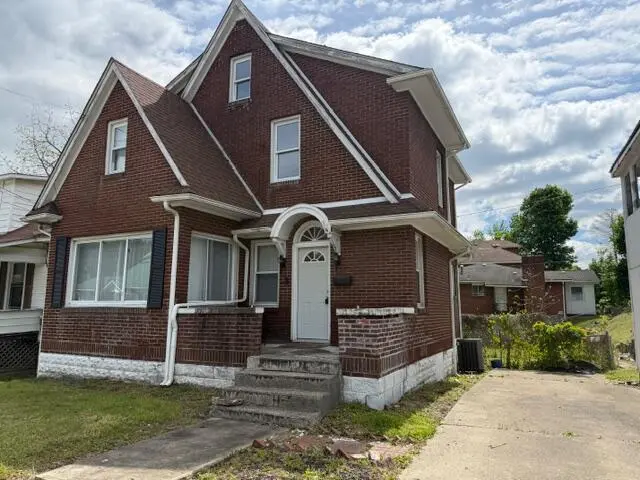
107 E C St · Beckley, WV
Flood risk 4/10 · Minor
- FEMA flood zone
- X (unshaded)
- Chance of flooding over 30 yrs
- 0.24%
- Est. flood insurance / yr
- $473 – $860
Fire risk 3/10 · Minor
- Est. fire insurance / yr
- $787 – $1,461
Heat risk 3/10 · Minor
- Hot days now (above 91°F)
- 7 days/yr
- Hot days in 30 yrs
- 20 days/yr
Wind risk 1/10 · Minimal
- Chance of severe wind over 30 yrs
- —
Air-quality risk 1/10 · Minimal
- Unhealthy air days now
- 0 days/yr
- Unhealthy air days in 30 yrs
- 0 days/yr
Risk factors via First Street. Map © Google.
Why this score? — see what drove the B+ grade
The composite is a weighted blend of 9 inputs, each scored 0–100. Each bar is that input's sub-score; the figure is the points it added to the 100-point composite (weight × sub-score).
- Cash flow +30.0/30.0
- ARV discount +15.0/15.0
- DSCR +10.0/10.0
- 1% rule +8.5/10.0
- Rent growth +3.6/5.0
- Schools +3.0/10.0
- Livability +3.0/5.0
- Condition / age +2.5/5.0
- Appreciation +0.0/10.0
$104,999
🖨 Deal sheet 📄 Offer letter ✓ Due diligence
Listing remarks MLS
4-bedroom brick home close to WVU Tech. Hardwood floors throughout. High ceilings, walk in closets, sunroom, and formal dining room. Level fenced in back yard with large deck. Great investment potential!
Key facts
- Wood stove
- Natural gas heat
- Sunroom
Tags
Property features AI
Exterior
- Utilities: Public water; Public sewer
- Home design: Residential property; 2-story
- Construction: Brick construction; Concrete perimeter foundation; Built on a 0.06-acre lot
- Exterior features: Shingle roof
Interior
- Kitchen: Microwave; Refrigerator; Oven
- Flooring: Ceramic tile; Hardwood
- Bathrooms: 2 full bathrooms
- Heating & cooling: Central air conditioning; Forced air heating
- Interior features: Tile countertops; Window treatments; Wood-burning stove in the living room; Fireplace
Neighborhood map
What this means for you Summary
Snapshot
- This is a 4-bed/1.5-bath single-family listed at $105k.
Deal economics
- At list price, monthly cash flow is $506 ($6k/yr) — positive.
- The deal already cash-flows at list — no discount required.
- Meets the 1% rule at list price ($1k rent vs $105k).
- Cap rate 12.1% vs local median 7.0% in Beckley — top-decile yield for the area; either an underpriced asset or a hidden risk that comps aren't pricing in. Stress-test before assuming the spread holds.
Location & tenants
- Location reads 59/100 on livability (#235 in WV) — a working-class tenant base; expect higher turnover. Strengths: cost of living A+, housing A-; Watch: employment D, schools D-, crime F.
- Raleigh County Schools (rural): math 29% / reading 42% proficiency, ranked #14 of 55 in WV (top 26%) — families likely to look elsewhere, expect single-tenant / working-renter base with shorter leases.
- Market conditions: Rents rising fast (+4.2%/yr); 112 active listings in the ZIP; 41 units permitted in Raleigh County in 2024 (0 in 5+ unit buildings).
- This rent runs 30% of the median local income ($57k/yr) — at the standard rent-burdened threshold; future hikes will face affordability resistance.
Forward outlook
- Local home prices are declining (-3.0%/yr); year-one equity from $726 of loan paydown is wiped out by about $3k of value loss. Plan a longer hold.
- Raleigh County population projected at -16% by 2050 — secular population decline; favor cash flow + early exit over multi-decade hold.
- At projected returns (-3.0% appreciation + 4.2% rent growth), your $29k cash investment doubles in ~6 years — after that, you're playing with house money.
Negotiation context
- Only 7 days on market — expect competitive offers; lowballing is unlikely to land.
- 2 sale attempts since 4y ago with the ask held roughly flat each time — persistent listings suggest the price (not the market) is what's stuck; bring a comps-based counter.
- Current owner paid $64k; list at $105k implies a 64% gain — meaningful room to come down on a strong offer.
Risks & watch-outs
- Watch-outs: built in 1931 — expect roof / HVAC / electrical / plumbing capex.
Questions for the listing agent
- Built in 1931 — when were the roof, HVAC, electrical panel, plumbing, and water heater last replaced?
- Is there a deadline driving the sale (1031 exchange, divorce, estate, relocation)? That informs how much negotiation room exists.
- Schools are D-rated, which usually means shorter tenancies and higher turnover. Who's the typical renter profile here, and what's been the actual vacancy rate?
- Crime grade is F in this area — have there been break-ins, vandalism, or insurance claims at this property in the last 3 years? What carrier currently insures it and at what premium?
- What's the average days-on-market for RENTAL listings here right now (not sales)? A rising rental-DOM trend means longer vacancies and softer asking-rent achievability than the comps imply.
- What's the recent tenant-quality profile in this submarket — average credit score on applications, eviction rate, late-payment / NSF rate, and stable-employment percentage? A property-management company in the area should have these aggregated.
- How much new for-sale + rental construction is in the pipeline within 1–3 miles? Heavy new supply typically softens prices + rents 12–24 months out; constrained supply supports both.
Investment metrics
- 1% rule
- 1.35% ✓
- Cap rate
- 12.07%
- Cash-on-cash
- 20.65%
- DSCR
- 1.92
- GRM
- 6.2
CMA / ARV
- ARV (on-the-fly)
- $130,634
- Comps found
- 12
Show comp detail 12 sales within ~0.75 mi
| Address | Dist | Beds/Ba | Sqft | Sold | Price | $/sf | Match |
|---|---|---|---|---|---|---|---|
| 111 Grove Ave | 0.32mi | 3/1.5 (-1) | 1,448 (-5%) | 0mo | $162,000 | $112 | 72 |
| 144 Jefferson St | 0.35mi | 3/2.0 (-1) | 1,366 (-10%) | 10mo | $199,000 | $146 | 52 |
| 303 East Prince St | 0.41mi | 3/2.0 (-1) | 1,316 (-13%) | 4mo | $85,000 | $65 | 48 |
| 115 Williams St | 0.44mi | 3/3.0 (-1) | 1,676 (+10%) | 4mo | $139,900 | $83 | 48 |
| 111 Mool | 0.64mi | 4/2.0 | 1,386 (-9%) | 8mo | $28,500 | $21 | 47 |
| 110 Winger Ave | 0.52mi | 3/2.5 (-1) | 1,344 (-12%) | 2mo | $170,500 | $127 | 46 |
| 319 Allen Ave Ave | 0.71mi | 3/2.0 (-1) | 1,568 (+3%) | 10mo | $107,000 | $68 | 46 |
| 107 Croft St | 0.71mi | 3/1.5 (-1) | 1,628 (+7%) | 5mo | $140,000 | $86 | 45 |
| 209 Belle Vue Ln | 0.74mi | 3/1.5 (-1) | 1,604 (+6%) | 10mo | $52,000 | $32 | 43 |
| 308 Orchard Ave | 0.68mi | 4/1.5 | 1,705 (+12%) | 10mo | $145,000 | $85 | 40 |
| 403 G St | 0.53mi | 3/2.0 (-1) | 1,746 (+15%) | 5mo | $164,000 | $94 | 39 |
| 907 Woodlawn Ave | 0.60mi | 3/1.5 (-1) | 1,313 (-14%) | 8mo | $167,000 | $127 | 38 |
Match score weights: distance 35% · size 25% · config 20% · recency 20%. Top-matched comps best support the ARV.
Projected returns pro-forma
-3.0% appreciation · 4.25% rent growth · sell at horizon
- IRR
- 14.2%
- Equity multiple
- 1.58×
- Total profit
- $16,967
- Equity at exit
- $15,656
- IRR
- 23.8%
- Equity multiple
- 3.17×
- Total profit
- $63,693
- Equity at exit
- $9,078
Cash invested: $29,400 (down + closing). Projections, not guarantees.
Landlord ↔ Tenant lean methodology
- Overall (STATE)
- 83 Strongly Landlord-Friendly
- State West Virginia
- 83 Strongly Landlord-Friendly · R+22
- County
- — inherits STATE
- City
- — inherits STATE
ZIP-level market 25801
- Home prices YoY
- -17.8%
- Rents YoY
- 4.2%
- Active inventory
- 112
- Price-to-rent
- 6.2×
Monthly cashflow live
- Estimated rent
- $1,422 medium interval (Pro) →
- Mortgage (P&I)
- −$551
- Tax from tax record
- −$23 /mo · $274/yr
- Insurance
- −$44
- HOA
- −$0
- Vacancy / Maint / Mgmt
- −$299
- Net cashflow
- $506
Break-even live
UW: 25.0% down · 7.5% · 30yr · 1.5% tax · 5.0% vac · 8.0% maint · 8.0% mgmt
Financing live
Cash to close
- Down payment
- $26,250
- Closing costs
- $3,150
- Reserves months
- —
- Total cash needed
- —
Loan-product check · same deal, 3 products live
Conventional
25% down · 7.5% · 30yr
- Down + closing
- —
- Monthly P&I
- —
- Monthly cashflow
- —
- DSCR
- —
- Eligible?
- —
Personal DTI + credit; lowest rate.
DSCR
20% down · 8.5% · 30yr
- Down + closing
- —
- Monthly P&I
- —
- Monthly cashflow
- —
- DSCR
- —
- Eligible?
- —
No personal income docs; deal must DSCR.
Hard money
10% down · 12.0% · 12mo
- Down + closing
- —
- Monthly P&I
- —
- Monthly cashflow
- —
- DSCR
- —
- Eligible?
- —
Short-term bridge; refi at stabilization.
Listing history 8 events
-
2026-06-15statusdays on market $104,999 Pending 7 DOM
-
2026-06-14days on market $104,999 Active 6 DOM
-
2026-06-12status $104,999 Active 5 DOM
-
2026-05-17status Pending
-
2026-05-12$104,999 Active
-
2022-10-21soldstatus $64,000 203-char remark
Show marketing remark (203 chars)
4-bedroom brick home close to WVU Tech. Hardwood floors throughout. High ceilings, walk in closets, sunroom, and formal dining room. Level fenced in back yard with large deck. Great investment potential!
-
2022-08-25$68,000 203-char remark
Show marketing remark (203 chars)
4-bedroom brick home close to WVU Tech. Hardwood floors throughout. High ceilings, walk in closets, sunroom, and formal dining room. Level fenced in back yard with large deck. Great investment potential!
-
2000-06-15soldstatus $53,000
ⓘ Source: listings_history table (triggers on properties + properties_extension) + one-shot
backfill from property_details.listing_events for pre-trigger history.
Tax reassessment forecast WV · Resets to sale price
- Current annual tax
- $274 · $23/mo
- Projected year-2 tax
- $619 · $52/mo
- Expected delta
- +$346/yr (+$29/mo · 126.5%)
ⓘ Screening estimate from a state-policy table — verify with the county assessor before closing.
Climate risk First Street
- Flood 4/10 Moderate FEMA zone X (unshaded) · 24% chance over 30 yrs
- Wildfire 3/10 Moderate
- Heat 3/10 Moderate 7 d/yr ≥91°F today · 20 d/yr by 30 yrs out
- Wind 1/10 Low
- Air quality 1/10 Low 0 unhealthy d/yr today · 0 by 30 yrs out
Nearby sold comps map
Loading sold comps map…
Walkable amenities ~0.75 mi
Loading nearby amenities…
Taxation est. · year 1
- Rental income
- $17,058
- − Mortgage interest
- −$5,882
- − Property taxes
- −$274
- − Insurance
- −$525
- − Repairs & maintenance
- −$1,365
- − Management
- −$1,365
- − Depreciation
- −$3,055
- Taxable income
- $4,594
- Est. tax owed @ 24.0%
- −$1,103
- After-tax cash flow
- $4,967/yr
For passive investors: Depreciation is non-cash, so a rental often shows a tax loss while cash-flowing — sheltering income. Rental losses are passive: they offset passive income freely, and up to $25,000/yr can offset ordinary (W-2) income if you actively participate and your MAGI is under $100k (phasing out to $0 by $150k); unused losses carry forward. On sale, claimed depreciation is recaptured at up to 25%, and gains may owe capital-gains tax (a 1031 exchange can defer both). Figures are a year-1 estimate at your 24.0% rate — not tax advice; consult a CPA.
Schools (NCES district)
- District
- Raleigh County Schools
- NCES district ID
- 5401230
- Math proficiency
- 29% ▼ -8.00%
- Reading proficiency
- 42% ▼ -3.00%
- Median HH income
- $39,828
- Composite
- 29.74/100
- National rank
- #6445
- State rank
- #14 of 55 in WV
Livability — Beckley
- Score
- 59/100
- State rank
- #235
- US rank
- #20551
Category grades
Schools grade is shown separately in the Schools card above.
Census & demographics
- Census place
- Beckley, WV
- County
- Raleigh County · 31,128 people
- City population
- 31,128
- Metro
- Beckley, WV
- Population (ZIP)
- 31,128
- Household income
- $56,836
- Rent vs Own
- Severe rent burden
- 1384.0
Population outlook (Raleigh County) Hauer SSP2
- Today (2025)
- 73,505 people
- By 2030
- 70,954 · -3.5%
- By 2040
- 66,038 · -10.2%
- By 2050
- 61,919 · -15.8%
- By 2075
- 51,954 · -29.3%
- By 2100
- 39,724 · -46.0%
Race, ethnicity, and origin ACS 2023
- Neighborhood character
- Predominantly White (81%)
- Race & ethnicity
- White 81% Black 10% Two or more races 7% Hispanic / Latino 2% Asian 2%
- Common ancestry
- Slovak 2% Italian 1% Lithuanian 1%
- Foreign-born
- 2% · Canada
- Languages at home
- 96% English-only · Spanish 2% Other Indo-European 1%
Political lean MEDSL · Raleigh
- 2024 margin
- Solid R (+54.3) · D 22.0% · R 76.3% · Other 1.6%
- 2008→2024 swing
- -28.5pp toward R · 2008: -25.9pp · 2024: -54.3pp
- All cycles
- 2024: R+54.3 2020: R+50.4 2016: R+52.8 2012: R+44.6 2008: R+25.9
Not yet ingested
- Civics
- —
Market trends
- HPI YoY
- ▼ -45.60%
- Current HPI
- 210.0114
- Rent YoY
- ▲ 4.25%
- Metro
- Beckley, WV
- State GDP YoY
- —
- F500 in state
- 0
Price history
+98.1% since first listed5 events — show timeline
- 2026-05-17 Pending — GVBOR
- 2026-05-12 Listed $104,999 GVBOR
- 2022-10-21 Sold (MLS) $64,000 BBOR
- 2022-08-25 Listed $68,000 BBOR
- 2000-06-15 Sold (Public Records) $53,000 Public Records
Property tax history
-10.7%/yrLatest (2025): $274 · +21.6% YoY. Source: county tax records.
Cash-flow waterfall
monthlySold comps — $/sqft
last 12 mo · ≤1 miLoading sold comps…