10138 S 45th Ter · Golf, FL
Flood risk 4/10 · Minor
- FEMA flood zone
- X (unshaded)
- Chance of flooding over 30 yrs
- 0.2%
- Est. flood insurance / yr
- $507 – $1,088
Fire risk 1/10 · Minimal
- Est. fire insurance / yr
- $947 – $1,759
Heat risk 10/10 · Severe
- Hot days now (above 106°F)
- 7 days/yr
- Hot days in 30 yrs
- 29 days/yr
Wind risk 10/10 · Severe
- Chance of severe wind over 30 yrs
- 99.0%
Air-quality risk 2/10 · Minimal
- Unhealthy air days now
- 1 days/yr
- Unhealthy air days in 30 yrs
- 2 days/yr
Risk factors via First Street. Map © Google.
Why this score? — see what drove the C- grade
The composite is a weighted blend of 9 inputs, each scored 0–100. Each bar is that input's sub-score; the figure is the points it added to the 100-point composite (weight × sub-score).
- Cash flow +17.6/30.0
- 1% rule +10.0/10.0
- ARV discount +7.5/15.0
- DSCR +5.5/10.0
- Schools +4.3/10.0
- Livability +3.2/5.0
- Condition / age +2.5/5.0
- Rent growth +2.4/5.0
- Appreciation +0.0/10.0
$159,900
🖨 Deal sheet 📄 Offer letter ✓ Due diligence
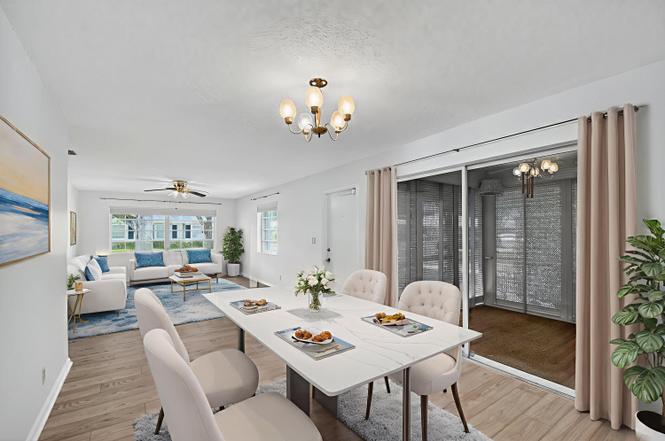
Listing remarks
Welcome to this well maintained 2 bedroom/2 bath villa, freshly painted and ready for you to call home. Enjoy easy living with no carpeting. This home features ceramic tile and new laminate plank flooring for a clean, modern feel and low-maintenance lifestyle. The spacious layout offers comfortable living and dining areas, a well-appointed kitchen, and two generously sized bedrooms, each with ample closet space. Maintenance includes cable, common areas, insurance on building, lawn care, maintenance -exterior, roof maintenance, sewer, trash removal, outdoor pest control and water. Community offers three heated pools (villa convenient to one of them), fitness center, tennis, pickleball, billi
Key facts
- Tennis
- Fitness center
- Ceramic tile
Tags
Neighborhood map
What this means for you Summary
Snapshot
- This is a 2-bed/2.0-bath single-family listed at $160k.
Deal economics
- At list price, monthly cash flow is $127 ($2k/yr) — positive.
- The deal already cash-flows at list — no discount required.
- Meets the 1% rule at list price ($2k rent vs $160k).
- Recommended offer: $141k (12.0% below list) — sets the bar for market timing.
Location & tenants
- Location reads 63/100 on livability (#703 in FL) — a middle-class / working-renter tenant base. Strengths: crime A+, employment A+, housing A+; Watch: amenities F, commute F, cost of living F.
- Palm Beach (suburban): math 46% / reading 53% proficiency, ranked #34 of 73 in FL (top 47%) — families likely to look elsewhere, expect single-tenant / working-renter base with shorter leases.
- Zoned schools: Crosspointe Elementary School (math 36% / reading 45%, grade F, #1,471 of 2,144 statewide, top 69%, 652 students, 75% FRL); Congress Community Middle School (math 21% / reading 28%, grade F, #522 of 571 statewide, top 93%, 988 students, 72% FRL); Boynton Beach Community High (math 13% / reading 25%, grade F, #565 of 667 statewide, top 85%, 1,547 students, 65% FRL) — zoned schools average 71% FRL vs 52% district-wide (19 pts higher); higher-poverty schools than district average — tighter screening recommended.
- Zoned-school proficiency averages 28% at this address vs 50% district-wide (-22 pts) — the specific schools serving this property underperform the Palm Beach average; the district grade overstates school quality for this exact location.
- Market conditions: Rents soft (-0.6%/yr); 445 active listings in the ZIP; 40 comparable units currently listed for rent nearby; rentals at typical pace (median 24d on market — plan ~3-4 weeks tenant-placement turnaround); solid renter incomes; 3,974 units permitted in Palm Beach County in 2024 (1,012 in 5+ unit buildings).
- This rent runs 38% of the median local income ($76k/yr) — at the standard rent-burdened threshold; future hikes will face affordability resistance.
Forward outlook
- Local home prices are declining (-3.0%/yr); year-one equity from $1k of loan paydown is wiped out by about $5k of value loss. Plan a longer hold.
- Palm Beach County population projected at +30% by 2050 — long-run rental-demand tailwind backs the buy-and-hold thesis.
Negotiation context
- It's been on market 232 days — a 12% lower offer ($141k) is reasonable based on typical stale-listing flexibility.
Risks & watch-outs
- Watch-outs: HOA is 28% of rent.
- Climate carrying-cost: severe wind risk, 99% chance of damaging wind over 30y; extreme-heat days projected 7→29/yr by 2055 (HVAC capex compounding) — expect insurance premiums to compound above CPI over the hold.
Questions for the listing agent
- It's been on market 232 days. Have you received any prior offers? Is the seller open to a 12% concession, seller financing, or rate buy-down credit?
- What does the HOA fee cover, when was the last increase, and are there any pending special assessments or reserve-fund shortfalls?
- Why hasn't it sold? Are there any deal-killer items the seller is aware of (foundation, flood, title, zoning, code violations)?
- Is there a deadline driving the sale (1031 exchange, divorce, estate, relocation)? That informs how much negotiation room exists.
- What's the average days-on-market for RENTAL listings here right now (not sales)? A rising rental-DOM trend means longer vacancies and softer asking-rent achievability than the comps imply.
- What's the recent tenant-quality profile in this submarket — average credit score on applications, eviction rate, late-payment / NSF rate, and stable-employment percentage? A property-management company in the area should have these aggregated.
- How much new for-sale + rental construction is in the pipeline within 1–3 miles? Heavy new supply typically softens prices + rents 12–24 months out; constrained supply supports both.
Investment metrics
- 1% rule
- 1.52% ✓
- Cap rate
- 7.25%
- Cash-on-cash
- 3.41%
- DSCR
- 1.15
- GRM
- 5.5
CMA / ARV
No comps found within radius.
Projected returns pro-forma
-3.0% appreciation · 0.0% rent growth · sell at horizon
- IRR
- -16.1%
- Equity multiple
- 0.45×
- Total profit
- $-24,453
- Equity at exit
- $23,842
- IRR
- -19.6%
- Equity multiple
- 0.19×
- Total profit
- $-36,451
- Equity at exit
- $13,825
Cash invested: $44,772 (down + closing). Projections, not guarantees.
Landlord ↔ Tenant lean methodology
- Overall (STATE)
- 87 Strongly Landlord-Friendly
- State Florida
- 87 Strongly Landlord-Friendly · R+3
- County
- — inherits STATE
- City
- — inherits STATE
ZIP-level market 33436
- Home prices YoY
- -26.0%
- Rents YoY
- -0.6%
- Active inventory
- 445
- Price-to-rent
- 5.5×
Monthly cashflow live
- Estimated rent
- $2,423 high interval (Pro) →
- Mortgage (P&I)
- −$839
- Tax est. 1.5%
- −$200 /mo · $2,398/yr
- Insurance
- −$67
- HOA
- −$682
- Vacancy / Maint / Mgmt
- −$509
- Net cashflow
- $127
Break-even live
UW: 25.0% down · 7.5% · 30yr · 1.5% tax · 5.0% vac · 8.0% maint · 8.0% mgmt
Financing live
Cash to close
- Down payment
- $39,975
- Closing costs
- $4,797
- Reserves months
- —
- Total cash needed
- —
Loan-product check · same deal, 3 products live
Conventional
25% down · 7.5% · 30yr
- Down + closing
- —
- Monthly P&I
- —
- Monthly cashflow
- —
- DSCR
- —
- Eligible?
- —
Personal DTI + credit; lowest rate.
DSCR
20% down · 8.5% · 30yr
- Down + closing
- —
- Monthly P&I
- —
- Monthly cashflow
- —
- DSCR
- —
- Eligible?
- —
No personal income docs; deal must DSCR.
Hard money
10% down · 12.0% · 12mo
- Down + closing
- —
- Monthly P&I
- —
- Monthly cashflow
- —
- DSCR
- —
- Eligible?
- —
Short-term bridge; refi at stabilization.
Rent comps 40 comps
| Address | Beds | Baths | Sqft | Rent | $/sqft | DOM | Units | Dist |
|---|---|---|---|---|---|---|---|---|
| 4525 Nutmeg Tree Ln Unit A Boynton Beach, FL | 2.0 | 2.0 | 1404 | $3,000 | $2.14 | 24d | 1 | 0.16mi |
| 9940 Bauhinia Tree Way Unit B Boynton Beach, FL | 1.0 | 1.0 | 1200 | $2,000 | $1.67 | 24d | 1 | 0.20mi |
| 9940 Bauhinia Tree Way Unit B Boynton Beach, FL | 1.0 | 1.0 | 1200 | $1,800 | $1.50 | 7d | 1 | 0.20mi |
| 9900 Pineapple Tree Dr #106 Boynton Beach, FL | 2.0 | 2.0 | 1008 | $2,250 | $2.23 | 24d | 1 | 0.31mi |
| 9935 Pineapple Tree Dr #202 Boynton Beach, FL | 2.0 | 2.0 | 1008 | $2,575 | $2.55 | 15d | 1 | 0.33mi |
| 9873 Lawrence Rd Boynton Beach, FL | 2.0 | 2.0 | 1200 | $2,315 | $1.93 | 4d | 1 | 0.52mi |
| 9873 Lawrence Rd Boynton Beach, FL | 2.0 | 2.0 | 1200 | $2,267 | $1.89 | 22d | 1 | 0.52mi |
| 4944 Equestrian Cir Unit A Boynton Beach, FL | 2.0 | 2.0 | 1400 | $2,500 | $1.79 | 7d | 1 | 0.55mi |
| 5020 Ashley Lake Dr Boynton Beach, FL | 2.0 | 2.0 | 1002 | $2,394 | $2.39 | 3d | 1 | 0.65mi |
| 5020 Ashley Lake Dr Boynton Beach, FL | 1.0 | 1.0 | 784 | $2,074 | $2.65 | 24d | 1 | 0.65mi |
| 5020 Ashley Lake Dr Boynton Beach, FL | 2.0 | 2.0 | 1002 | $2,346 | $2.34 | 14d | 1 | 0.65mi |
| 5157 Floria Way Unit J Boynton Beach, FL | 3.0 | 2.0 | 1447 | $3,300 | $2.28 | 24d | 1 | 0.74mi |
| 5217 Cedar Lake Rd Boynton Beach, FL | 1.0–3.0 | 1.0–2.0 | 1030 | $2,266 | $2.20 | 1d | 51 | 0.75mi |
| 9498 S Military Trl #5 Boynton Beach, FL | 3.0 | 2.5 | 1317 | $2,900 | $2.20 | 24d | 1 | 0.79mi |
| 5155 Europa Dr Unit J Boynton Beach, FL | 3.0 | 2.0 | 1333 | $2,750 | $2.06 | 24d | 1 | 0.81mi |
| 5133 Brisata Cir Unit P Boynton Beach, FL | 3.0 | 2.0 | 1374 | $2,800 | $2.04 | 24d | 1 | 0.81mi |
| 9746 Nickels Blvd Boynton Beach, FL | 2.0 | 2.0 | 1215 | $2,800 | $2.30 | 24d | 1 | 0.90mi |
| 10187 Mangrove Dr #104 Boynton Beach, FL | 2.0 | 2.0 | 1260 | $2,350 | $1.87 | 24d | 1 | 0.93mi |
| 4249 Quail Ridge Dr N Unit A Boynton Beach, FL | 2.0 | 2.0 | 1212 | $4,000 | $3.30 | 24d | 1 | 0.98mi |
| 5418 Firenze Dr Unit P Boynton Beach, FL | 2.0 | 2.0 | 1139 | $2,400 | $2.11 | 3d | 1 | 1.01mi |
| 10592 Tropic Palm Ave #202 Boynton Beach, FL | 2.0 | 2.0 | 1385 | $2,450 | $1.77 | 24d | 1 | 1.03mi |
| 4116 Quail Ridge Dr N Unit A Boynton Beach, FL | 2.0 | 2.0 | 1267 | $3,800 | $3.00 | 24d | 1 | 1.03mi |
| 10056 Boynton Place Cir Boynton Beach, FL | 3.0 | 2.0 | 1253 | $2,950 | $2.35 | 2d | 1 | 1.04mi |
| 10056 Boynton Place Cir Boynton Beach, FL | 3.0 | 2.0 | 1253 | $3,000 | $2.39 | 24d | 1 | 1.04mi |
| 10624 Tropic Palm Ave #202 Boynton Beach, FL | 3.0 | 2.0 | 1385 | $2,550 | $1.84 | 24d | 1 | 1.07mi |
| 5275 Europa Dr Unit I Boynton Beach, FL | 3.0 | 2.0 | 1282 | $2,500 | $1.95 | 1d | 1 | 1.07mi |
| 5373 Mirror Lakes Blvd Boynton Beach, FL | 3.0 | 2.0 | 1310 | $2,100 | $1.60 | 24d | 1 | 1.11mi |
| 3561 Oberon Ave Boynton Beach, FL | 3.0 | 2.0 | 1248 | $2,850 | $2.28 | 20d | 1 | 1.13mi |
| 10423 Boynton Place Cir Boynton Beach, FL | 2.0 | 1.0 | 861 | $2,200 | $2.56 | 18d | 1 | 1.14mi |
| 10423 Boynton Place Cir Boynton Beach, FL | 2.0 | 1.0 | 861 | $2,200 | $2.56 | 7d | 1 | 1.14mi |
| 10492 Boynton Place Cir Boynton Beach, FL | 1.0–3.0 | 1.0–2.0 | 1017 | $2,375 | $2.33 | 1d | 19 | 1.16mi |
| 401 Belmont Pl Boynton Beach, FL | 2.0 | 2.0 | 1143 | $2,300 | $2.01 | 24d | 1 | 1.20mi |
| 1201 Belmont Pl Boynton Beach, FL | 2.0 | 2.0 | 1143 | $2,400 | $2.10 | 24d | 1 | 1.20mi |
| 204 Belmont Pl Boynton Beach, FL | 1.0 | 1.0 | 878 | $2,200 | $2.51 | 24d | 1 | 1.20mi |
| 1101 Belmont Pl #1101 Boynton Beach, FL | 2.0 | 2.0 | 1143 | $2,300 | $2.01 | 20d | 1 | 1.20mi |
| 1201 Belmont Pl Boynton Beach, FL | 2.0 | 2.0 | 1143 | $2,400 | $2.10 | 19d | 1 | 1.20mi |
| 5724 Boynton Cres Boynton Beach, FL | 2.0 | 1.0 | 861 | $2,300 | $2.67 | 24d | 1 | 1.20mi |
| 8949 Oak St Boynton Beach, FL | 2.0 | 2.0 | 1040 | $1,300 | $1.25 | 24d | 1 | 1.23mi |
| 3736 Coelebs Ave Boynton Beach, FL | 3.0 | 2.0 | 1232 | $3,000 | $2.44 | 24d | 1 | 1.30mi |
| 2788 Wood Fern Dr Boynton Beach, FL | 2.0 | 2.0 | 1472 | $2,900 | $1.97 | 24d | 1 | 1.38mi |
HOA detail
- Monthly dues
- $682 · $8,184/yr
- Likely covers
- watersewertrashcablelandscapingroofpoolgym
Listing history 5 events
-
2026-04-24status Pending
-
2026-04-21price $159,900
-
2026-02-14price $179,900
-
2025-10-31price $192,000
-
2025-09-04$200,000 Active
ⓘ Source: listings_history table (triggers on properties + properties_extension) + one-shot
backfill from property_details.listing_events for pre-trigger history.
Climate risk First Street
- Flood 4/10 Moderate FEMA zone X (unshaded) · 20% chance over 30 yrs
- Wildfire 1/10 Low
- Heat 10/10 Extreme 7 d/yr ≥106°F today · 29 d/yr by 30 yrs out
- Wind 10/10 Extreme 99% chance of damaging wind over 30 yrs
- Air quality 2/10 Low 1 unhealthy d/yr today · 2 by 30 yrs out
Nearby sold comps map
Loading sold comps map…
Walkable amenities ~0.75 mi
Loading nearby amenities…
Taxation est. · year 1
- Rental income
- $29,077
- − Mortgage interest
- −$8,957
- − Property taxes
- −$2,398
- − Insurance
- −$800
- − Repairs & maintenance
- −$2,326
- − Management
- −$2,326
- − HOA
- −$8,184
- − Depreciation
- −$4,652
- Taxable loss
- −$565
- Est. tax savings @ 24.0%
- +$136
- After-tax cash flow
- $1,662/yr
For passive investors: Depreciation is non-cash, so a rental often shows a tax loss while cash-flowing — sheltering income. Rental losses are passive: they offset passive income freely, and up to $25,000/yr can offset ordinary (W-2) income if you actively participate and your MAGI is under $100k (phasing out to $0 by $150k); unused losses carry forward. On sale, claimed depreciation is recaptured at up to 25%, and gains may owe capital-gains tax (a 1031 exchange can defer both). Figures are a year-1 estimate at your 24.0% rate — not tax advice; consult a CPA.
Schools (NCES district)
- District
- Palm Beach
- NCES district ID
- 1201500
- Math proficiency
- 46% ▼ -16.00%
- Reading proficiency
- 53% ▼ -4.00%
- Median HH income
- $53,943
- Composite
- 42.72/100
- National rank
- #3160
- State rank
- #34 of 73 in FL
Livability — Golf
- Score
- 63/100
- State rank
- #703
- US rank
- #14941
Category grades
Schools grade is shown separately in the Schools card above.
Census & demographics
- County
- Palm Beach County · 1,438,312 people
- Metro
- Miami-Fort Lauderdale-Pompano Beach, FL
- Population (ZIP)
- 48,743
- Household income
- $75,789
- Rent vs Own
- Severe rent burden
- 1813.0
Population outlook (Palm Beach County) Hauer SSP2
- Today (2025)
- 1,637,487 people
- By 2030
- 1,743,255 · +6.5%
- By 2040
- 1,948,712 · +19.0%
- By 2050
- 2,132,979 · +30.3%
- By 2075
- 2,530,027 · +54.5%
- By 2100
- 2,706,979 · +65.3%
Race, ethnicity, and origin ACS 2023
- Neighborhood character
- Diverse neighborhood (Simpson 0.64)
- Race & ethnicity
- White 52% Black 24% Hispanic / Latino 19% Two or more races 10% Asian 2%
- Hispanic origin (detail)
- Mexican 2% Puerto Rican 4% Cuban 3% Dominican 1%
- Common ancestry
- Hispanic 12% Romanian 3% Scotch-Irish 2%
- Foreign-born
- 27% · Canada, Jamaica, Vietnam
- Languages at home
- 64% English-only · Spanish 14% French/Haitian/Cajun 13% Other Indo-European 2%
Political lean MEDSL · Palm Beach
- 2024 margin
- Toss-up / Even · D 50.0% · R 49.2%
- 2008→2024 swing
- -22.1pp toward R · 2008: 22.9pp · 2024: 0.8pp
- All cycles
- 2024: D+0.8 2020: D+12.8 2016: D+15.3 2012: D+17.0 2008: D+22.9
Not yet ingested
- Civics
- —
Market trends
- HPI YoY
- ▼ -109.59%
- Current HPI
- 311.7742
- Rent YoY
- ▼ -0.57%
- Metro
- Miami-Fort Lauderdale-Pompano Beach, FL
- State GDP YoY
- ▲ 3.28%
- F500 in state
- 36
Industry mix (Fortune 500 HQ in FL)
| Industry | F500 HQs | Revenue |
|---|---|---|
| Industrial Technology | 2 | $29B |
|
||
| Insurance | 2 | $17B |
|
||
| Retail | 1 | $60B |
|
||
| Technology Distribution | 1 | $58B |
|
||
| Homebuilding | 1 | $35B |
|
||
| Technology Manufacturing | 1 | $35B |
|
||
Price history
-20.1% since first listed5 events — show timeline
- 2026-04-24 Pending — Beaches MLS
- 2026-04-21 Price Changed $159,900 Beaches MLS
- 2026-02-14 Price Changed $179,900 Beaches MLS
- 2025-10-31 Price Changed $192,000 Beaches MLS
- 2025-09-04 Listed $200,000 Beaches MLS
Cash-flow waterfall
monthlySold comps — $/sqft
last 12 mo · ≤1 miLoading sold comps…