4287 Manchester Ave NW · North Lawrence, OH
Flood risk 3/10 · Minor
- FEMA flood zone
- X (unshaded)
- Chance of flooding over 30 yrs
- 0.12%
- Est. flood insurance / yr
- $507 – $1,088
Fire risk 1/10 · Minimal
- Est. fire insurance / yr
- $713 – $1,323
Heat risk 3/10 · Minor
- Hot days now (above 97°F)
- 7 days/yr
- Hot days in 30 yrs
- 17 days/yr
Wind risk 1/10 · Minimal
- Chance of severe wind over 30 yrs
- 1.0%
Air-quality risk 2/10 · Minimal
- Unhealthy air days now
- 0 days/yr
- Unhealthy air days in 30 yrs
- 1 days/yr
Risk factors via First Street. Map © Google.
Why this score? — see what drove the D+ grade
The composite is a weighted blend of 9 inputs, each scored 0–100. Each bar is that input's sub-score; the figure is the points it added to the 100-point composite (weight × sub-score).
- Cash flow +15.0/30.0
- ARV discount +7.5/15.0
- Schools +6.5/10.0
- 1% rule +5.0/10.0
- DSCR +5.0/10.0
- Livability +2.8/5.0
- Rent growth +2.5/5.0
- Condition / age +2.2/5.0
- Appreciation +0.0/10.0
$20,000
🖨 Deal sheet (PDF) 📄 Offer letter ✓ Due diligence
Listing remarks
Trailer for sale! Includes appliances. Perfect for someone looking for an affordable home to live in. It has great potential! -It can come with a variety of furniture. -Includes refrigerator, stove, microwave, and washer / dryer -Brand new bathtub, bathroom sink, and toilet -Functional layout -New kitchen cabinets -New kitchen sink -Great starter home This is a great opportunity for anyone looking for a budget friendly, pet friendly home or investment. -Lot rent is 340$ -Pets allowed -25$ Per dog Message me for details if interested and we can set up a time for you to come view it. Call Jerry at (330) 844-3501 9 am to 5 pm. If I don & acirc; & euro; & trade; t answe
Key facts
- Brand new bathtub
- New kitchen cabinets
- New kitchen sink
Tags
Neighborhood map
What this means for you Summary
Snapshot
- This is a 2-bed/1.0-bath other listed at $20k. Condition is rated fair.
Deal economics
- At list price, monthly cash flow is $524 ($6k/yr) — positive.
- The deal already cash-flows at list — no discount required.
- Meets the 1% rule at list price ($838 rent vs $20k).
- Recommended offer: $19k (3.0% below list) — sets the bar for market timing.
Location & tenants
- Location reads 55/100 on livability (#1,133 in OH) — a working-class tenant base; expect higher turnover. Strengths: cost of living A+, housing B+; Watch: crime C-, employment D+, amenities F.
- Tuslaw Local (rural): math 78% / reading 73% proficiency, ranked #88 of 656 in OH (top 13%) — strong family-tenant draw, lease renewals of 3-5y typical.
- Zoned schools: Tuslaw Elementary School (math 82% / reading 72%, grade A, #221 of 1,584 statewide, top 16%, 479 students, 24% FRL); Tuslaw Middle School (math 82% / reading 75%, grade A+, #58 of 654 statewide, top 9%, 446 students, 28% FRL); Tuslaw High School (math 52% / reading 72%, grade B-, #202 of 781 statewide, top 29%, 324 students, 22% FRL) — zoned schools at 25% FRL track the district average.
- Market conditions: 7 active listings in the ZIP; solid renter incomes; 528 units permitted in Stark County in 2024 (84 in 5+ unit buildings).
- This rent is only 10% of the median local income ($101k/yr) — well below the 30% rent-burden line; pricing power to push rent on renewal without tenant pushback.
Forward outlook
- Local home prices are declining (-3.0%/yr); year-one equity from $138 of loan paydown is wiped out by about $600 of value loss. Plan a longer hold.
- Stark County population projected to shrink 8% by 2050 — rents likely to lag national; underwrite the cash flow, not the appreciation.
- At projected returns (-3.0% appreciation + 3.0% rent growth), your $6k cash investment doubles in ~1 year — after that, you're playing with house money.
Negotiation context
- It's been on market 34 days — a 3% lower offer ($19k) is reasonable based on typical stale-listing flexibility.
Questions for the listing agent
- It's been on market 34 days. Have you received any prior offers? Is the seller open to a 3% concession, seller financing, or rate buy-down credit?
- Have any recent inspections been done? Can we get a copy of the seller's disclosures and any deferred-maintenance estimates?
- Is there a deadline driving the sale (1031 exchange, divorce, estate, relocation)? That informs how much negotiation room exists.
- Schools are F-rated, which usually means shorter tenancies and higher turnover. Who's the typical renter profile here, and what's been the actual vacancy rate?
- The area grade is low — what's the realistic commute time and amenity access for the typical tenant pool here? Any planned neighborhood developments (good or bad) we should know about?
- What's the average days-on-market for RENTAL listings here right now (not sales)? A rising rental-DOM trend means longer vacancies and softer asking-rent achievability than the comps imply.
- What's the recent tenant-quality profile in this submarket — average credit score on applications, eviction rate, late-payment / NSF rate, and stable-employment percentage? A property-management company in the area should have these aggregated.
- How much new for-sale + rental construction is in the pipeline within 1–3 miles? Heavy new supply typically softens prices + rents 12–24 months out; constrained supply supports both.
Investment metrics
- 1% rule
- 4.19% ✓
- Cap rate
- 37.71%
- Cash-on-cash
- 112.20%
- DSCR
- 5.99
- GRM
- 2.0
CMA / ARV
No comps found within radius.
Projected returns pro-forma
-3.0% appreciation · 3.0% rent growth · sell at horizon
- IRR
- —
- Equity multiple
- 6.38×
- Total profit
- $30,120
- Equity at exit
- $2,982
- IRR
- —
- Equity multiple
- 13.36×
- Total profit
- $69,221
- Equity at exit
- $1,729
Cash invested: $5,600 (down + closing). Projections, not guarantees.
Landlord ↔ Tenant lean methodology
- Overall (STATE)
- 73 Landlord-Friendly
- State Ohio
- 73 Landlord-Friendly · R+6
- County
- — inherits STATE
- City
- — inherits STATE
ZIP-level market 44666
- Home prices YoY
- -14.5%
- Active inventory
- 7
- Price-to-rent
- 2.0×
Monthly cashflow live
- Estimated rent
- $838 medium interval (Pro) →
- Mortgage (P&I)
- −$105
- Tax est. 1.5%
- −$25 /mo · $300/yr
- Insurance
- −$8
- HOA
- −$0
- Vacancy / Maint / Mgmt
- −$176
- Net cashflow
- $524
Break-even live
Sensitivity live
| Price | -10% $537 | -5% $531 | +0% $524 | +5% $517 | +10% $510 |
|---|---|---|---|---|---|
| Rent | -10% $457 | -5% $491 | +0% $524 | +5% $557 | +10% $590 |
| Rate | -1.0pp $534 | -0.5pp $529 | base $524 | +0.5pp $518 | +1.0pp $513 |
UW: 25.0% down · 7.5% · 30yr · 1.5% tax · 5.0% vac · 8.0% maint · 8.0% mgmt
Financing live
Cash to close
- Down payment
- $5,000
- Closing costs
- $600
- Reserves months
- —
- Total cash needed
- —
Loan-product check · same deal, 3 products live
Conventional
25% down · 7.5% · 30yr
- Down + closing
- —
- Monthly P&I
- —
- Monthly cashflow
- —
- DSCR
- —
- Eligible?
- —
Personal DTI + credit; lowest rate.
DSCR
20% down · 8.5% · 30yr
- Down + closing
- —
- Monthly P&I
- —
- Monthly cashflow
- —
- DSCR
- —
- Eligible?
- —
No personal income docs; deal must DSCR.
Hard money
10% down · 12.0% · 12mo
- Down + closing
- —
- Monthly P&I
- —
- Monthly cashflow
- —
- DSCR
- —
- Eligible?
- —
Short-term bridge; refi at stabilization.
Listing history 14 events
-
2026-06-15days on market $20,000 Active 34 DOM
-
2026-06-14days on market $20,000 Active 32 DOM
-
2026-06-13days on market $20,000 Active 31 DOM
-
2026-06-10days on market $20,000 Active 29 DOM
-
2026-06-09days on market $20,000 Active 28 DOM
-
2026-06-08days on market $20,000 Active 27 DOM
-
2026-06-07days on market $20,000 Active 26 DOM
-
2026-06-05days on market $20,000 Active 23 DOM
-
2026-06-03days on market $20,000 Active 22 DOM
-
2026-06-02days on market $20,000 Active 21 DOM
-
2026-06-01days on market $20,000 Active 20 DOM
-
2026-05-31days on market $20,000 Active 19 DOM
-
2026-05-30days on market $20,000 Active 18 DOM
-
2026-05-12$20,000 Active 794-char remark
ⓘ Source: listings_history table (triggers on properties + properties_extension) + one-shot
backfill from property_details.listing_events for pre-trigger history.
Climate risk First Street
- Flood 3/10 Moderate FEMA zone X (unshaded) · 12% chance over 30 yrs
- Wildfire 1/10 Low
- Heat 3/10 Moderate 7 d/yr ≥97°F today · 17 d/yr by 30 yrs out
- Wind 1/10 Low 100% chance of damaging wind over 30 yrs
- Air quality 2/10 Low 0 unhealthy d/yr today · 1 by 30 yrs out
Nearby sold comps map
Loading sold comps map…
Walkable amenities ~0.75 mi
Loading nearby amenities…
Taxation est. · year 1
- Rental income
- $10,053
- − Mortgage interest
- −$1,120
- − Property taxes
- −$300
- − Insurance
- −$100
- − Repairs & maintenance
- −$804
- − Management
- −$804
- − Depreciation
- −$582
- Taxable income
- $6,342
- Est. tax owed @ 24.0%
- −$1,522
- After-tax cash flow
- $4,761/yr
For passive investors: Depreciation is non-cash, so a rental often shows a tax loss while cash-flowing — sheltering income. Rental losses are passive: they offset passive income freely, and up to $25,000/yr can offset ordinary (W-2) income if you actively participate and your MAGI is under $100k (phasing out to $0 by $150k); unused losses carry forward. On sale, claimed depreciation is recaptured at up to 25%, and gains may owe capital-gains tax (a 1031 exchange can defer both). Figures are a year-1 estimate at your 24.0% rate — not tax advice; consult a CPA.
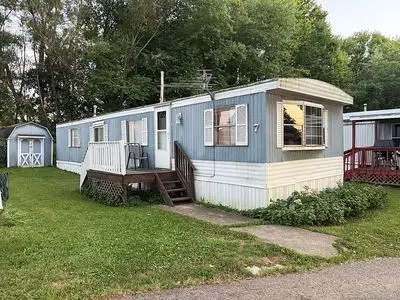
Condition & rehab AI · 2 photos
The home is in fair condition with minor exterior repairs needed. Painting the siding and trimming the landscaping can significantly enhance its curb appeal and value.
Repairs flagged
- Minor exterior siding — The siding appears weathered and may need repainting or minor repairs.
- Minor landscaping — The landscaping appears overgrown and could benefit from trimming and maintenance.
Value-add opportunities
- Resale painting the exterior siding — Fresh paint can significantly improve the home's curb appeal and resale value.
- Rental trimming the landscaping — Well-maintained landscaping can attract tenants and improve rental value.
Renovation cost estimate screening
| Repair item | Severity | Est. cost |
|---|---|---|
| exterior siding · The siding appears weathered and may need repainting or minor repairs. | Minor | $500–3,000 |
| landscaping · The landscaping appears overgrown and could benefit from trimming and maintenance. | Minor | $500–3,000 |
| Total estimated repair cost · 2 items | $1,000–6,000 |
Value-add ROI direction
- Resale painting the exterior siding — Fresh paint can significantly improve the home's curb appeal and resale value. ↑
- Rental trimming the landscaping — Well-maintained landscaping can attract tenants and improve rental value. ↑
ⓘ Cost ranges are severity-bucket heuristics (US national rule-of-thumb). Get contractor quotes + a written scope before underwriting a rehab budget.
Schools (NCES district)
- District
- Tuslaw Local
- NCES district ID
- 3904995
- Math proficiency
- 78% ▼ -2.00%
- Reading proficiency
- 73% ▼ -4.00%
- Median HH income
- $56,863
- Composite
- 64.61/100
- National rank
- #529
- State rank
- #88 of 656 in OH
Livability — North Lawrence
- Score
- 55/100
- State rank
- #1133
- US rank
- #23488
Category grades
Schools grade is shown separately in the Schools card above.
Census & demographics
- County
- Stark · 366,688 people
- City population
- 3,122
- Metro
- Canton-Massillon, OH
- Population (ZIP)
- 3,122
- Household income
- $101,250
- Rent vs Own
Population outlook (Stark County) Hauer SSP2
- Today (2025)
- 373,708 people
- By 2030
- 371,245 · -0.7%
- By 2040
- 361,331 · -3.3%
- By 2050
- 345,290 · -7.6%
- By 2075
- 302,669 · -19.0%
- By 2100
- 238,870 · -36.1%
Race, ethnicity, and origin ACS 2023
- Neighborhood character
- Predominantly White (95%)
- Race & ethnicity
- White 95% Two or more races 3% Hispanic / Latino 2%
- Common ancestry
- Italian 2% Subsaharan African 1% Romanian 1%
- Foreign-born
- 0% · Canada
- Languages at home
- 98% English-only · Spanish 1%
Political lean MEDSL · Stark
- 2024 margin
- Strong R (+21.9) · D 38.6% · R 60.5%
- 2008→2024 swing
- -27.4pp toward R · 2008: 5.5pp · 2024: -21.9pp
- All cycles
- 2024: R+21.9 2020: R+18.5 2016: R+17.4 2012: R+0.4 2008: D+5.5
Not yet ingested
- Civics
- —
Market trends
- HPI YoY
- ▼ -42.35%
- Current HPI
- 250.3582
- Rent YoY
- —
- Metro
- —
- State GDP YoY
- ▲ 1.98%
- F500 in state
- 48
Industry mix (Fortune 500 HQ in OH)
| Industry | F500 HQs | Revenue |
|---|---|---|
| Insurance | 3 | $145B |
|
||
| Industrial Machinery | 3 | $49B |
|
||
| Financial Services | 3 | $24B |
|
||
| Consumer Goods | 2 | $93B |
|
||
| Aerospace / Defense | 2 | $47B |
|
||
| Utilities | 2 | $33B |
|
||
Cash-flow waterfall
monthlySold comps — $/sqft
last 12 mo · ≤1 miLoading sold comps…