 🏷️ Likely Rental
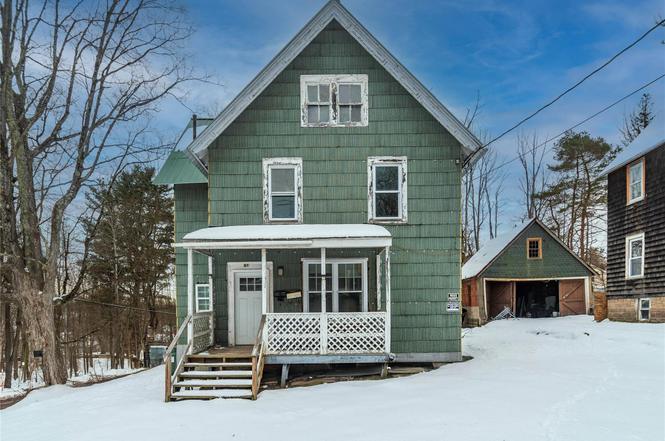
41 Edgar St · Liberty, NY
Flood risk 1/10 · Minimal
- FEMA flood zone
- X (unshaded)
- Chance of flooding over 30 yrs
- 0.0%
- Est. flood insurance / yr
- $473 – $860
Fire risk 1/10 · Minimal
- Est. fire insurance / yr
- $691 – $1,283
Heat risk 2/10 · Minimal
- Hot days now (above 90°F)
- 7 days/yr
- Hot days in 30 yrs
- 17 days/yr
Wind risk 2/10 · Minimal
- Chance of severe wind over 30 yrs
- 4.0%
Air-quality risk 2/10 · Minimal
- Unhealthy air days now
- 0 days/yr
- Unhealthy air days in 30 yrs
- 1 days/yr
Risk factors via First Street. Map © Google.
Why this score? — see what drove the A grade
The composite is a weighted blend of 9 inputs, each scored 0–100. Each bar is that input's sub-score; the figure is the points it added to the 100-point composite (weight × sub-score).
- Cash flow +30.0/30.0
- ARV discount +15.0/15.0
- 1% rule +10.0/10.0
- DSCR +10.0/10.0
- Appreciation +10.0/10.0
- Livability +3.1/5.0
- Schools +2.8/10.0
- Rent growth +2.5/5.0
- Condition / age +2.5/5.0
$205,000
🖨 Deal sheet 📄 Offer letter ✓ Due diligence
Multi-family units
County records classify this as Multi-Family (2-4 Unit). Listing-text estimate: 2 units. confirmed
Listing remarks
Great investment opportunity! This solid structure presents an excellent opportunity ideal for investors, contractors, or owner- occupants looking to build equity. With the right vision, this property can be reimagined into a thoughtfully renovated two-family asset that meets today's buyer and renter demand. The first floor offers a two-bedroom apartment with a large primary bedroom, eat-in kitchen and large living room. On the second floor, you will find a spacious two-bedroom apartment with two additional bonus rooms offering endless opportunities. Delivered vacant, this home presents a rare opportunity to execute improvements efficiently and immediately. Located in an area with continued
Key facts
- Multi family housing
- Eat in kitchen
- Bonus rooms
Tags
Property features AI
Exterior
- Parking: Driveway; Off-street parking; No carport
- Utilities: Public sewer; Cable available; Electricity connected
- Home design: Duplex
- Construction: Wood siding construction
- Exterior features: Wood siding; Not waterfront; No additional parcels
Interior
- Bedrooms: One 2-bedroom unit
- Bathrooms: 2 full bathrooms
- Heating & cooling: Electric heating; No central air
- Interior features: First-floor bedroom; Finished attic; Common basement
Neighborhood map
What this means for you Summary
Snapshot
- This is a 2 × 2-bed/1.0-bath units multifamily listed at $205k.
Deal economics
- At list price, monthly cash flow is $844 ($10k/yr) — positive. Per door: $422/mo.
- The deal already cash-flows at list — no discount required.
- Meets the 1% rule at list price ($3k rent vs $205k).
- Recommended offer: $187k (9.0% below list) — sets the bar for market timing.
- Cap rate 11.2% vs local median 3.8% in Liberty — top-decile yield for the area; either an underpriced asset or a hidden risk that comps aren't pricing in. Stress-test before assuming the spread holds.
Location & tenants
- Location reads 62/100 on livability (#890 in NY) — a middle-class / working-renter tenant base. Strengths: cost of living A+, health & safety A+, housing B+; Watch: crime D+, amenities F, commute F.
- Liberty Central School District (town): math 31% / reading 34% proficiency, ranked #569 of 590 in NY (top 96%) — families likely to look elsewhere, expect single-tenant / working-renter base with shorter leases.
- Market conditions: 65 active listings in the ZIP; 1 comparable units currently listed for rent nearby; 739 units permitted in Sullivan County in 2024 (5 in 5+ unit buildings).
Forward outlook
- In year one you build about $22k of equity ($1k loan paydown + $20k appreciation (10.0% local appreciation)).
- Sullivan County population projected at -24% by 2050 — secular population decline; favor cash flow + early exit over multi-decade hold.
- At projected returns (10.0% appreciation + 3.0% rent growth), your $57k cash investment doubles in ~2 years — after that, you're playing with house money.
- By year 2, paydown + projected appreciation supports a ~$35k cash-out refi (75% LTV) — recoverable capital for the next deal without selling this one.
Negotiation context
- It's been on market 109 days — a 9% lower offer ($187k) is reasonable based on typical stale-listing flexibility.
- Current owner paid $45k; list at $205k implies a 356% gain — meaningful room to come down on a strong offer.
Risks & watch-outs
- Watch-outs: property tax is 3.4% of price; built in 1940 — expect roof / HVAC / electrical / plumbing capex.
Questions for the listing agent
- It's been on market 109 days. Have you received any prior offers? Is the seller open to a 9% concession, seller financing, or rate buy-down credit?
- Can we see the unit-by-unit rent roll, current vacancy, and any below-market leases? What's the average tenancy length?
- What capital expenditures (roof, boiler, parking lot, exteriors) have been made in the last 5 years, and what's planned in the next 2?
- Built in 1940 — when were the roof, HVAC, electrical panel, plumbing, and water heater last replaced?
- Property tax is high relative to price — has the assessment been appealed recently, and will the sale trigger a re-assessment?
- Why hasn't it sold? Are there any deal-killer items the seller is aware of (foundation, flood, title, zoning, code violations)?
- Is there a deadline driving the sale (1031 exchange, divorce, estate, relocation)? That informs how much negotiation room exists.
- Crime grade is D in this area — have there been break-ins, vandalism, or insurance claims at this property in the last 3 years? What carrier currently insures it and at what premium?
- What's the average days-on-market for RENTAL listings here right now (not sales)? A rising rental-DOM trend means longer vacancies and softer asking-rent achievability than the comps imply.
- What's the recent tenant-quality profile in this submarket — average credit score on applications, eviction rate, late-payment / NSF rate, and stable-employment percentage? A property-management company in the area should have these aggregated.
- How much new apartment / multifamily construction is in the pipeline within 1–3 miles? Heavy new supply (>2% of stock underway) typically softens rents 12–24 months out; light construction supports rent growth.
Investment metrics
- 1% rule
- 1.59% ✓
- Cap rate
- 11.23%
- Cash-on-cash
- 17.64%
- DSCR
- 1.79
- GRM
- 5.2
CMA / ARV
- ARV (on-the-fly)
- $288,252
- Comps found
- 2
Show comp detail 2 sales within ~0.75 mi
| Address | Dist | Beds/Ba | Sqft | Sold | Price | $/sf | Match |
|---|---|---|---|---|---|---|---|
| 67 Lake St | 0.15mi | 5/3.0 (+1) | 1,920 (+2%) | 13mo | $255,000 | $133 | 72 |
| 98 Dwyer Ave | 0.61mi | 3/2.0 (-1) | 1,862 (-1%) | 1mo | $285,000 | $153 | 62 |
Match score weights: distance 35% · size 25% · config 20% · recency 20%. Top-matched comps best support the ARV.
Projected returns pro-forma
10.0% appreciation · 3.0% rent growth · sell at horizon
- IRR
- 37.4%
- Equity multiple
- 3.89×
- Total profit
- $165,648
- Equity at exit
- $184,680
- IRR
- 32.3%
- Equity multiple
- 8.77×
- Total profit
- $446,017
- Equity at exit
- $398,270
Cash invested: $57,400 (down + closing). Projections, not guarantees.
Landlord ↔ Tenant lean methodology
- Overall (STATE)
- 15 Strongly Tenant-Friendly
- State New York
- 15 Strongly Tenant-Friendly · D+10
- County
- — inherits STATE
- City
- — inherits STATE
ZIP-level market 12754
- Home prices YoY
- 28.0%
- Active inventory
- 65
- Price-to-rent
- 10.5×
Monthly cashflow live
- Estimated rent
- $3,263 high interval (Pro) →
- Mortgage (P&I)
- −$1,075
- Tax from tax record
- −$573 /mo · $6,880/yr
- Insurance
- −$85
- HOA
- −$0
- Vacancy / Maint / Mgmt
- −$685
- Net cashflow
- $844
Break-even live
2-unit breakdown (identical units grouped — click to expand)
| Units | Beds | Baths | Est. rent |
|---|---|---|---|
| 2× units | 2 | 1 | $3,262 |
| #1 | 2 | 1 | $1,631 |
| #2 | 2 | 1 | $1,631 |
| Total (2 units) | $3,263 | ||
UW: 25.0% down · 7.5% · 30yr · 1.5% tax · 5.0% vac · 8.0% maint · 8.0% mgmt
Financing live
Cash to close
- Down payment
- $51,250
- Closing costs
- $6,150
- Reserves months
- —
- Total cash needed
- —
Loan-product check · same deal, 3 products live
Conventional
25% down · 7.5% · 30yr
- Down + closing
- —
- Monthly P&I
- —
- Monthly cashflow
- —
- DSCR
- —
- Eligible?
- —
Personal DTI + credit; lowest rate.
DSCR
20% down · 8.5% · 30yr
- Down + closing
- —
- Monthly P&I
- —
- Monthly cashflow
- —
- DSCR
- —
- Eligible?
- —
No personal income docs; deal must DSCR.
Hard money
10% down · 12.0% · 12mo
- Down + closing
- —
- Monthly P&I
- —
- Monthly cashflow
- —
- DSCR
- —
- Eligible?
- —
Short-term bridge; refi at stabilization.
Rent comps 1 comps
| Address | Beds | Baths | Sqft | Rent | $/sqft | DOM | Units | Dist |
|---|---|---|---|---|---|---|---|---|
| 12 Liberty St Liberty, NY | 4.0 | 2.5 | 2200 | $2,350 | $1.07 | 23d | 1 | 0.57mi |
Listing history 3 events
-
2026-04-15status Pending
-
2025-12-26$205,000 Active
-
1988-11-23soldstatus $45,000
ⓘ Source: listings_history table (triggers on properties + properties_extension) + one-shot
backfill from property_details.listing_events for pre-trigger history.
Tax reassessment forecast NY · Partial reset (capped growth)
- Current annual tax
- $6,880 · $573/mo
- Projected year-2 tax
- $6,880 · $573/mo
- Expected delta
- $0/yr ($0/mo · 0.0%)
ⓘ Screening estimate from a state-policy table — verify with the county assessor before closing.
Climate risk First Street
- Flood 1/10 Low FEMA zone X (unshaded) · 0% chance over 30 yrs
- Wildfire 1/10 Low
- Heat 2/10 Low 7 d/yr ≥90°F today · 17 d/yr by 30 yrs out
- Wind 2/10 Low 4% chance of damaging wind over 30 yrs
- Air quality 2/10 Low 0 unhealthy d/yr today · 1 by 30 yrs out
Nearby sold comps map
Loading sold comps map…
Walkable amenities ~0.75 mi
Loading nearby amenities…
Taxation est. · year 1
- Rental income
- $39,156
- − Mortgage interest
- −$11,483
- − Property taxes
- −$6,880
- − Insurance
- −$1,025
- − Repairs & maintenance
- −$3,132
- − Management
- −$3,132
- − Depreciation
- −$5,964
- Taxable income
- $7,540
- Est. tax owed @ 24.0%
- −$1,809
- After-tax cash flow
- $8,319/yr
For passive investors: Depreciation is non-cash, so a rental often shows a tax loss while cash-flowing — sheltering income. Rental losses are passive: they offset passive income freely, and up to $25,000/yr can offset ordinary (W-2) income if you actively participate and your MAGI is under $100k (phasing out to $0 by $150k); unused losses carry forward. On sale, claimed depreciation is recaptured at up to 25%, and gains may owe capital-gains tax (a 1031 exchange can defer both). Figures are a year-1 estimate at your 24.0% rate — not tax advice; consult a CPA.
Schools (NCES district)
- District
- Liberty Central School District
- NCES district ID
- 3617220
- Math proficiency
- 31% ▼ -8.00%
- Reading proficiency
- 34% ▼ -4.00%
- Median HH income
- $43,542
- Composite
- 27.65/100
- National rank
- #6920
- State rank
- #569 of 590 in NY
Livability — Liberty
- Score
- 62/100
- State rank
- #890
- US rank
- #17254
Category grades
Schools grade is shown separately in the Schools card above.
Census & demographics
- Census place
- Liberty, NY
- City population
- 8,525
- Population (ZIP)
- 8,525
Population outlook (Sullivan County) Hauer SSP2
- Today (2025)
- 68,974 people
- By 2030
- 65,609 · -4.9%
- By 2040
- 58,878 · -14.6%
- By 2050
- 52,500 · -23.9%
- By 2075
- 39,941 · -42.1%
- By 2100
- 28,880 · -58.1%
Race, ethnicity, and origin ACS 2023
- Neighborhood character
- Diverse neighborhood (Simpson 0.56)
- Race & ethnicity
- White 56% Hispanic / Latino 36% Two or more races 8% Black 4% Asian 2% Native American 1%
- Hispanic origin (detail)
- Mexican 3% Puerto Rican 7% Dominican 2%
- Common ancestry
- Romanian 3% Lithuanian 2% Scotch-Irish 1%
- Foreign-born
- 22% · Canada, Dominican Republic, Jamaica
- Languages at home
- 71% English-only · Spanish 25% Other Indo-European 2% French/Haitian/Cajun 1%
Political lean MEDSL · Sullivan
- 2024 margin
- R (+16.7) · D 41.6% · R 58.4%
- 2008→2024 swing
- -26.2pp toward R · 2008: 9.5pp · 2024: -16.7pp
- All cycles
- 2024: R+16.7 2020: R+9.2 2016: R+13.7 2012: D+10.4 2008: D+9.5
Not yet ingested
- Civics
- —
Market trends
- HPI YoY
- ▲ 100.10%
- Current HPI
- 457.3342
- Rent YoY
- —
- Metro
- —
- State GDP YoY
- ▲ 2.60%
- F500 in state
- 92
Industry mix (Fortune 500 HQ in NY)
| Industry | F500 HQs | Revenue |
|---|---|---|
| Financial Services | 10 | $950B |
|
||
| Consumer Goods | 9 | $162B |
|
||
| Insurance | 4 | $225B |
|
||
| Telecommunications | 2 | $144B |
|
||
| Pharmaceuticals | 2 | $112B |
|
||
| Media / Entertainment | 2 | $69B |
|
||
Price history
+355.6% since first listed3 events — show timeline
- 2026-04-15 Pending — OneKey® MLS as Distributed by MLS Grid
- 2025-12-26 Listed $205,000 OneKey® MLS as Distributed by MLS Grid
- 1988-11-23 Sold (Public Records) $45,000 Public Records
Property tax history
+1.0%/yrLatest (2025): $6,880 · +8.1% YoY. Source: county tax records.
Cash-flow waterfall
monthlySold comps — $/sqft
last 12 mo · ≤1 miLoading sold comps…