13789 SW 66th St Unit 283F · Kendale Lakes, FL
Flood risk 1/10 · Minimal
- FEMA flood zone
- X (unshaded)
- Chance of flooding over 30 yrs
- 0.0%
- Est. flood insurance / yr
- $507 – $1,088
Fire risk 2/10 · Minimal
- Est. fire insurance / yr
- $947 – $1,759
Heat risk 10/10 · Severe
- Hot days now (above 105°F)
- 7 days/yr
- Hot days in 30 yrs
- 31 days/yr
Wind risk 10/10 · Severe
- Chance of severe wind over 30 yrs
- 99.0%
Air-quality risk 2/10 · Minimal
- Unhealthy air days now
- 1 days/yr
- Unhealthy air days in 30 yrs
- 1 days/yr
Risk factors via First Street. Map © Google.
Why this score? — see what drove the D grade
The composite is a weighted blend of 9 inputs, each scored 0–100. Each bar is that input's sub-score; the figure is the points it added to the 100-point composite (weight × sub-score).
- Cash flow +11.4/30.0
- ARV discount +7.5/15.0
- 1% rule +5.6/10.0
- Schools +4.2/10.0
- Livability +3.9/5.0
- Condition / age +3.8/5.0
- DSCR +3.3/10.0
- Rent growth +2.5/5.0
- Appreciation +0.0/10.0
$218,995
🖨 Deal sheet (PDF) 📄 Offer letter ✓ Due diligence
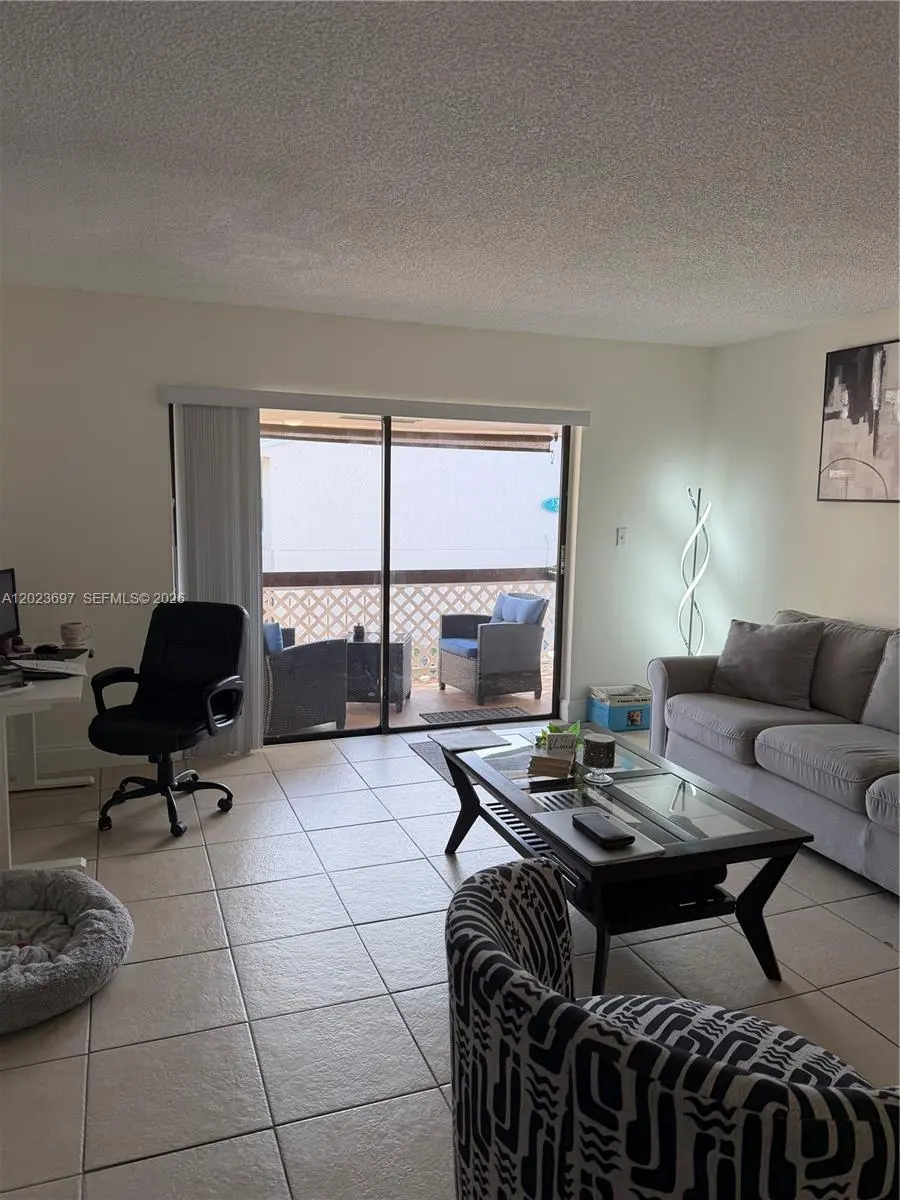
Listing remarks
Beautiful and impeccably maintained 1-bedroom, 1bath apartment with approximately 750 sq. ft. of living space in a prime Miami location just in Miccosukee Golf & Country Club. ! This spacious residence offers a bright and open layout with stunning views, creating a peaceful and relaxing atmosphere. Located in a beautiful and well-maintained building, the unit features generous living areas, abundant natural light, and an excellent floor plan perfect for comfortable living or investment. Enjoy the convenience of being just minutes from the Florida Turnpike, major shopping centers, restaurants, parks, and top-rated schools. The oversized primary bedroom includes a private full bath, plu
Key facts
- Washer and dryer
- Walking closet
- Private full bath
Tags
Property features AI
Finance
- Financial info: Pets allowed with size limit (maximum 20 lbs)
- HOA & community: Monthly association fee covers pool(s)
Exterior
- Parking: 1 covered garage space; One parking space
- Security: Security guard
- Utilities: Has cooling (central air); Has heating (electric)
- Home design: 2-story building; Attached property; Entry on second level
- Construction: Block construction; Resale property
- Exterior features: Balcony; Storm/security shutters; Open balcony/patio
Interior
- Kitchen: Electric range; Microwave; Refrigerator
- Bedrooms: Bedroom located on the main level
- Flooring: Ceramic tile
- Bathrooms: 1 full bathroom
- Heating & cooling: Central air conditioning; Electric heating
- Interior features: Second-floor entry; Bedroom on main level; Walk-in closet(s)
- Laundry & utility: Washer; Dryer
Neighborhood map
What this means for you Summary
Snapshot
- This is a 1-bed/1.0-bath condo listed at $219k. Condition is rated good.
Deal economics
- At list price, monthly cash flow is $-76 ($-910/yr) — negative.
- To cash-flow at today's rent, offer at most $208k (5.0% below list).
- Meets the 1% rule at list price ($2k rent vs $219k).
- Recommended offer: $208k (5.0% below list) — sets the bar for cash-flow.
- Cap rate 5.9% vs local median 3.6% in Kendale Lakes — top-decile yield for the area; either an underpriced asset or a hidden risk that comps aren't pricing in. Stress-test before assuming the spread holds.
Location & tenants
- Location reads 77/100 on livability (#186 in FL, #2,923 nationally) — a middle-class / working-renter tenant base. Strengths: housing A+, crime A-, commute B+; Watch: amenities F.
- Miami-Dade (suburban): math 45% / reading 54% proficiency, ranked #40 of 73 in FL (top 55%) — families likely to look elsewhere, expect single-tenant / working-renter base with shorter leases; 64% free/reduced lunch — lower-income household profile, screen leases tightly.
- Zoned schools: Bent Tree Elementary School (math 57% / reading 67%, grade B, #608 of 2,144 statewide, top 29%, 395 students, 60% FRL); Howard D. Mcmillan Middle School (math 54% / reading 61%, grade B, #157 of 571 statewide, top 28%, 865 students, 60% FRL); Miami Sunset Senior High School (math 30% / reading 42%, grade F, #359 of 667 statewide, top 55%, 1,062 students, 54% FRL).
- Market conditions: Rents soft (-0.1%/yr); 185 active listings in the ZIP; 40 comparable units currently listed for rent nearby; rentals at typical pace (median 17d on market — plan ~3-4 weeks tenant-placement turnaround); 10,051 units permitted in Miami-Dade County in 2024 (7,758 in 5+ unit buildings).
- This rent runs 40% of the median local income ($70k/yr) — at the standard rent-burdened threshold; future hikes will face affordability resistance.
Forward outlook
- Local home prices are declining (-3.0%/yr); year-one equity from $2k of loan paydown is wiped out by about $7k of value loss. Plan a longer hold.
- Miami-Dade County population projected at +28% by 2050 — long-run rental-demand tailwind backs the buy-and-hold thesis.
Negotiation context
- It's been on market 31 days — a 3% lower offer ($212k) is reasonable based on typical stale-listing flexibility.
Risks & watch-outs
- Climate carrying-cost: severe wind risk, 99% chance of damaging wind over 30y; extreme-heat days projected 7→31/yr by 2055 (HVAC capex compounding) — expect insurance premiums to compound above CPI over the hold.
Questions for the listing agent
- What do current leases actually rent for vs. the listed asking? Can we see a recent rent roll and the last 12 months of T-12 income?
- It's been on market 31 days. Have you received any prior offers? Is the seller open to a 5% concession, seller financing, or rate buy-down credit?
- Built in 1973 — when were the roof, HVAC, electrical panel, plumbing, and water heater last replaced?
- What does the HOA fee cover, when was the last increase, and are there any pending special assessments or reserve-fund shortfalls?
- Any open or pending special assessments — roof, HVAC, plumbing, elevator, façade? What's the per-unit balance and payoff schedule, and is the seller paying it off at close or rolling it to the buyer?
- Is there a deadline driving the sale (1031 exchange, divorce, estate, relocation)? That informs how much negotiation room exists.
- Schools are A-rated — typically a magnet for longer-tenancy family renters. What's the average tenant stay here, and is there a school-zone premium baked into asking?
- The area grade is low — what's the realistic commute time and amenity access for the typical tenant pool here? Any planned neighborhood developments (good or bad) we should know about?
- What's the average days-on-market for RENTAL listings here right now (not sales)? A rising rental-DOM trend means longer vacancies and softer asking-rent achievability than the comps imply.
- What's the recent tenant-quality profile in this submarket — average credit score on applications, eviction rate, late-payment / NSF rate, and stable-employment percentage? A property-management company in the area should have these aggregated.
- How much new apartment / multifamily construction is in the pipeline within 1–3 miles? Heavy new supply (>2% of stock underway) typically softens rents 12–24 months out; light construction supports rent growth.
Investment metrics
- 1% rule
- 1.06% ✓
- Cap rate
- 5.88%
- Cash-on-cash
- -1.48%
- DSCR
- 0.93
- GRM
- 7.9
CMA / ARV
No comps found within radius.
Projected returns pro-forma
-3.0% appreciation · 0.0% rent growth · sell at horizon
- IRR
- -23.0%
- Equity multiple
- 0.24×
- Total profit
- $-46,817
- Equity at exit
- $32,653
- IRR
- -32.5%
- Equity multiple
- -0.18×
- Total profit
- $-72,058
- Equity at exit
- $18,935
Cash invested: $61,319 (down + closing). Projections, not guarantees.
Landlord ↔ Tenant lean methodology
- Overall (STATE)
- 87 Strongly Landlord-Friendly
- State Florida
- 87 Strongly Landlord-Friendly · R+3
- County
- — inherits STATE
- City
- — inherits STATE
ZIP-level market 33183
- Rents YoY
- -0.1%
- Active inventory
- 185
- Price-to-rent
- 7.9×
Monthly cashflow live
- Estimated rent
- $2,312 high interval (Pro) →
- Mortgage (P&I)
- −$1,148
- Tax est. 1.5%
- −$274 /mo · $3,285/yr
- Insurance
- −$91
- HOA
- −$389
- Vacancy / Maint / Mgmt
- −$486
- Net cashflow
- $-76
Break-even live
Sensitivity live
| Price | -10% $76 | -5% $0 | +0% $-76 | +5% $-151 | +10% $-227 |
|---|---|---|---|---|---|
| Rent | -10% $-258 | -5% $-167 | +0% $-76 | +5% $16 | +10% $107 |
| Rate | -1.0pp $34 | -0.5pp $-20 | base $-76 | +0.5pp $-133 | +1.0pp $-190 |
UW: 25.0% down · 7.5% · 30yr · 1.5% tax · 5.0% vac · 8.0% maint · 8.0% mgmt
Financing live
Cash to close
- Down payment
- $54,749
- Closing costs
- $6,570
- Reserves months
- —
- Total cash needed
- —
Loan-product check · same deal, 3 products live
Conventional
25% down · 7.5% · 30yr
- Down + closing
- —
- Monthly P&I
- —
- Monthly cashflow
- —
- DSCR
- —
- Eligible?
- —
Personal DTI + credit; lowest rate.
DSCR
20% down · 8.5% · 30yr
- Down + closing
- —
- Monthly P&I
- —
- Monthly cashflow
- —
- DSCR
- —
- Eligible?
- —
No personal income docs; deal must DSCR.
Hard money
10% down · 12.0% · 12mo
- Down + closing
- —
- Monthly P&I
- —
- Monthly cashflow
- —
- DSCR
- —
- Eligible?
- —
Short-term bridge; refi at stabilization.
Rent comps 40 comps
| Address | Beds | Baths | Sqft | Rent | $/sqft | DOM | Units | Dist |
|---|---|---|---|---|---|---|---|---|
| 13787 SW 66th St Unit 153D Miami, FL | 2.0 | 2.0 | 1050 | $2,575 | $2.45 | 6d | 1 | 0.03mi |
| 13787 SW 66th St Unit 153D Miami, FL | 2.0 | 2.0 | 1050 | $2,575 | $2.45 | 7d | 1 | 0.03mi |
| 13701 Kendale Lakes Cir Unit B308 Miami, FL | 2.0 | 2.0 | 938 | $2,300 | $2.45 | 15d | 1 | 0.10mi |
| 13701 Kendale Lakes Cir Unit B308 Miami, FL | 2.0 | 2.0 | 938 | $2,300 | $2.45 | 0d | 1 | 0.10mi |
| 13701 Kendale Lakes Cir Unit B112 Miami, FL | 2.0 | 2.0 | 1009 | $2,300 | $2.28 | 7d | 1 | 0.10mi |
| 13701 Kendale Lakes Cir Unit B112 Miami, FL | 2.0 | 2.0 | 1009 | $2,300 | $2.28 | 22d | 1 | 0.10mi |
| 13701 Kendale Lakes Cir Miami, FL | 2.0 | 2.0 | 952 | $2,200 | $2.31 | 22d | 2 | 0.10mi |
| 6410 SW 139th Ave #203 Miami, FL | 2.0 | 2.5 | 1000 | $2,600 | $2.60 | 0d | 1 | 0.16mi |
| 6211 SW 138th Ct Unit B Miami, FL | 2.0 | 2.5 | 1064 | $2,550 | $2.40 | 26d | 1 | 0.22mi |
| 14005 SW 67th Ter Miami, FL | 2.0 | 2.5 | 1119 | $3,000 | $2.68 | 0d | 1 | 0.26mi |
| 14250 SW 62nd St Miami, FL | 2.0 | 2.0 | 1020 | $2,200 | $2.16 | 3d | 3 | 0.42mi |
| 14250 SW 62nd St Miami, FL | 2.0 | 2.0 | 1020 | $2,250 | $2.21 | 4d | 3 | 0.42mi |
| 13120 SW 64th Ter #1504 Miami, FL | 2.0 | 2.0 | 950 | $2,300 | $2.42 | 9d | 1 | 0.64mi |
| 6425 SW 130th Pl #704 Miami, FL | 2.0 | 2.0 | 950 | $2,200 | $2.32 | 18d | 1 | 0.64mi |
| 6425 SW 130th Pl #704 Miami, FL | 2.0 | 2.0 | 950 | $2,200 | $2.32 | 12d | 1 | 0.64mi |
| 6795 SW 132nd Ave #203 Miami, FL | 2.0 | 2.0 | 956 | $2,300 | $2.41 | 17d | 1 | 0.65mi |
| 6445 SW 130th Pl #610 Miami, FL | 2.0 | 2.0 | 950 | $2,300 | $2.42 | 26d | 1 | 0.67mi |
| 6400 SW 139th Avenue Rd Unit 103 Miami, FL | 2.0 | 2.5 | 1000 | $2,660 | $2.66 | 26d | 1 | 0.72mi |
| 13335 SW 57th Ter Unit 83 Miami, FL | 2.0 | 1.5 | 936 | $2,500 | $2.67 | 5d | 1 | 0.73mi |
| 12990 SW 63rd Ter #605 Miami, FL | 1.0 | 1.0 | 711 | $1,950 | $2.74 | 26d | 1 | 0.77mi |
| 6205 SW 131st Ct #203 Miami, FL | 2.0 | 2.0 | 820 | $2,300 | $2.80 | 23d | 1 | 0.80mi |
| 7700 SW 137th Ct Unit 7700 Miami, FL | 2.0 | 1.0 | 900 | $2,500 | $2.78 | 9d | 1 | 0.80mi |
| 7700 SW 137th Ct Unit 7700 Miami, FL | 2.0 | 1.0 | 900 | $2,650 | $2.94 | 23d | 1 | 0.80mi |
| 6230 SW 129th Pl #1210 Miami, FL | 2.0 | 2.0 | 1070 | $2,700 | $2.52 | 16d | 1 | 0.81mi |
| 12955 SW 66th Ln Unit 212-2 Miami, FL | 2.0 | 2.0 | 890 | $2,000 | $2.25 | 26d | 1 | 0.81mi |
| 4933 SW 135th Pl Unit 4933 Miami, FL | 2.0 | 1.0 | 864 | $2,500 | $2.89 | 9d | 1 | 0.81mi |
| 12960 SW 66th Ln Unit 14 Miami, FL | 2.0 | 2.0 | 890 | $2,150 | $2.42 | 26d | 1 | 0.81mi |
| 6203 SW 131st Ct #103 Miami, FL | 2.0 | 2.0 | 820 | $2,250 | $2.74 | 7d | 1 | 0.82mi |
| 14057 SW 52nd Ter Unit 14057 Miami, FL | 2.0 | 2.0 | 1030 | $2,900 | $2.82 | 4d | 1 | 0.83mi |
| 6435 SW 129th Pl #107 Miami, FL | 2.0 | 2.5 | 1100 | $2,600 | $2.36 | 0d | 1 | 0.83mi |
| 6921 SW 129th Ave #5 Miami, FL | 2.0 | 2.0 | 812 | $2,050 | $2.52 | 26d | 1 | 0.91mi |
| 6911 SW 129th Ave #5 Miami, FL | 2.0 | 2.0 | 812 | $2,100 | $2.59 | 26d | 1 | 0.92mi |
| 7121 SW 129th Ave #8 Miami, FL | 2.0 | 2.0 | 810 | $2,200 | $2.72 | 26d | 1 | 0.95mi |
| 7011 SW 129th Ave #5 Miami, FL | 2.0 | 2.0 | 812 | $2,175 | $2.68 | 22d | 1 | 0.97mi |
| 13931 SW 49th Circle Ter Miami, FL | 1.0 | 1.0 | 1061 | $1,200 | $1.13 | 26d | 1 | 1.03mi |
| 12736 SW 66th Terrace Dr Unit 12736 Miami, FL | 2.0 | 1.0 | 1025 | $2,450 | $2.39 | 26d | 1 | 1.07mi |
| 8400 SW 133rd Avenue Rd Miami, FL | 2.0–3.0 | 2.0 | 1002 | $2,300 | $2.29 | 3d | 2 | 1.15mi |
| 8500 SW 133rd Avenue Rd Miami, FL | 1.0–2.0 | 1.5–2.0 | 835 | $1,800 | $2.16 | 0d | 2 | 1.19mi |
| 8309 SW 142nd Ave Unit G203 Miami, FL | 1.0 | 1.0 | 665 | $1,850 | $2.78 | 9d | 1 | 1.21mi |
| 8309 SW 142nd Ave Unit G203 Miami, FL | 1.0 | 1.0 | 665 | $1,900 | $2.86 | 22d | 1 | 1.21mi |
HOA detail condo
- Monthly dues
- $389 · $4,668/yr
- Assessments
- None detected in remarks — confirm with the listing agent.
Listing history 15 events
-
2026-06-21days on market $218,995 Active 31 DOM
-
2026-06-18days on market $218,995 Active 28 DOM
-
2026-06-17days on market $218,995 Active 27 DOM
-
2026-06-16days on market $218,995 Active 26 DOM
-
2026-06-15days on market $218,995 Active 25 DOM
-
2026-06-13days on market $218,995 Active 23 DOM
-
2026-06-09days on market $218,995 Active 19 DOM
-
2026-06-08days on market $218,995 Active 18 DOM
-
2026-06-07days on market $218,995 Active 17 DOM
-
2026-06-04days on market $218,995 Active 14 DOM
-
2026-06-03days on market $218,995 Active 13 DOM
-
2026-06-02days on market $218,995 Active 12 DOM
-
2026-06-01days on market $218,995 Active 11 DOM
-
2026-05-31pricedays on market $218,995 Active 10 DOM
-
2026-05-21$223,900 Active
ⓘ Source: listings_history table (triggers on properties + properties_extension) + one-shot
backfill from property_details.listing_events for pre-trigger history.
Climate risk First Street
- Flood 1/10 Low FEMA zone X (unshaded) · 0% chance over 30 yrs
- Wildfire 2/10 Low
- Heat 10/10 Extreme 7 d/yr ≥105°F today · 31 d/yr by 30 yrs out
- Wind 10/10 Extreme 99% chance of damaging wind over 30 yrs
- Air quality 2/10 Low 1 unhealthy d/yr today · 1 by 30 yrs out
Nearby sold comps map
Loading sold comps map…
Walkable amenities ~0.75 mi
Loading nearby amenities…
Taxation est. · year 1
- Rental income
- $27,746
- − Mortgage interest
- −$12,267
- − Property taxes
- −$3,285
- − Insurance
- −$1,095
- − Repairs & maintenance
- −$2,220
- − Management
- −$2,220
- − HOA
- −$4,668
- − Depreciation
- −$6,371
- Taxable loss
- −$4,379
- Est. tax savings @ 24.0%
- +$1,051
- After-tax cash flow
- $141/yr
For passive investors: Depreciation is non-cash, so a rental often shows a tax loss while cash-flowing — sheltering income. Rental losses are passive: they offset passive income freely, and up to $25,000/yr can offset ordinary (W-2) income if you actively participate and your MAGI is under $100k (phasing out to $0 by $150k); unused losses carry forward. On sale, claimed depreciation is recaptured at up to 25%, and gains may owe capital-gains tax (a 1031 exchange can defer both). Figures are a year-1 estimate at your 24.0% rate — not tax advice; consult a CPA.
Condition & rehab AI · 10 photos
This 1-bedroom, 1-bath apartment is in good condition with some minor repairs needed. It offers a bright and open layout with stunning views and is located in a prime Miami location. With some updates, it can significantly increase its resale and rental value.
Repairs flagged
- Minor Kitchen cabinets — Light wear and tear.
- Minor Bathroom walls — Some discoloration visible.
- Minor Balcony flooring — Worn appearance of the flooring and furniture.
Value-add opportunities
- Both Paint interior walls and trim — Fresh paint can enhance the overall appearance and value.
- Both Replace worn-out flooring and furniture on the balcony — Fresh flooring and furniture will improve the curb appeal and rental value.
- Both Deep clean and organize the kitchen and bathroom — A clean and organized space will attract more potential buyers and renters.
- Both Install new light fixtures in the kitchen and bathroom — New light fixtures can brighten up the spaces and make them more appealing to potential buyers and renters.
Renovation cost estimate screening
| Repair item | Severity | Est. cost |
|---|---|---|
| Kitchen cabinets · Light wear and tear. | Minor | $500–3,000 |
| Bathroom walls · Some discoloration visible. | Minor | $500–3,000 |
| Balcony flooring · Worn appearance of the flooring and furniture. | Minor | $500–3,000 |
| Total estimated repair cost · 3 items | $1,500–9,000 |
Value-add ROI direction
- Both Paint interior walls and trim — Fresh paint can enhance the overall appearance and value. ↑
- Both Replace worn-out flooring and furniture on the balcony — Fresh flooring and furniture will improve the curb appeal and rental value. ↑
- Both Deep clean and organize the kitchen and bathroom — A clean and organized space will attract more potential buyers and renters. ↑
- Both Install new light fixtures in the kitchen and bathroom — New light fixtures can brighten up the spaces and make them more appealing to potential buyers and renters. ↑
ⓘ Cost ranges are severity-bucket heuristics (US national rule-of-thumb). Get contractor quotes + a written scope before underwriting a rehab budget.
Schools (NCES district)
- District
- Miami-Dade
- NCES district ID
- 1200390
- Math proficiency
- 45% ▼ -16.00%
- Reading proficiency
- 54% ▼ -5.00%
- Median HH income
- $43,928
- Composite
- 41.76/100
- National rank
- #3397
- State rank
- #40 of 73 in FL
Livability — Kendale Lakes
- Score
- 77/100
- State rank
- #186
- US rank
- #2923
Category grades
Schools grade is shown separately in the Schools card above.
Census & demographics
- Census place
- Kendale Lakes, FL
- County
- Miami-Dade County · 2,697,751 people
- City population
- 33,811
- Metro
- Miami-Fort Lauderdale-Pompano Beach, FL
- Population (ZIP)
- 33,527
- Household income
- $70,218
- Rent vs Own
- Severe rent burden
- 1416.0
Population outlook (Miami-Dade County) Hauer SSP2
- Today (2025)
- 3,126,439 people
- By 2030
- 3,325,765 · +6.4%
- By 2040
- 3,697,561 · +18.3%
- By 2050
- 4,012,134 · +28.3%
- By 2075
- 4,605,612 · +47.3%
- By 2100
- 4,866,598 · +55.7%
Race, ethnicity, and origin ACS 2023
- Neighborhood character
- Predominantly Hispanic (84%)
- Race & ethnicity
- Hispanic / Latino 84% Two or more races 52% White 13% Black 1% Asian 1%
- Hispanic origin (detail)
- Mexican 1% Puerto Rican 2% Cuban 53% Dominican 1%
- Common ancestry
- Romanian 1%
- Foreign-born
- 63% · Canada, Jamaica
- Languages at home
- 15% English-only · Spanish 83% French/Haitian/Cajun 1% Other Indo-European 1%
Political lean MEDSL · Miami-Dade
- 2024 margin
- R (+11.4) · D 43.9% · R 55.4%
- 2008→2024 swing
- -27.6pp toward R · 2008: 16.1pp · 2024: -11.4pp
- All cycles
- 2024: R+11.4 2020: D+7.3 2016: D+29.6 2012: D+23.7 2008: D+16.1
Not yet ingested
- Civics
- —
Market trends
- HPI YoY
- ▼ -331.51%
- Current HPI
- 385.8798
- Rent YoY
- ▼ -0.10%
- Metro
- Miami-Fort Lauderdale-Pompano Beach, FL
- State GDP YoY
- ▲ 3.28%
- F500 in state
- 36
Industry mix (Fortune 500 HQ in FL)
| Industry | F500 HQs | Revenue |
|---|---|---|
| Industrial Technology | 2 | $29B |
|
||
| Insurance | 2 | $17B |
|
||
| Retail | 1 | $60B |
|
||
| Technology Distribution | 1 | $58B |
|
||
| Homebuilding | 1 | $35B |
|
||
| Technology Manufacturing | 1 | $35B |
|
||
Price history
1 event — show timeline
- 2026-05-21 Listed $223,900 MARMLS
Cash-flow waterfall
monthlySold comps — $/sqft
last 12 mo · ≤1 miLoading sold comps…