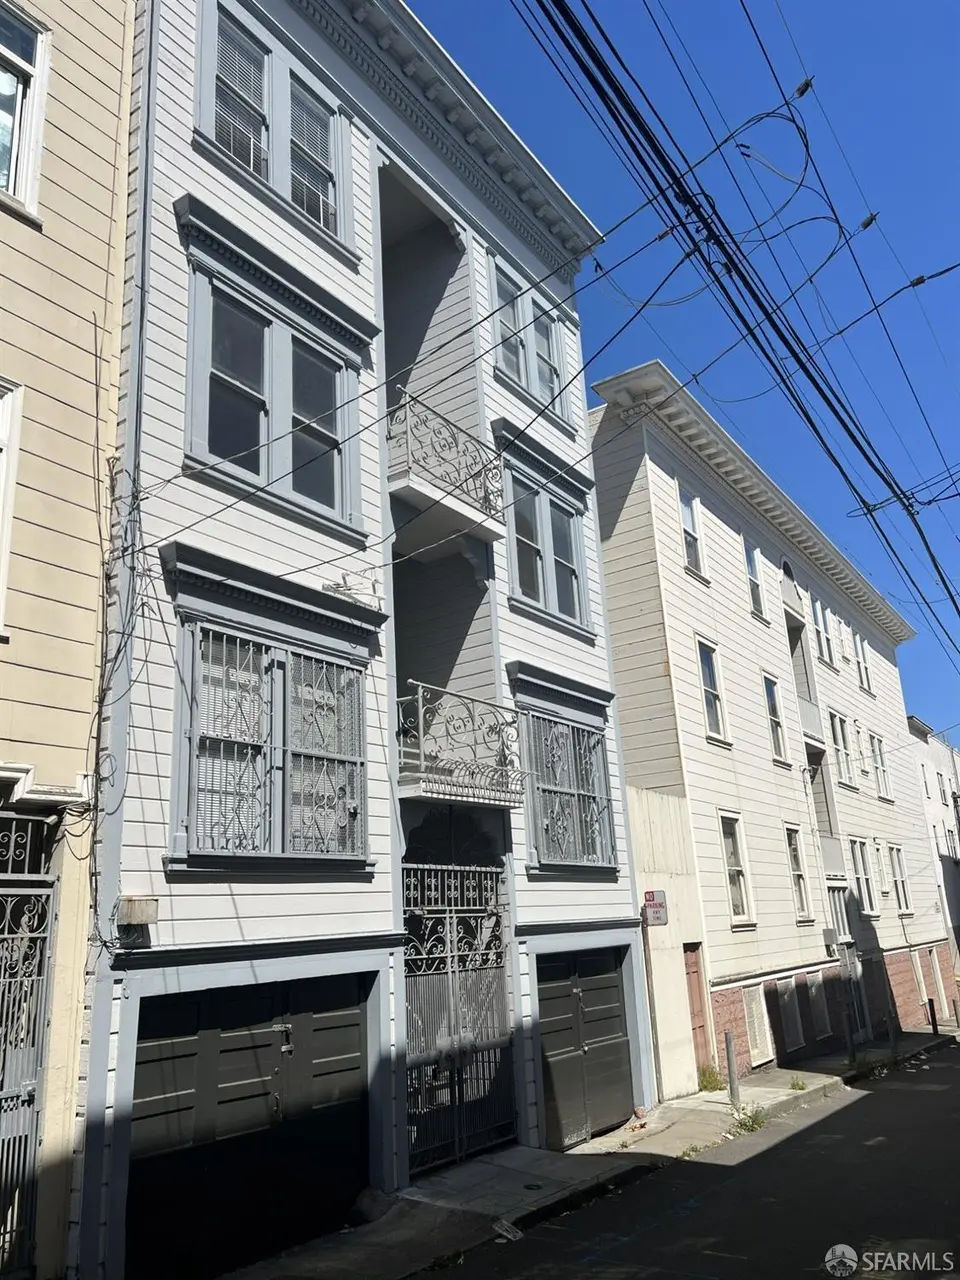
49 Auburn St #49 · San Francisco, CA
Flood risk 1/10 · Minimal
- FEMA flood zone
- X (unshaded)
- Chance of flooding over 30 yrs
- 0.0%
- Est. flood insurance / yr
- $507 – $1,088
Fire risk 1/10 · Minimal
- Est. fire insurance / yr
- $659 – $1,223
Heat risk 2/10 · Minimal
- Hot days now (above 79°F)
- 7 days/yr
- Hot days in 30 yrs
- 16 days/yr
Wind risk 1/10 · Minimal
- Chance of severe wind over 30 yrs
- —
Air-quality risk 8/10 · Major
- Unhealthy air days now
- 15 days/yr
- Unhealthy air days in 30 yrs
- 15 days/yr
Risk factors via First Street. Map © Google.
Why this score? — see what drove the C grade
The composite is a weighted blend of 9 inputs, each scored 0–100. Each bar is that input's sub-score; the figure is the points it added to the 100-point composite (weight × sub-score).
- ARV discount +15.0/15.0
- Cash flow +11.2/30.0
- Appreciation +8.2/10.0
- 1% rule +5.6/10.0
- Rent growth +5.0/5.0
- Schools +5.0/10.0
- Livability +3.8/5.0
- DSCR +3.3/10.0
- Condition / age +2.0/5.0
$488,000
🖨 Deal sheet (PDF) 📄 Offer letter ✓ Due diligence
Listing remarks MLS
Gorgeous Bay Bridge view from the front door! Updated top-floor 2BR/1BA unit in prime Nob Hill, near Chinatown, Russian Hill, and North Beach. Brand-new remodeled kitchen with quartz countertops, upgraded central heating, and wall-to-wall carpeting throughout. High ceiling. Lowest price in the building. Walk to Chinatown shopping, Financial District, restaurants, and public transportation. Ideal for owner use or investment.
Key facts
- Central heating
- Quartz countertops
- Remodeled kitchen
Tags
Neighborhood map
What this means for you Summary
Snapshot
- This is a 2-bed/1.0-bath single-family listed at $488k. Condition is rated fair.
Deal economics
- At list price, monthly cash flow is $-186 ($-2k/yr) — negative.
- To cash-flow at today's rent, offer at most $461k (5.5% below list).
- Meets the 1% rule at list price ($5k rent vs $488k).
- Recommended offer: $444k (9.0% below list) — sets the bar for market timing.
- Cap rate 5.8% vs local median 2.1% in San Francisco — top-decile yield for the area; either an underpriced asset or a hidden risk that comps aren't pricing in. Stress-test before assuming the spread holds.
Location & tenants
- Location reads 76/100 on livability (#90 in CA, #3,143 nationally) — a middle-class / working-renter tenant base. Strengths: amenities A+, commute A+, employment A+; Watch: crime F, cost of living F.
- San Francisco Unified (urban): math 50% / reading 56% proficiency, ranked #322 of 1,400 in CA (top 23%) — acceptable for families but not a draw, mixed tenant base, ~2y average lease.
- Zoned schools: Lilienthal (Claire) Elementary (669 students, 19% FRL); Giannini (A.P.) Middle (1,192 students, 34% FRL); Lowell High (2,632 students, 37% FRL) — zoned schools average 30% FRL vs 49% district-wide (19 pts lower); this property's tenant base skews higher-income than the district average.
- Market conditions: Rents rising fast (+16.9%/yr); 61 active listings in the ZIP; 40 comparable units currently listed for rent nearby; rentals at typical pace (median 15d on market — plan ~3-4 weeks tenant-placement turnaround); solid renter incomes; 750 units permitted in San Francisco County in 2024 (688 in 5+ unit buildings).
- At $5,160/mo this rent would consume 71% of the median local household income ($87k/yr) (locally 2027% of renters already pay >50% of income on rent) — very limited rent-growth headroom before tenants either downsize or default.
Forward outlook
- In year one you build about $35k of equity ($3k loan paydown + $31k appreciation (6.4% local appreciation)).
- San Francisco County population projected at +39% by 2050 — long-run rental-demand tailwind backs the buy-and-hold thesis.
- By year 2, paydown + projected appreciation supports a ~$56k cash-out refi (75% LTV) — recoverable capital for the next deal without selling this one.
Negotiation context
- It's been on market 116 days — a 9% lower offer ($444k) is reasonable based on typical stale-listing flexibility.
Risks & watch-outs
- Watch-outs: built in 1914 — expect roof / HVAC / electrical / plumbing capex.
Questions for the listing agent
- What do current leases actually rent for vs. the listed asking? Can we see a recent rent roll and the last 12 months of T-12 income?
- It's been on market 116 days. Have you received any prior offers? Is the seller open to a 9% concession, seller financing, or rate buy-down credit?
- Have any recent inspections been done? Can we get a copy of the seller's disclosures and any deferred-maintenance estimates?
- Built in 1914 — when were the roof, HVAC, electrical panel, plumbing, and water heater last replaced?
- What does the HOA fee cover, when was the last increase, and are there any pending special assessments or reserve-fund shortfalls?
- Why hasn't it sold? Are there any deal-killer items the seller is aware of (foundation, flood, title, zoning, code violations)?
- Is there a deadline driving the sale (1031 exchange, divorce, estate, relocation)? That informs how much negotiation room exists.
- Schools are B-rated — typically a magnet for longer-tenancy family renters. What's the average tenant stay here, and is there a school-zone premium baked into asking?
- Crime grade is F in this area — have there been break-ins, vandalism, or insurance claims at this property in the last 3 years? What carrier currently insures it and at what premium?
- What's the average days-on-market for RENTAL listings here right now (not sales)? A rising rental-DOM trend means longer vacancies and softer asking-rent achievability than the comps imply.
- What's the recent tenant-quality profile in this submarket — average credit score on applications, eviction rate, late-payment / NSF rate, and stable-employment percentage? A property-management company in the area should have these aggregated.
- How much new for-sale + rental construction is in the pipeline within 1–3 miles? Heavy new supply typically softens prices + rents 12–24 months out; constrained supply supports both.
Investment metrics
- 1% rule
- 1.06% ✓
- Cap rate
- 5.84%
- Cash-on-cash
- -1.63%
- DSCR
- 0.93
- GRM
- 7.9
CMA / ARV
- ARV (median comp)
- $807,180
- List price
- $488,000
- Delta
- -39.54%
- Verdict
- UNDERPRICED
- Comps
- 20 within 1.0 mi
Show comp detail 12 sales within ~0.75 mi
| Address | Dist | Beds/Ba | Sqft | Sold | Price | $/sf | Match |
|---|---|---|---|---|---|---|---|
| 1530 Jones St #4 | 0.12mi | 1/1.0 (-1) | 804 (+0%) | 11mo | $730,000 | $908 | 80 |
| 1449 Hyde St #3 | 0.33mi | 2/1.0 | 821 (+3%) | 5mo | $760,000 | $926 | 76 |
| 1449 Hyde St #5 | 0.33mi | 2/1.0 | 821 (+3%) | 6mo | $775,000 | $944 | 75 |
| 1250 Vallejo St #2 | 0.32mi | 2/1.0 | 782 (-2%) | 11mo | $820,000 | $1,049 | 72 |
| 1324 California St Unit A | 0.37mi | 2/1.0 | 809 (+1%) | 12mo | $649,000 | $802 | 71 |
| 1250 Vallejo St #8 | 0.32mi | 2/1.0 | 854 (+7%) | 10mo | $750,000 | $878 | 65 |
| 1133-b Filbert St | 0.41mi | 1/1.0 (-1) | 828 (+4%) | 11mo | $480,000 | $580 | 61 |
| 1250 Vallejo St #1 | 0.32mi | 2/1.0 | 885 (+11%) | 11mo | $815,000 | $921 | 58 |
| 375 Green St | 0.48mi | 1/1.0 (-1) | 745 (-7%) | 6mo | $660,000 | $886 | 56 |
| 585 Francisco St | 0.60mi | 2/1.0 | 881 (+10%) | 2mo | $850,000 | $965 | 53 |
| 1754 Larkin St #5 | 0.39mi | 1/1.0 (-1) | 715 (-11%) | 8mo | $840,000 | $1,175 | 53 |
| 1100 Leavenworth St #5 | 0.35mi | 2/2.0 | 893 (+12%) | 11mo | $790,000 | $885 | 51 |
Match score weights: distance 35% · size 25% · config 20% · recency 20%. Top-matched comps best support the ARV.
Projected returns pro-forma
6.44% appreciation · 8.0% rent growth · sell at horizon
- IRR
- 17.7%
- Equity multiple
- 2.24×
- Total profit
- $169,809
- Equity at exit
- $320,456
- IRR
- 19.5%
- Equity multiple
- 5.21×
- Total profit
- $574,589
- Equity at exit
- $593,320
Cash invested: $136,640 (down + closing). Projections, not guarantees.
Landlord ↔ Tenant lean methodology
- Overall (CITY)
- 0 Strongly Tenant-Friendly
- State California
- 18 Strongly Tenant-Friendly · D+13
- County
- — inherits STATE
- City San Francisco
- 0 Strongly Tenant-Friendly · D+57
ZIP-level market 94133
- Home prices YoY
- 4.0%
- Rents YoY
- 16.9%
- Active inventory
- 61
- Price-to-rent
- 7.9×
Monthly cashflow live
- Estimated rent
- $5,160 high interval (Pro) →
- Mortgage (P&I)
- −$2,559
- Tax est. 1.5%
- −$610 /mo · $7,320/yr
- Insurance
- −$203
- HOA
- −$890
- Vacancy / Maint / Mgmt
- −$1,084
- Net cashflow
- $-186
Break-even live
Sensitivity live
| Price | -10% $151 | -5% $-17 | +0% $-186 | +5% $-355 | +10% $-523 |
|---|---|---|---|---|---|
| Rent | -10% $-594 | -5% $-390 | +0% $-186 | +5% $18 | +10% $222 |
| Rate | -1.0pp $60 | -0.5pp $-62 | base $-186 | +0.5pp $-312 | +1.0pp $-441 |
UW: 25.0% down · 7.5% · 30yr · 1.5% tax · 5.0% vac · 8.0% maint · 8.0% mgmt
Financing live
Cash to close
- Down payment
- $122,000
- Closing costs
- $14,640
- Reserves months
- —
- Total cash needed
- —
Loan-product check · same deal, 3 products live
Conventional
25% down · 7.5% · 30yr
- Down + closing
- —
- Monthly P&I
- —
- Monthly cashflow
- —
- DSCR
- —
- Eligible?
- —
Personal DTI + credit; lowest rate.
DSCR
20% down · 8.5% · 30yr
- Down + closing
- —
- Monthly P&I
- —
- Monthly cashflow
- —
- DSCR
- —
- Eligible?
- —
No personal income docs; deal must DSCR.
Hard money
10% down · 12.0% · 12mo
- Down + closing
- —
- Monthly P&I
- —
- Monthly cashflow
- —
- DSCR
- —
- Eligible?
- —
Short-term bridge; refi at stabilization.
Rent comps 40 comps
| Address | Beds | Baths | Sqft | Rent | $/sqft | DOM | Units | Dist |
|---|---|---|---|---|---|---|---|---|
| 1425 Taylor St San Francisco, CA | 1.0 | 1.0 | 554 | $4,845 | $8.75 | 26d | 1 | 0.05mi |
| 1212 Pacific Ave Unit 3 San Francisco, CA | 3.0 | 2.0 | 1000 | $5,100 | $5.10 | 7d | 1 | 0.13mi |
| 1401 Jones St San Francisco, CA | 1.0 | 1.0 | 550 | $5,500 | $10.00 | 9d | 1 | 0.16mi |
| 1224 Sacramento St Unit 1569483P San Francisco, CA | 1.0 | 1.0 | 893 | $7,512 | $8.41 | 7d | 1 | 0.23mi |
| 1221 Jones St San Francisco, CA | 1.0 | 1.0 | 650 | $7,000 | $10.77 | 14d | 1 | 0.25mi |
| 1808 Leavenworth St San Francisco, CA | 3.0 | 1.0 | 1100 | $6,475 | $5.89 | 45d | 1 | 0.25mi |
| 959-961 Union St Unit 02 San Francisco, CA | 1.0 | 1.0 | 650 | $3,600 | $5.54 | 5d | 1 | 0.27mi |
| 1450 Washington St Unit 1450-07 San Francisco, CA | 2.0 | 1.0 | 818 | $6,500 | $7.95 | 12d | 1 | 0.27mi |
| 770 Filbert St Unit 3 San Francisco, CA | 2.0 | 1.0 | 1050 | $5,190 | $4.94 | 45d | 1 | 0.36mi |
| 1557 Washington St San Francisco, CA | 1.0 | 1.0 | 600 | $3,795 | $6.33 | 26d | 1 | 0.36mi |
| 903 Pine St San Francisco, CA | 1.0 | 1.0 | 757 | $4,495 | $5.94 | 45d | 1 | 0.39mi |
| 1145 Pine St #21 San Francisco, CA | 1.0 | 1.0 | 600 | $3,100 | $5.17 | 0d | 1 | 0.42mi |
| 1408 California St San Francisco, CA | 2.0 | 2.0 | 830 | $6,295 | $7.58 | 0d | 1 | 0.42mi |
| 800 Bush St San Francisco, CA | 2.0 | 1.0 | 1020 | $4,650 | $4.56 | 45d | 1 | 0.43mi |
| 1024 Bush St San Francisco, CA | 3.0 | 2.5 | 900 | $4,750 | $5.28 | 45d | 1 | 0.45mi |
| 1501 Larkin St San Francisco, CA | 2.0 | 1.0 | 1000 | $4,200 | $4.20 | 0d | 1 | 0.45mi |
| 2233 Larkin St San Francisco, CA | 2.0 | 1.0 | 1100 | $6,200 | $5.64 | 4d | 1 | 0.46mi |
| 737 Bush St San Francisco, CA | 1.0 | 1.0 | 750 | $2,595 | $3.46 | 16d | 1 | 0.47mi |
| 540 Stockton St Apt 8 San Francisco, CA | 2.0 | 1.0 | 725 | $5,370 | $7.41 | 4d | 1 | 0.47mi |
| 1140 Greenwich St Unit 301 San Francisco, CA | 1.0 | 1.0 | 1100 | $3,500 | $3.18 | 45d | 1 | 0.48mi |
| 845 Sutter St San Francisco, CA | 1.0 | 1.0 | 700 | $2,895 | $4.14 | 16d | 1 | 0.54mi |
| 650 Chestnut St #104 San Francisco, CA | 2.0 | 2.0 | 1080 | $6,500 | $6.02 | 9d | 1 | 0.55mi |
| 600 Chestnut St #301 San Francisco, CA | 2.0 | 2.0 | 1098 | $5,600 | $5.10 | 45d | 1 | 0.55mi |
| 1142-1146 Montgomery St Unit 1142-A San Francisco, CA | 1.0 | 1.0 | 709 | $4,995 | $7.05 | 26d | 1 | 0.56mi |
| 965 Sutter St San Francisco, CA | 2.0 | 1.0–2.0 | 618 | $3,755 | $6.07 | 0d | 1 | 0.57mi |
| 71 Water St Unit 301 San Francisco, CA | 2.0 | 1.0 | 763 | $5,950 | $7.80 | 45d | 1 | 0.57mi |
| 71 Water St Unit 101 San Francisco, CA | 2.0 | 1.0 | 738 | $5,850 | $7.93 | 45d | 1 | 0.57mi |
| 71 Water St Unit 401 San Francisco, CA | 2.0 | 1.0 | 763 | $6,295 | $8.25 | 45d | 1 | 0.57mi |
| 725 Leavenworth St Unit 5 San Francisco, CA | 2.0 | 2.0 | 742 | $4,600 | $6.20 | 16d | 1 | 0.58mi |
| 737 Post St San Francisco, CA | 2.0 | 1.0–2.0 | 515 | $4,955 | $9.61 | 0d | 10 | 0.59mi |
| 1080 Sutter St San Francisco, CA | 2.0 | 1.0 | 750 | $4,150 | $5.53 | 45d | 1 | 0.60mi |
| 81 Frank Norris St San Francisco, CA | 1.0 | 1.0 | 620 | $1,700 | $2.74 | 15d | 1 | 0.61mi |
| 1737 Jackson St Unit 304 San Francisco, CA | 1.0 | 1.0 | 675 | $4,995 | $7.40 | 0d | 1 | 0.62mi |
| 1755 Van Ness Ave San Francisco, CA | 1.0 | 1.0 | 748 | $5,020 | $6.71 | 0d | 2 | 0.62mi |
| 1755 Van Ness Ave San Francisco, CA | 1.0 | 1.0 | 947 | $5,195 | $5.49 | 15d | 1 | 0.62mi |
| 1735 Van Ness Ave San Francisco, CA | 2.0 | 1.0 | 1064 | $12,225 | $11.49 | 9d | 2 | 0.62mi |
| 2415 Van Ness Ave #502 San Francisco, CA | 1.0 | 1.0 | 566 | $3,500 | $6.18 | 0d | 1 | 0.63mi |
| 33 Vandewater St #103 San Francisco, CA | 2.0 | 2.0 | 950 | $6,900 | $7.26 | 20d | 1 | 0.63mi |
| 1472 Filbert St San Francisco, CA | 2.0 | 1.0 | 941 | $7,895 | $8.39 | 13d | 1 | 0.63mi |
| 676 Geary St San Francisco, CA | 1.0–2.0 | 1.0 | 616 | $4,340 | $7.04 | 3d | 2 | 0.64mi |
HOA detail
- Monthly dues
- $890 · $10,680/yr
Listing history 2 events
-
2026-05-31days on market $488,000 Active 116 DOM
-
2026-02-04$488,000 Active 427-char remark
Show marketing remark (427 chars)
Gorgeous Bay Bridge view from the front door! Updated top-floor 2BR/1BA unit in prime Nob Hill, near Chinatown, Russian Hill, and North Beach. Brand-new remodeled kitchen with quartz countertops, upgraded central heating, and wall-to-wall carpeting throughout. High ceiling. Lowest price in the building. Walk to Chinatown shopping, Financial District, restaurants, and public transportation. Ideal for owner use or investment.
ⓘ Source: listings_history table (triggers on properties + properties_extension) + one-shot
backfill from property_details.listing_events for pre-trigger history.
Climate risk First Street
- Flood 1/10 Low FEMA zone X (unshaded) · 0% chance over 30 yrs
- Wildfire 1/10 Low
- Heat 2/10 Low 7 d/yr ≥79°F today · 16 d/yr by 30 yrs out
- Wind 1/10 Low
- Air quality 8/10 Severe 15 unhealthy d/yr today · 15 by 30 yrs out
Nearby sold comps map
Loading sold comps map…
Walkable amenities ~0.75 mi
Loading nearby amenities…
Taxation est. · year 1
- Rental income
- $61,922
- − Mortgage interest
- −$27,336
- − Property taxes
- −$7,320
- − Insurance
- −$2,440
- − Repairs & maintenance
- −$4,954
- − Management
- −$4,954
- − HOA
- −$10,680
- − Depreciation
- −$14,196
- Taxable loss
- −$9,957
- Est. tax savings @ 24.0%
- +$2,390
- After-tax cash flow
- $159/yr
For passive investors: Depreciation is non-cash, so a rental often shows a tax loss while cash-flowing — sheltering income. Rental losses are passive: they offset passive income freely, and up to $25,000/yr can offset ordinary (W-2) income if you actively participate and your MAGI is under $100k (phasing out to $0 by $150k); unused losses carry forward. On sale, claimed depreciation is recaptured at up to 25%, and gains may owe capital-gains tax (a 1031 exchange can defer both). Figures are a year-1 estimate at your 24.0% rate — not tax advice; consult a CPA.
Condition & rehab AI · 1 photo
A well-maintained, updated 2BR/1BA unit with a prime location and Bay Bridge view. Moderate rehab level with good condition and minimal repairs needed.
Value-add opportunities
- Resale Paint exterior — Enhances curb appeal and property value
- Rental Clean windows — Improves natural light and air circulation
Renovation cost estimate screening
Value-add ROI direction
- Resale Paint exterior — Enhances curb appeal and property value ↑
- Rental Clean windows — Improves natural light and air circulation ↑
ⓘ Cost ranges are severity-bucket heuristics (US national rule-of-thumb). Get contractor quotes + a written scope before underwriting a rehab budget.
Schools (NCES district)
- District
- San Francisco Unified
- NCES district ID
- 0634410
- Math proficiency
- 50% ▬ 0.00%
- Reading proficiency
- 56% ▲ 1.00%
- Median HH income
- $81,249
- Composite
- 50.14/100
- National rank
- #4088
- State rank
- #322 of 1400 in CA
Livability — San Francisco
- Score
- 76/100
- State rank
- #90
- US rank
- #3143
Category grades
Schools grade is shown separately in the Schools card above.
Census & demographics
- Census place
- San Francisco, CA
- County
- San Francisco County · 827,552 people
- City population
- 827,552
- Metro
- San Francisco-Oakland-Berkeley, CA
- Population (ZIP)
- 23,804
- Household income
- $87,191
- Rent vs Own
- Severe rent burden
- 2027.0
Population outlook (San Francisco County) Hauer SSP2
- Today (2025)
- 1,030,936 people
- By 2030
- 1,110,409 · +7.7%
- By 2040
- 1,270,010 · +23.2%
- By 2050
- 1,435,001 · +39.2%
- By 2075
- 1,779,074 · +72.6%
- By 2100
- 1,966,767 · +90.8%
Race, ethnicity, and origin ACS 2023
- Neighborhood character
- Diverse neighborhood (Simpson 0.65)
- Race & ethnicity
- Asian 48% White 34% Hispanic / Latino 11% Two or more races 9% Black 3%
- Hispanic origin (detail)
- Mexican 5%
- Common ancestry
- Romanian 3% Slovak 2% Lithuanian 2%
- Foreign-born
- 40% · China, Canada, South Korea
- Languages at home
- 53% English-only · Chinese 34% Spanish 5% Other Indo-European 3%
Political lean MEDSL · San Francisco
- 2024 margin
- Solid D (+64.8) · D 80.3% · R 15.5% · Other 4.1%
- 2008→2024 swing
- -5.7pp toward R · 2008: 70.5pp · 2024: 64.8pp
- All cycles
- 2024: D+64.8 2020: D+72.5 2016: D+76.1 2012: D+70.2 2008: D+70.5
Not yet ingested
- Civics
- —
Market trends
- HPI YoY
- ▲ 6.44%
- Current HPI
- 168.565
- Rent YoY
- ▲ 16.95%
- Metro
- San Francisco-Oakland-Berkeley, CA
- State GDP YoY
- ▲ 3.21%
- F500 in state
- 116
Industry mix (Fortune 500 HQ in CA)
| Industry | F500 HQs | Revenue |
|---|---|---|
| Technology | 27 | $1,492B |
|
||
| Financial Services | 3 | $174B |
|
||
| Retail | 3 | $44B |
|
||
| Insurance | 3 | $26B |
|
||
| Media / Entertainment | 2 | $115B |
|
||
| Pharmaceuticals / Biotech | 2 | $62B |
|
||
Price history
1 event — show timeline
- 2026-02-04 Listed $488,000 San Francisco MLS
Cash-flow waterfall
monthlySold comps — $/sqft
last 12 mo · ≤1 miLoading sold comps…