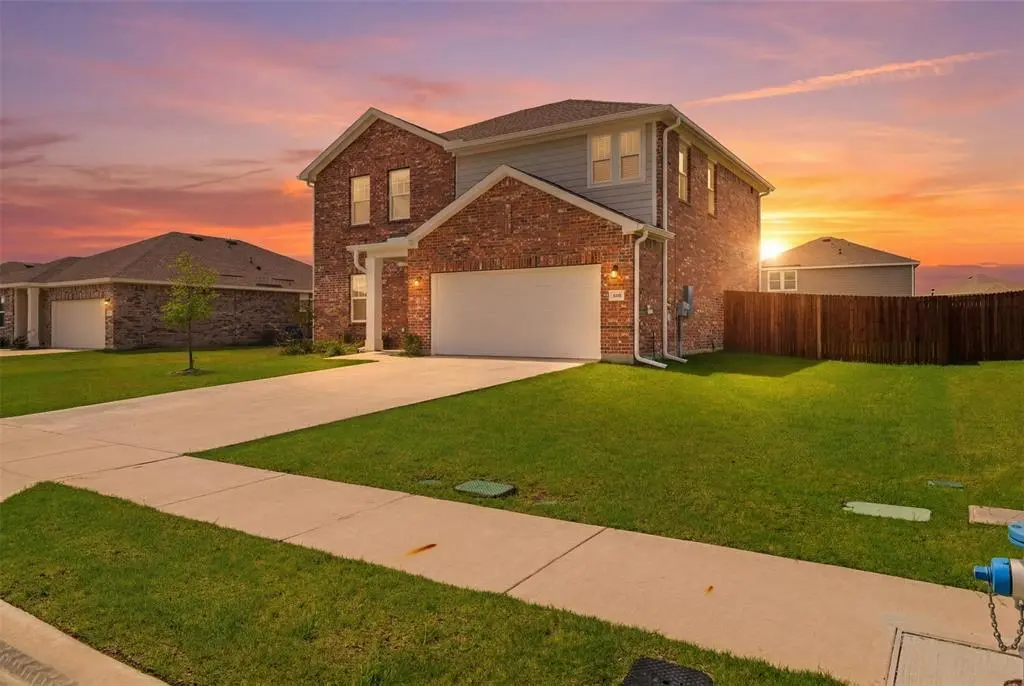
831 Lexington Ln · Nevada, TX
Flood risk No data
- FEMA flood zone
- —
- Chance of flooding over 30 yrs
- —
- Est. flood insurance / yr
- —
Fire risk No data
- Est. fire insurance / yr
- —
Heat risk No data
- Hot days now (above threshold)
- —
- Hot days in 30 yrs
- —
Wind risk No data
- Chance of severe wind over 30 yrs
- —
Air-quality risk No data
- Unhealthy air days now
- —
- Unhealthy air days in 30 yrs
- —
Risk factors via First Street. Map © Google.
Why this score? — see what drove the D+ grade
The composite is a weighted blend of 9 inputs, each scored 0–100. Each bar is that input's sub-score; the figure is the points it added to the 100-point composite (weight × sub-score).
- ARV discount +15.0/15.0
- Appreciation +10.0/10.0
- Cash flow +7.7/30.0
- Schools +3.2/10.0
- Livability +3.2/5.0
- Rent growth +2.5/5.0
- Condition / age +2.5/5.0
- DSCR +1.8/10.0
- 1% rule +1.7/10.0
$314,000
🖨 Deal sheet (PDF) 📄 Offer letter ✓ Due diligence
Listing remarks
Move-in ready 4-bedroom, 2.5-bath home built in 2024 in the growing Liberty Ranch community of Josephine. This open-concept floor plan features granite countertops, a large kitchen island, walk-in pantry, abundant natural light, and spacious bedrooms with walk-in closets. The primary suite offers a private bath with separate shower and walk-in closet. Refrigerator, washer, and dryer are included. Recent upgrades include a garage door opener and 6-inch gutters with downspouts. Located in Community ISD with convenient access to McKinney, Princeton, and Greenville. Don't miss this opportunity to own a newer home in one of Collin County's fastest-growing areas. Schedule your showing today!
Key facts
- Home office setup
- Open-concept layout
- 9,017 sq ft lot
Tags
Property features AI
Finance
- Other: Soil type: Black; Lot features: Less than 0.5 acre (approx. 0.207 acres); Parcel number: R1321600F03501; Restrictions: None
- HOA & community: Mandatory association; Annual association fee of $500; Association covers grounds maintenance; HOA managed by vission communities (972-612-2303)
Exterior
- Parking: Attached garage; 2-car garage (approximately 20' x 20'); 2 covered parking spaces
- Utilities: City water; City sewer; Not in a municipal utility district
- Home design: Single family residence; Two levels; Residential property; Built in 2024; Subdivision: Liberty Ranch
- Construction: New construction (2024)
- Exterior features: Wood fencing; Interior lot
Interior
- Kitchen: Dishwasher; Disposal; Electric cooktop; Microwave; Refrigerator; Granite counters; Kitchen island; Pantry
- Bedrooms: 4 bedrooms; Primary bedroom on level 2 with walk-in closet
- Bathrooms: 2 full bathrooms; 1 half bathroom
- Interior features: Granite counters; Kitchen island; Open floorplan; Pantry; High-speed internet available
- Laundry & utility: Washer; Dryer
Neighborhood map
What this means for you Summary
Snapshot
- This is a 4-bed/2.5-bath single-family listed at $314k.
Deal economics
- At list price, monthly cash flow is $-367 ($-4k/yr) — negative.
- To cash-flow at today's rent, offer at most $249k (20.6% below list).
- To meet the 1% rule (rent ≥ 1% of price), the offer needs to be $211k (32.7% below list).
- Recommended offer: $211k (32.7% below list) — sets the bar for 1% rule.
- Cap rate 4.9% vs local median 1.9% in Nevada — top-decile yield for the area; either an underpriced asset or a hidden risk that comps aren't pricing in. Stress-test before assuming the spread holds.
Location & tenants
- Location reads 63/100 on livability (#881 in TX) — a middle-class / working-renter tenant base. Strengths: employment A+, housing A+, crime A; Watch: amenities F, commute F, health & safety F.
- Community ISD (rural): math 30% / reading 38% proficiency, ranked #479 of 826 in TX (top 58%) — families likely to look elsewhere, expect single-tenant / working-renter base with shorter leases.
- Zoned schools: Nesmith El (math 46% / reading 46%, grade D-, #1,097 of 4,322 statewide, top 26%, 768 students, 44% FRL); Leland E Edge Middle (math 25% / reading 35%, grade F, #1,056 of 1,662 statewide, top 65%, 931 students, 53% FRL).
- Market conditions: 421 active listings in the ZIP; 4 comparable units currently listed for rent nearby; rentals lingering (median 46d on market — plan ~5-8 weeks vacancy on turnover, expect pricing pressure); 50% of comp listings sitting > 30 days — soft ceiling on asking rent; 19,194 units permitted in Collin County in 2024 (3,988 in 5+ unit buildings).
Forward outlook
- In year one you build about $34k of equity ($2k loan paydown + $31k appreciation (10.0% local appreciation)).
- Collin County population projected at +60% by 2050 — long-run rental-demand tailwind backs the buy-and-hold thesis.
- By year 2, paydown + projected appreciation supports a ~$54k cash-out refi (75% LTV) — recoverable capital for the next deal without selling this one.
Negotiation context
- Only 10 days on market — expect competitive offers; lowballing is unlikely to land.
- 4 sale attempts with the ask held roughly flat each time — persistent listings suggest the price (not the market) is what's stuck; bring a comps-based counter.
Questions for the listing agent
- What do current leases actually rent for vs. the listed asking? Can we see a recent rent roll and the last 12 months of T-12 income?
- What does the HOA fee cover, when was the last increase, and are there any pending special assessments or reserve-fund shortfalls?
- Is there a deadline driving the sale (1031 exchange, divorce, estate, relocation)? That informs how much negotiation room exists.
- The area grade is low — what's the realistic commute time and amenity access for the typical tenant pool here? Any planned neighborhood developments (good or bad) we should know about?
- What's the average days-on-market for RENTAL listings here right now (not sales)? A rising rental-DOM trend means longer vacancies and softer asking-rent achievability than the comps imply.
- What's the recent tenant-quality profile in this submarket — average credit score on applications, eviction rate, late-payment / NSF rate, and stable-employment percentage? A property-management company in the area should have these aggregated.
- How much new for-sale + rental construction is in the pipeline within 1–3 miles? Heavy new supply typically softens prices + rents 12–24 months out; constrained supply supports both.
Investment metrics
- 1% rule
- 0.67% ✗
- Cap rate
- 4.89%
- Cash-on-cash
- -5.00%
- DSCR
- 0.78
- GRM
- 12.4
CMA / ARV
- ARV (on-the-fly)
- $465,847
- Comps found
- 3
Show comp detail 3 sales within ~0.75 mi
| Address | Dist | Beds/Ba | Sqft | Sold | Price | $/sf | Match |
|---|---|---|---|---|---|---|---|
| 706 Republic Row | 0.16mi | 3/2.0 (-1) | 2,374 (+14%) | 23mo | $479,000 | $202 | 44 |
| 703 Lexington Ln | 0.21mi | 3/2.0 (-1) | 2,374 (+14%) | 24mo | $560,000 | $236 | 41 |
| 804 Republic Row | 0.23mi | 3/2.0 (-1) | 2,374 (+14%) | 23mo | $529,000 | $223 | 40 |
Match score weights: distance 35% · size 25% · config 20% · recency 20%. Top-matched comps best support the ARV.
Projected returns pro-forma
10.0% appreciation · 3.0% rent growth · sell at horizon
- IRR
- 20.7%
- Equity multiple
- 2.68×
- Total profit
- $147,616
- Equity at exit
- $282,876
- IRR
- 18.8%
- Equity multiple
- 6.15×
- Total profit
- $452,961
- Equity at exit
- $610,033
Cash invested: $87,920 (down + closing). Projections, not guarantees.
Landlord ↔ Tenant lean methodology
- Overall (STATE)
- 87 Strongly Landlord-Friendly
- State Texas
- 87 Strongly Landlord-Friendly · R+5
- County
- — inherits STATE
- City
- — inherits STATE
ZIP-level market 75173
- Home prices YoY
- 3.1%
- Active inventory
- 421
- Price-to-rent
- 12.4×
Monthly cashflow live
- Estimated rent
- $2,112 medium interval (Pro) →
- Mortgage (P&I)
- −$1,647
- Tax from tax record
- −$216 /mo · $2,587/yr
- Insurance
- −$131
- HOA
- −$42
- Vacancy / Maint / Mgmt
- −$444
- Net cashflow
- $-367
Break-even live
Sensitivity live
| Price | -10% $-189 | -5% $-278 | +0% $-367 | +5% $-455 | +10% $-544 |
|---|---|---|---|---|---|
| Rent | -10% $-533 | -5% $-450 | +0% $-367 | +5% $-283 | +10% $-200 |
| Rate | -1.0pp $-208 | -0.5pp $-287 | base $-367 | +0.5pp $-448 | +1.0pp $-531 |
UW: 25.0% down · 7.5% · 30yr · 1.5% tax · 5.0% vac · 8.0% maint · 8.0% mgmt
Financing live
Cash to close
- Down payment
- $78,500
- Closing costs
- $9,420
- Reserves months
- —
- Total cash needed
- —
Loan-product check · same deal, 3 products live
Conventional
25% down · 7.5% · 30yr
- Down + closing
- —
- Monthly P&I
- —
- Monthly cashflow
- —
- DSCR
- —
- Eligible?
- —
Personal DTI + credit; lowest rate.
DSCR
20% down · 8.5% · 30yr
- Down + closing
- —
- Monthly P&I
- —
- Monthly cashflow
- —
- DSCR
- —
- Eligible?
- —
No personal income docs; deal must DSCR.
Hard money
10% down · 12.0% · 12mo
- Down + closing
- —
- Monthly P&I
- —
- Monthly cashflow
- —
- DSCR
- —
- Eligible?
- —
Short-term bridge; refi at stabilization.
Rent comps 4 comps
| Address | Beds | Baths | Sqft | Rent | $/sqft | DOM | Units | Dist |
|---|---|---|---|---|---|---|---|---|
| 831 Lexington Ln Nevada, TX | 4.0 | 2.5 | 2089 | $2,095 | $1.00 | 14d | 1 | 0.02mi |
| 1213 Bristlecone DR Josephine, TX | 4.0 | 2.0 | 1649 | $1,900 | $1.15 | 8d | 1 | 0.95mi |
| 422 E FM 6 Nevada, TX | 5.0 | 2.0 | 1942 | $2,700 | $1.39 | 45d | 1 | 1.35mi |
| 450 Collin St Nevada, TX | 3.0 | 2.0 | 1572 | $2,000 | $1.27 | 45d | 1 | 1.45mi |
HOA detail
- Monthly dues
- $42 · $504/yr
Listing history 9 events
-
2026-06-21days on market $314,000 Active 10 DOM
-
2026-06-18days on market $314,000 Active 7 DOM
-
2026-06-17days on market $314,000 Active 6 DOM
-
2026-06-16days on market $314,000 Active 5 DOM
-
2026-06-15remarks 694-char remark
-
2026-06-15days on market $314,000 Active 4 DOM
-
2026-06-13days on market $314,000 Active 2 DOM
-
2026-06-13remarks 674-char remark
-
2026-06-13$314,000 Active 1 DOM
ⓘ Source: listings_history table (triggers on properties + properties_extension) + one-shot
backfill from property_details.listing_events for pre-trigger history.
Tax reassessment forecast TX · Resets to sale price
- Current annual tax
- $2,587 · $216/mo
- Projected year-2 tax
- $5,746 · $479/mo
- Expected delta
- +$3,159/yr (+$263/mo · 122.1%)
ⓘ Screening estimate from a state-policy table — verify with the county assessor before closing.
Nearby sold comps map
Loading sold comps map…
Walkable amenities ~0.75 mi
Loading nearby amenities…
Taxation est. · year 1
- Rental income
- $25,345
- − Mortgage interest
- −$17,589
- − Property taxes
- −$2,587
- − Insurance
- −$1,570
- − Repairs & maintenance
- −$2,028
- − Management
- −$2,028
- − HOA
- −$504
- − Depreciation
- −$9,135
- Taxable loss
- −$10,095
- Est. tax savings @ 24.0%
- +$2,423
- After-tax cash flow
- $-1,976/yr
For passive investors: Depreciation is non-cash, so a rental often shows a tax loss while cash-flowing — sheltering income. Rental losses are passive: they offset passive income freely, and up to $25,000/yr can offset ordinary (W-2) income if you actively participate and your MAGI is under $100k (phasing out to $0 by $150k); unused losses carry forward. On sale, claimed depreciation is recaptured at up to 25%, and gains may owe capital-gains tax (a 1031 exchange can defer both). Figures are a year-1 estimate at your 24.0% rate — not tax advice; consult a CPA.
Schools (NCES district)
- District
- Community ISD
- NCES district ID
- 4814850
- Math proficiency
- 30% ▼ -23.00%
- Reading proficiency
- 38% ▼ -11.00%
- Median HH income
- $71,841
- Composite
- 31.58/100
- National rank
- #5951
- State rank
- #479 of 826 in TX
Livability — Nevada
- Score
- 63/100
- State rank
- #881
- US rank
- #15880
Category grades
Schools grade is shown separately in the Schools card above.
Census & demographics
- Population (ZIP)
- 9,284
Population outlook (Collin County) Hauer SSP2
- Today (2025)
- 1,210,074 people
- By 2030
- 1,358,201 · +12.2%
- By 2040
- 1,654,061 · +36.7%
- By 2050
- 1,937,359 · +60.1%
- By 2075
- 2,567,039 · +112.1%
- By 2100
- 2,952,048 · +144.0%
Race, ethnicity, and origin ACS 2023
- Neighborhood character
- Majority White (65%)
- Race & ethnicity
- White 65% Hispanic / Latino 28% Two or more races 15% Black 2% Native American 1%
- Hispanic origin (detail)
- Mexican 26%
- Common ancestry
- Slovak 2% Serbian 1% Iranian 1%
- Foreign-born
- 17% · Canada, Jamaica
- Languages at home
- 74% English-only · Spanish 24% Arabic 1%
Political lean MEDSL · Collin
- 2024 margin
- R (+11.1) · D 43.1% · R 54.3% · Other 2.6%
- 2008→2024 swing
- +14.4pp toward D · 2008: -25.6pp · 2024: -11.1pp
- All cycles
- 2024: R+11.1 2020: R+4.3 2016: R+17.0 2012: R+31.6 2008: R+25.6
Not yet ingested
- Civics
- —
Market trends
- HPI YoY
- ▲ 10.09%
- Current HPI
- 331.12
- Rent YoY
- —
- Metro
- —
- State GDP YoY
- ▲ 3.95%
- F500 in state
- 110
Industry mix (Fortune 500 HQ in TX)
| Industry | F500 HQs | Revenue |
|---|---|---|
| Energy | 16 | $1,198B |
|
||
| Technology | 5 | $198B |
|
||
| Engineering / Construction | 4 | $72B |
|
||
| Energy Services | 3 | $60B |
|
||
| Utilities | 3 | $41B |
|
||
| Healthcare | 2 | $330B |
|
||
Price history
+14852.4% since first listed6 events — show timeline
- 2026-06-12 Relisted — NTREIS
- 2026-06-11 Listed $314,000 NTREIS
- 2026-05-25 Price Changed $2,095 NTREIS
- 2026-04-30 Listed for Rent $2,195 NTREIS
- 2025-05-27 Rental Removed $2,100 NTREIS
- 2025-03-07 Listed for Rent $2,100 NTREIS
Property tax history
+153.7%/yrLatest (2025): $2,587 · +153.7% YoY. Source: county tax records.
Cash-flow waterfall
monthlySold comps — $/sqft
last 12 mo · ≤1 miLoading sold comps…