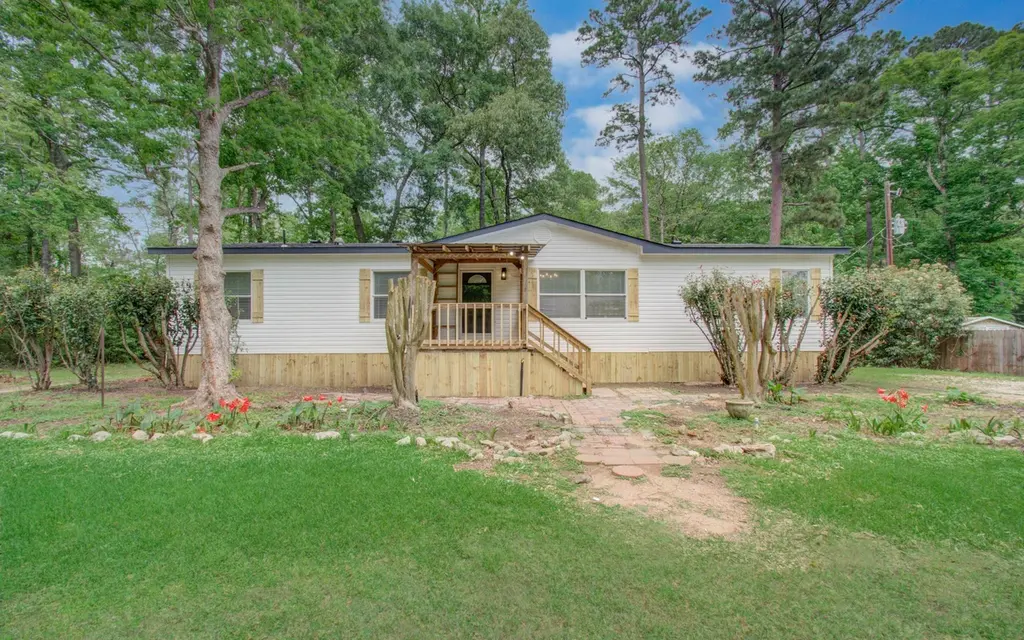
4537 Grand Oaks Dr · Willis, TX
Flood risk 6/10 · Moderate
- FEMA flood zone
- X (unshaded)
- Chance of flooding over 30 yrs
- 0.69%
- Est. flood insurance / yr
- $507 – $1,088
Fire risk 5/10 · Moderate
- Est. fire insurance / yr
- $1,222 – $2,270
Heat risk 8/10 · Major
- Hot days now (above 111°F)
- 7 days/yr
- Hot days in 30 yrs
- 24 days/yr
Wind risk 8/10 · Major
- Chance of severe wind over 30 yrs
- 99.0%
Air-quality risk 2/10 · Minimal
- Unhealthy air days now
- 1 days/yr
- Unhealthy air days in 30 yrs
- 1 days/yr
Risk factors via First Street. Map © Google.
Why this score? — see what drove the D grade
The composite is a weighted blend of 9 inputs, each scored 0–100. Each bar is that input's sub-score; the figure is the points it added to the 100-point composite (weight × sub-score).
- Cash flow +14.2/30.0
- ARV discount +7.8/15.0
- DSCR +4.3/10.0
- 1% rule +3.4/10.0
- Schools +3.2/10.0
- Livability +3.1/5.0
- Rent growth +2.7/5.0
- Condition / age +2.5/5.0
- Appreciation +0.9/10.0
$249,999
🖨 Deal sheet (PDF) 📄 Offer letter ✓ Due diligence
Listing remarks MLS
Welcome to 4537 Grand Oaks Dr in Willis, TX — a fully updated 4-bedroom, 2-bath manufactured home on just over 1 acre of unrestricted land. This property has been extensively renovated, featuring a new roof, fresh interior and exterior paint, granite countertops, updated kitchen backsplash, and new appliances. The home offers waterproof flooring throughout (no carpet), along with new ceiling fans, modern lighting, and a clean, cohesive finish. Both bathrooms have been completely remodeled, and the home includes spacious front and rear porches, ideal for enjoying the privacy and quiet of country living. With no restrictions, there’s plenty of flexibility for additional structures, parking, or personal use. A rare opportunity to own a move-in ready manufactured home with this level of upgrades and land.
Key facts
- Waterproof flooring
- New appliances
- 1.01 acre lot
Tags
Neighborhood map
What this means for you Summary
Snapshot
- This is a 4-bed/2.0-bath manufactured listed at $250k.
Deal economics
- At list price, monthly cash flow is $40 ($480/yr) — positive.
- The deal already cash-flows at list — no discount required.
- To meet the 1% rule (rent ≥ 1% of price), the offer needs to be $210k (16.1% below list).
- Recommended offer: $210k (16.1% below list) — sets the bar for 1% rule.
- Cap rate 6.5% vs local median 4.7% in Willis — top-decile yield for the area; either an underpriced asset or a hidden risk that comps aren't pricing in. Stress-test before assuming the spread holds.
Location & tenants
- Location reads 62/100 on livability (#933 in TX) — a middle-class / working-renter tenant base. Strengths: cost of living A+, housing A+; Watch: crime C-, employment D+, amenities F.
- Willis ISD (rural): math 33% / reading 40% proficiency, ranked #458 of 826 in TX (top 55%) — families likely to look elsewhere, expect single-tenant / working-renter base with shorter leases.
- Zoned schools: C C Hardy El (math 32% / reading 29%, grade F, #2,464 of 4,322 statewide, top 58%, 752 students, 83% FRL); Lynn Lucas Middle (math 23% / reading 32%, grade F, #1,156 of 1,662 statewide, top 71%, 971 students, 74% FRL); Willis H S (math 19% / reading 46%, grade F, #1,029 of 1,632 statewide, top 64%, 2,521 students, 57% FRL) — zoned schools average 71% FRL vs 56% district-wide (16 pts higher); higher-poverty schools than district average — tighter screening recommended.
- Market conditions: Rents flat; 721 active listings in the ZIP; 1 comparable units currently listed for rent nearby; 13,259 units permitted in Montgomery County in 2024 (1,402 in 5+ unit buildings).
- This rent runs 35% of the median local income ($71k/yr) — at the standard rent-burdened threshold; future hikes will face affordability resistance.
Forward outlook
- Local home prices are declining (-3.0%/yr); year-one equity from $2k of loan paydown is wiped out by about $8k of value loss. Plan a longer hold.
- Montgomery County population projected at +65% by 2050 — long-run rental-demand tailwind backs the buy-and-hold thesis.
Negotiation context
- It's been on market 40 days — a 3% lower offer ($242k) is reasonable based on typical stale-listing flexibility.
Risks & watch-outs
- Climate carrying-cost: major flood risk; severe wind risk, 99% chance of damaging wind over 30y; moderate wildfire risk; extreme-heat days projected 7→24/yr by 2055 (HVAC capex compounding) — expect insurance premiums to compound above CPI over the hold.
Questions for the listing agent
- It's been on market 40 days. Have you received any prior offers? Is the seller open to a 16% concession, seller financing, or rate buy-down credit?
- What does the HOA fee cover, when was the last increase, and are there any pending special assessments or reserve-fund shortfalls?
- Is there a deadline driving the sale (1031 exchange, divorce, estate, relocation)? That informs how much negotiation room exists.
- Schools are D-rated, which usually means shorter tenancies and higher turnover. Who's the typical renter profile here, and what's been the actual vacancy rate?
- The area grade is low — what's the realistic commute time and amenity access for the typical tenant pool here? Any planned neighborhood developments (good or bad) we should know about?
- What's the average days-on-market for RENTAL listings here right now (not sales)? A rising rental-DOM trend means longer vacancies and softer asking-rent achievability than the comps imply.
- What's the recent tenant-quality profile in this submarket — average credit score on applications, eviction rate, late-payment / NSF rate, and stable-employment percentage? A property-management company in the area should have these aggregated.
- How much new for-sale + rental construction is in the pipeline within 1–3 miles? Heavy new supply typically softens prices + rents 12–24 months out; constrained supply supports both.
Investment metrics
- 1% rule
- 0.84% ✗
- Cap rate
- 6.48%
- Cash-on-cash
- 0.69%
- DSCR
- 1.03
- GRM
- 9.9
CMA / ARV
- ARV (median comp)
- $251,500
- List price
- $249,999
- Delta
- -0.60%
- Verdict
- FAIR
- Comps
- 6 within 1.0 mi
Show comp detail 2 sales within ~0.75 mi
| Address | Dist | Beds/Ba | Sqft | Sold | Price | $/sf | Match |
|---|---|---|---|---|---|---|---|
| 4537 Grand Oaks Dr | 0.00mi | 4/2.0 | 1,800 (0%) | 1mo | $249,999 | $139 | 99 |
| 14604 Hasara Ln | 0.64mi | 4/2.0 | 1,792 (-0%) | 3mo | $253,000 | $141 | 67 |
Match score weights: distance 35% · size 25% · config 20% · recency 20%. Top-matched comps best support the ARV.
Projected returns pro-forma
-3.0% appreciation · 0.98% rent growth · sell at horizon
- IRR
- -17.4%
- Equity multiple
- 0.40×
- Total profit
- $-42,180
- Equity at exit
- $37,276
- IRR
- -13.4%
- Equity multiple
- 0.28×
- Total profit
- $-50,068
- Equity at exit
- $21,615
Cash invested: $70,000 (down + closing). Projections, not guarantees.
Landlord ↔ Tenant lean methodology
- Overall (STATE)
- 87 Strongly Landlord-Friendly
- State Texas
- 87 Strongly Landlord-Friendly · R+5
- County
- — inherits STATE
- City
- — inherits STATE
ZIP-level market 77378
- Home prices YoY
- -3.0%
- Rents YoY
- 1.0%
- Active inventory
- 721
- Price-to-rent
- 9.9×
Monthly cashflow live
- Estimated rent
- $2,098 medium interval (Pro) →
- Mortgage (P&I)
- −$1,311
- Tax from tax record
- −$181 /mo · $2,178/yr
- Insurance
- −$104
- HOA
- −$21
- Vacancy / Maint / Mgmt
- −$441
- Net cashflow
- $40
Break-even live
Sensitivity live
| Price | -10% $182 | -5% $111 | +0% $40 | +5% $-31 | +10% $-102 |
|---|---|---|---|---|---|
| Rent | -10% $-126 | -5% $-43 | +0% $40 | +5% $123 | +10% $206 |
| Rate | -1.0pp $166 | -0.5pp $104 | base $40 | +0.5pp $-25 | +1.0pp $-91 |
UW: 25.0% down · 7.5% · 30yr · 1.5% tax · 5.0% vac · 8.0% maint · 8.0% mgmt
Financing live
Cash to close
- Down payment
- $62,500
- Closing costs
- $7,500
- Reserves months
- —
- Total cash needed
- —
Loan-product check · same deal, 3 products live
Conventional
25% down · 7.5% · 30yr
- Down + closing
- —
- Monthly P&I
- —
- Monthly cashflow
- —
- DSCR
- —
- Eligible?
- —
Personal DTI + credit; lowest rate.
DSCR
20% down · 8.5% · 30yr
- Down + closing
- —
- Monthly P&I
- —
- Monthly cashflow
- —
- DSCR
- —
- Eligible?
- —
No personal income docs; deal must DSCR.
Hard money
10% down · 12.0% · 12mo
- Down + closing
- —
- Monthly P&I
- —
- Monthly cashflow
- —
- DSCR
- —
- Eligible?
- —
Short-term bridge; refi at stabilization.
Rent comps 1 comps
| Address | Beds | Baths | Sqft | Rent | $/sqft | DOM | Units | Dist |
|---|---|---|---|---|---|---|---|---|
| 14107 Running Bear Dr Willis, TX | 4.0 | 2.0 | 1328 | $1,800 | $1.36 | 26d | 1 | 0.62mi |
HOA detail
- Monthly dues
- $21 · $252/yr
- Likely covers
- water
Listing history 5 events
-
2026-05-18status Pending 828-char remark
Show marketing remark (828 chars)
Welcome to 4537 Grand Oaks Dr in Willis, TX — a fully updated 4-bedroom, 2-bath manufactured home on just over 1 acre of unrestricted land. This property has been extensively renovated, featuring a new roof, fresh interior and exterior paint, granite countertops, updated kitchen backsplash, and new appliances. The home offers waterproof flooring throughout (no carpet), along with new ceiling fans, modern lighting, and a clean, cohesive finish. Both bathrooms have been completely remodeled, and the home includes spacious front and rear porches, ideal for enjoying the privacy and quiet of country living. With no restrictions, there’s plenty of flexibility for additional structures, parking, or personal use. A rare opportunity to own a move-in ready manufactured home with this level of upgrades and land.
-
2026-04-16$249,999 Active 828-char remark
Show marketing remark (828 chars)
Welcome to 4537 Grand Oaks Dr in Willis, TX — a fully updated 4-bedroom, 2-bath manufactured home on just over 1 acre of unrestricted land. This property has been extensively renovated, featuring a new roof, fresh interior and exterior paint, granite countertops, updated kitchen backsplash, and new appliances. The home offers waterproof flooring throughout (no carpet), along with new ceiling fans, modern lighting, and a clean, cohesive finish. Both bathrooms have been completely remodeled, and the home includes spacious front and rear porches, ideal for enjoying the privacy and quiet of country living. With no restrictions, there’s plenty of flexibility for additional structures, parking, or personal use. A rare opportunity to own a move-in ready manufactured home with this level of upgrades and land.
-
2026-03-20soldstatus
-
2002-05-22soldstatus
-
2000-10-16soldstatus
ⓘ Source: listings_history table (triggers on properties + properties_extension) + one-shot
backfill from property_details.listing_events for pre-trigger history.
Tax reassessment forecast TX · Resets to sale price
- Current annual tax
- $2,178 · $181/mo
- Projected year-2 tax
- $4,575 · $381/mo
- Expected delta
- +$2,397/yr (+$200/mo · 110.1%)
ⓘ Screening estimate from a state-policy table — verify with the county assessor before closing.
Climate risk First Street
- Flood 6/10 Major FEMA zone X (unshaded) · 69% chance over 30 yrs
- Wildfire 5/10 Major
- Heat 8/10 Severe 7 d/yr ≥111°F today · 24 d/yr by 30 yrs out
- Wind 8/10 Severe 99% chance of damaging wind over 30 yrs
- Air quality 2/10 Low 1 unhealthy d/yr today · 1 by 30 yrs out
Nearby sold comps map
Loading sold comps map…
Walkable amenities ~0.75 mi
Loading nearby amenities…
Taxation est. · year 1
- Rental income
- $25,180
- − Mortgage interest
- −$14,004
- − Property taxes
- −$2,178
- − Insurance
- −$1,250
- − Repairs & maintenance
- −$2,014
- − Management
- −$2,014
- − HOA
- −$252
- − Depreciation
- −$7,273
- Taxable loss
- −$3,805
- Est. tax savings @ 24.0%
- +$913
- After-tax cash flow
- $1,393/yr
For passive investors: Depreciation is non-cash, so a rental often shows a tax loss while cash-flowing — sheltering income. Rental losses are passive: they offset passive income freely, and up to $25,000/yr can offset ordinary (W-2) income if you actively participate and your MAGI is under $100k (phasing out to $0 by $150k); unused losses carry forward. On sale, claimed depreciation is recaptured at up to 25%, and gains may owe capital-gains tax (a 1031 exchange can defer both). Figures are a year-1 estimate at your 24.0% rate — not tax advice; consult a CPA.
Schools (NCES district)
- District
- Willis ISD
- NCES district ID
- 4845900
- Math proficiency
- 33% ▼ -15.00%
- Reading proficiency
- 40% ▼ -2.00%
- Median HH income
- $57,828
- Composite
- 32.32/100
- National rank
- #5746
- State rank
- #458 of 826 in TX
Livability — Willis
- Score
- 62/100
- State rank
- #933
- US rank
- #16579
Category grades
Schools grade is shown separately in the Schools card above.
Census & demographics
- County
- Montgomery County · 663,713 people
- City population
- 38,421
- Metro
- Houston-The Woodlands-Sugar Land, TX
- Population (ZIP)
- 17,629
- Household income
- $71,143
- Rent vs Own
- Severe rent burden
- 402.0
Population outlook (Montgomery County) Hauer SSP2
- Today (2025)
- 713,896 people
- By 2030
- 805,263 · +12.8%
- By 2040
- 992,708 · +39.1%
- By 2050
- 1,179,590 · +65.2%
- By 2075
- 1,628,084 · +128.1%
- By 2100
- 1,937,880 · +171.5%
Race, ethnicity, and origin ACS 2023
- Neighborhood character
- Diverse neighborhood (Simpson 0.55)
- Race & ethnicity
- White 58% Hispanic / Latino 32% Two or more races 14% Black 7% Native American 1%
- Hispanic origin (detail)
- Mexican 27%
- Common ancestry
- Romanian 2% Slovak 2% Serbian 1%
- Foreign-born
- 12% · Canada
- Languages at home
- 80% English-only · Spanish 19%
Political lean MEDSL · Montgomery
- 2024 margin
- Solid R (+45.5) · D 26.8% · R 72.3%
- 2008→2024 swing
- +7.2pp toward D · 2008: -52.7pp · 2024: -45.5pp
- All cycles
- 2024: R+45.5 2020: R+43.8 2016: R+51.4 2012: R+60.7 2008: R+52.7
Not yet ingested
- Civics
- —
Market trends
- HPI YoY
- ▼ -8.25%
- Current HPI
- 261.9673
- Rent YoY
- ▲ 0.98%
- Metro
- Houston-The Woodlands-Sugar Land, TX
- State GDP YoY
- ▲ 3.95%
- F500 in state
- 110
Industry mix (Fortune 500 HQ in TX)
| Industry | F500 HQs | Revenue |
|---|---|---|
| Energy | 16 | $1,198B |
|
||
| Technology | 5 | $198B |
|
||
| Engineering / Construction | 4 | $72B |
|
||
| Energy Services | 3 | $60B |
|
||
| Utilities | 3 | $41B |
|
||
| Healthcare | 2 | $330B |
|
||
Price history
5 events — show timeline
- 2026-05-18 Pending — HARMLS
- 2026-04-16 Listed $249,999 HARMLS
- 2026-03-20 Sold (Public Records) — Public Records
- 2002-05-22 Sold (Public Records) — Public Records
- 2000-10-16 Sold (Public Records) — Public Records
Property tax history
+4.7%/yrLatest (2025): $2,178 · +9.6% YoY. Source: county tax records.
Cash-flow waterfall
monthlySold comps — $/sqft
last 12 mo · ≤1 miLoading sold comps…