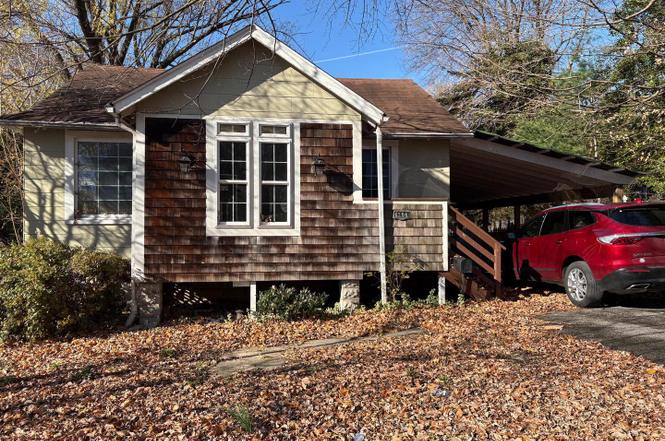
6204 Fair Oaks Ave · Baltimore, MD
Flood risk 1/10 · Minimal
- FEMA flood zone
- X (unshaded)
- Chance of flooding over 30 yrs
- 0.0%
- Est. flood insurance / yr
- $473 – $860
Fire risk 1/10 · Minimal
- Est. fire insurance / yr
- $755 – $1,403
Heat risk 7/10 · Major
- Hot days now (above 103°F)
- 7 days/yr
- Hot days in 30 yrs
- 15 days/yr
Wind risk 6/10 · Moderate
- Chance of severe wind over 30 yrs
- 27.0%
Air-quality risk 4/10 · Minor
- Unhealthy air days now
- 3 days/yr
- Unhealthy air days in 30 yrs
- 6 days/yr
Risk factors via First Street. Map © Google.
Why this score? — see what drove the C- grade
The composite is a weighted blend of 9 inputs, each scored 0–100. Each bar is that input's sub-score; the figure is the points it added to the 100-point composite (weight × sub-score).
- Cash flow +17.0/30.0
- ARV discount +15.0/15.0
- DSCR +5.3/10.0
- 1% rule +5.1/10.0
- Livability +3.8/5.0
- Rent growth +2.5/5.0
- Condition / age +2.5/5.0
- Schools +1.0/10.0
- Appreciation +0.0/10.0
$149,999
🖨 Deal sheet (PDF) 📄 Offer letter ✓ Due diligence
Listing remarks
🔥 INVESTOR ALERT – OPPORTUNITY KNOCKS! 🔥 Don’t miss this fantastic chance to own a solid 2-bedroom, 1-bath home with great bones and tons of potential! Perfect for renovation, rental income, or resale, this property offers multiple value-add opportunities. Step inside to find a spacious layout featuring a huge vaulted-ceiling family room at the back of the home—an incredible space ready to be transformed. A gigantic covered porch extends the living area outdoors, ideal for entertaining or future expansion. The home sits on a nice, usable yard, offering room for landscaping, play space, or future additions. A two-car carport provides excellent covered parking, storage, or w
Key facts
- 6,246 sq ft lot
- 2 parking spots
- Built 1924
Neighborhood map
What this means for you Summary
Snapshot
- This is a 2-bed/1.0-bath single-family listed at $150k.
Deal economics
- At list price, monthly cash flow is $101 ($1k/yr) — positive.
- The deal already cash-flows at list — no discount required.
- Meets the 1% rule at list price ($2k rent vs $150k).
- Recommended offer: $136k (9.0% below list) — sets the bar for market timing.
Location & tenants
- Location reads 76/100 on livability (#90 in MD, #3,396 nationally) — a middle-class / working-renter tenant base. Strengths: amenities A+, commute A+, housing A+; Watch: crime F.
- Baltimore City Public Schools (urban): math 7% / reading 16% proficiency, ranked #24 of 24 in MD (top 100%) — low school quality limits family demand, transient renter base, plan for 1-2y turnover; 79% free/reduced lunch — lower-income household profile, screen leases tightly.
- Zoned schools: Hamilton Elementary/Middle (math 11% / reading 25%, grade F, #400 of 860 statewide, top 47%, 815 students, 59% FRL); Baltimore Polytechnic Institute (math 71% / reading 84%, grade A-, #22 of 222 statewide, top 10%, 1,555 students, 43% FRL) — zoned schools average 51% FRL vs 79% district-wide (28 pts lower); this property's tenant base skews higher-income than the district average.
- Zoned-school proficiency averages 48% at this address vs 12% district-wide (+36 pts) — the actual schools serving this property are materially stronger than the Baltimore City Public Schools average implies; a family-tenant draw the district grade alone would hide.
- Market conditions: 99 active listings in the ZIP; 40 comparable units currently listed for rent nearby; rentals at typical pace (median 26d on market — plan ~3-4 weeks tenant-placement turnaround); 45% of comp listings sitting > 30 days — soft ceiling on asking rent; solid renter incomes; 1,273 units permitted in Baltimore city in 2024 (1,104 in 5+ unit buildings).
Forward outlook
- Local home prices are declining (-3.0%/yr); year-one equity from $1k of loan paydown is wiped out by about $4k of value loss. Plan a longer hold.
- Baltimore County population projected to shrink 4% by 2050 — rents likely to lag national; underwrite the cash flow, not the appreciation.
Negotiation context
- It's been on market 94 days — a 9% lower offer ($136k) is reasonable based on typical stale-listing flexibility.
- 9 sale attempts since 31y ago; this cycle's ask has dropped $20k (12%) from the opening price — seller is motivated, your offer sets the floor, not the list.
- Current owner paid $50k; list at $150k implies a 200% gain — meaningful room to come down on a strong offer.
Risks & watch-outs
- Watch-outs: built in 1924 — expect roof / HVAC / electrical / plumbing capex.
- Climate carrying-cost: major wind risk, 27% chance of damaging wind over 30y; extreme-heat days projected 7→15/yr by 2055 (HVAC capex compounding) — expect insurance premiums to compound above CPI over the hold.
Questions for the listing agent
- It's been on market 94 days. Have you received any prior offers? Is the seller open to a 9% concession, seller financing, or rate buy-down credit?
- Built in 1924 — when were the roof, HVAC, electrical panel, plumbing, and water heater last replaced?
- Why hasn't it sold? Are there any deal-killer items the seller is aware of (foundation, flood, title, zoning, code violations)?
- Is there a deadline driving the sale (1031 exchange, divorce, estate, relocation)? That informs how much negotiation room exists.
- Schools are D-rated, which usually means shorter tenancies and higher turnover. Who's the typical renter profile here, and what's been the actual vacancy rate?
- Crime grade is F in this area — have there been break-ins, vandalism, or insurance claims at this property in the last 3 years? What carrier currently insures it and at what premium?
- What's the average days-on-market for RENTAL listings here right now (not sales)? A rising rental-DOM trend means longer vacancies and softer asking-rent achievability than the comps imply.
- What's the recent tenant-quality profile in this submarket — average credit score on applications, eviction rate, late-payment / NSF rate, and stable-employment percentage? A property-management company in the area should have these aggregated.
- How much new for-sale + rental construction is in the pipeline within 1–3 miles? Heavy new supply typically softens prices + rents 12–24 months out; constrained supply supports both.
Investment metrics
- 1% rule
- 1.01% ✓
- Cap rate
- 7.10%
- Cash-on-cash
- 2.88%
- DSCR
- 1.13
- GRM
- 8.3
CMA / ARV
- ARV (on-the-fly)
- $251,748
- Comps found
- 12
Show comp detail 12 sales within ~0.75 mi
| Address | Dist | Beds/Ba | Sqft | Sold | Price | $/sf | Match |
|---|---|---|---|---|---|---|---|
| 5613 Plymouth Rd | 0.33mi | 3/2.0 (+1) | 1,031 (+6%) | 2mo | $270,000 | $262 | 64 |
| 3022 Roselawn Ave | 0.60mi | 3/1.0 (+1) | 988 (+2%) | 0mo | $235,000 | $238 | 64 |
| 5313 Plymouth Rd | 0.53mi | 2/1.5 | 956 (-2%) | 12mo | $164,215 | $172 | 60 |
| 2605 Evergreen Ave | 0.32mi | 3/1.5 (+1) | 1,056 (+9%) | 12mo | $257,050 | $243 | 54 |
| 5016 Morello Rd | 0.73mi | 2/1.0 | 944 (-3%) | 13mo | $140,000 | $148 | 50 |
| 2805 Christopher Ave | 0.25mi | 3/2.0 (+1) | 1,040 (+7%) | 22mo | $280,000 | $269 | 50 |
| 6819 Hamlet | 0.61mi | 3/1.0 (+1) | 964 (-1%) | 22mo | $281,000 | $291 | 47 |
| 5204 Catalpha Rd | 0.65mi | 2/1.5 | 1,096 (+13%) | 2mo | $250,000 | $228 | 45 |
| 5627 Mcclean Blvd | 0.20mi | 3/2.0 (+1) | 1,102 (+13%) | 19mo | $300,000 | $272 | 43 |
| 2909 Berwick Ave | 0.68mi | 3/1.5 (+1) | 1,090 (+12%) | 7mo | $282,000 | $259 | 35 |
| 2909 Fleetwood Ave | 0.59mi | 3/1.0 (+1) | 1,072 (+10%) | 24mo | $235,000 | $219 | 31 |
| 2816 Berwick Ave | 0.67mi | 3/3.0 (+1) | 1,044 (+7%) | 17mo | $345,000 | $330 | 29 |
Match score weights: distance 35% · size 25% · config 20% · recency 20%. Top-matched comps best support the ARV.
Projected returns pro-forma
-3.0% appreciation · 3.0% rent growth · sell at horizon
- IRR
- -11.7%
- Equity multiple
- 0.58×
- Total profit
- $-17,826
- Equity at exit
- $22,365
- IRR
- -2.5%
- Equity multiple
- 0.83×
- Total profit
- $-7,020
- Equity at exit
- $12,969
Cash invested: $42,000 (down + closing). Projections, not guarantees.
Landlord ↔ Tenant lean methodology
- Overall (CITY)
- 12 Strongly Tenant-Friendly
- State Maryland
- 27 Tenant-Leaning · D+14
- County
- — inherits STATE
- City Baltimore
- 12 Strongly Tenant-Friendly · D+58
ZIP-level market 21214
- Active inventory
- 99
- Price-to-rent
- 8.3×
Monthly cashflow live
- Estimated rent
- $1,511 high interval (Pro) →
- Mortgage (P&I)
- −$787
- Tax from tax record
- −$243 /mo · $2,922/yr
- Insurance
- −$62
- HOA
- −$0
- Lot rent
- −$0
- Vacancy / Maint / Mgmt
- −$317
- Net cashflow
- $101
Break-even live
Sensitivity live
| Price | -10% $186 | -5% $143 | +0% $101 | +5% $58 | +10% $16 |
|---|---|---|---|---|---|
| Rent | -10% $-19 | -5% $41 | +0% $101 | +5% $161 | +10% $220 |
| Rate | -1.0pp $176 | -0.5pp $139 | base $101 | +0.5pp $62 | +1.0pp $22 |
UW: 25.0% down · 7.5% · 30yr · 1.5% tax · 5.0% vac · 8.0% maint · 8.0% mgmt
Financing live
Cash to close
- Down payment
- $37,500
- Closing costs
- $4,500
- Reserves months
- —
- Total cash needed
- —
Loan-product check · same deal, 3 products live
Conventional
25% down · 7.5% · 30yr
- Down + closing
- —
- Monthly P&I
- —
- Monthly cashflow
- —
- DSCR
- —
- Eligible?
- —
Personal DTI + credit; lowest rate.
DSCR
20% down · 8.5% · 30yr
- Down + closing
- —
- Monthly P&I
- —
- Monthly cashflow
- —
- DSCR
- —
- Eligible?
- —
No personal income docs; deal must DSCR.
Hard money
10% down · 12.0% · 12mo
- Down + closing
- —
- Monthly P&I
- —
- Monthly cashflow
- —
- DSCR
- —
- Eligible?
- —
Short-term bridge; refi at stabilization.
Rent comps 40 comps
| Address | Beds | Baths | Sqft | Rent | $/sqft | DOM | Units | Dist |
|---|---|---|---|---|---|---|---|---|
| 6212 Laurelton Ave Baltimore, MD | 2.0 | 1.0 | 960 | $1,325 | $1.38 | 46d | 1 | 0.07mi |
| 6211 Birchwood Ave Unit 1st FL Baltimore, MD | 1.0 | 1.0 | 600 | $1,300 | $2.17 | 26d | 1 | 0.09mi |
| 5600 Birchwood Ave Unit 2 Baltimore, MD | 2.0 | 1.0 | 850 | $1,600 | $1.88 | 46d | 1 | 0.26mi |
| 2106 Cloville Ave Baltimore, MD | 3.0 | 1.5 | 1080 | $1,700 | $1.57 | 46d | 1 | 0.34mi |
| 6612 Birchwood Ave Baltimore, MD | 3.0 | 2.0 | 1122 | $2,300 | $2.05 | 22d | 1 | 0.35mi |
| 6502 McClean Blvd Baltimore, MD | 2.0 | 1.0 | 925 | $1,537 | $1.66 | 46d | 1 | 0.37mi |
| 2604 Hamilton Ave Apt 2 Baltimore, MD | 2.0 | 1.0 | 850 | $1,195 | $1.41 | 46d | 1 | 0.38mi |
| 2423 Wellbridge Dr Baltimore, MD | 1.0–2.0 | 1.0 | 675 | $1,325 | $1.96 | 22d | 1 | 0.45mi |
| 6502 McClean Blvd Unit 2207-A3 Baltimore, MD | 1.0 | 1.0 | 800 | $1,212 | $1.51 | 46d | 1 | 0.45mi |
| 6502 McClean Blvd Unit 2211-B3 Baltimore, MD | 2.0 | 1.0 | 925 | $1,495 | $1.62 | 24d | 1 | 0.45mi |
| 3010 White Ave Unit B Baltimore, MD | 1.0 | 1.0 | 630 | $1,150 | $1.83 | 26d | 1 | 0.60mi |
| 6624 Pioneer Dr Baltimore, MD | 1.0–3.0 | 1.0 | 706 | $1,266 | $1.79 | 46d | 1 | 0.62mi |
| 1806 Ramblewood Rd Apt A Baltimore, MD | 2.0 | 2.0 | 903 | $1,847 | $2.05 | 46d | 1 | 0.64mi |
| 3014 Hamilton Ave Unit 1 Baltimore, MD | 2.0 | 1.0 | 850 | $1,575 | $1.85 | 26d | 1 | 0.71mi |
| 3033 Hamilton Ave Unit 1R Baltimore, MD | 2.0 | 1.0 | 720 | $1,195 | $1.66 | 6d | 1 | 0.73mi |
| 1900 Ramblewood Rd Apt A Baltimore, MD | 2.0 | 2.0 | 903 | $1,847 | $2.05 | 46d | 1 | 0.78mi |
| 2077 Woodbourne Ave Baltimore, MD | 1.0–2.0 | 1.0 | 830 | $1,419 | $1.71 | 4d | 5 | 0.82mi |
| 3021 Echodale Ave Unit 2 Baltimore, MD | 2.0 | 1.0 | 750 | $999 | $1.33 | 46d | 1 | 0.84mi |
| 3010 Woodring Ave Unit 2 Baltimore, MD | 2.0 | 1.0 | 900 | $1,600 | $1.78 | 46d | 1 | 0.85mi |
| 6915 Harford Rd Unit 1 Baltimore, MD | 1.0 | 1.0 | 658 | $1,250 | $1.90 | 5d | 1 | 0.91mi |
| 6915 Harford Rd Unit 3 Baltimore, MD | 1.0 | 1.0 | 600 | $1,250 | $2.08 | 46d | 1 | 0.91mi |
| 6915 Harford Rd Unit 3 Baltimore, MD | 1.0 | 1.0 | 658 | $1,150 | $1.75 | 5d | 1 | 0.91mi |
| 4902 Gilray Dr Baltimore, MD | 3.0 | 2.0 | 776 | $2,400 | $3.09 | 26d | 1 | 0.91mi |
| 5515 Hillen Rd Unit B Baltimore, MD | 1.0 | 1.0 | 600 | $1,200 | $2.00 | 46d | 1 | 0.95mi |
| 1712 Waverly Way Baltimore, MD | 1.0–2.0 | 1.0 | 675 | $1,520 | $2.25 | 0d | 4 | 0.95mi |
| 1610 Wentworth Ave Parkville, MD | 3.0 | 1.0 | 1024 | $1,900 | $1.86 | 46d | 1 | 1.05mi |
| 6101 Loch Raven Blvd Baltimore, MD | 1.0–2.0 | 1.0–2.0 | 1138 | $2,378 | $2.09 | 0d | 8 | 1.09mi |
| 3607 Bayonne Ave Unit 1 Baltimore, MD | 1.0 | 1.0 | 750 | $1,100 | $1.47 | 26d | 1 | 1.11mi |
| 3607 Bayonne Ave Unit 2 Baltimore, MD | 2.0 | 1.0 | 900 | $1,300 | $1.44 | 26d | 1 | 1.11mi |
| 2825 Clearview Ave Unit 2 Parkville, MD | 1.0 | 1.0 | 650 | $1,200 | $1.85 | 6d | 1 | 1.12mi |
| 34 Dowling Cir Parkville, MD | 1.0–2.0 | 1.0 | 851 | $1,440 | $1.69 | 1d | 32 | 1.28mi |
| 1408 Cedarcroft Rd Baltimore, MD | 3.0 | 2.0 | 912 | $1,957 | $2.15 | 46d | 1 | 1.29mi |
| 6410 Walther Ave Baltimore, MD | 2.0 | 1.0–2.0 | 1195 | $1,995 | $1.67 | 46d | 7 | 1.29mi |
| 6535 Falkirk Rd Baltimore, MD | 2.0 | 1.0 | 630 | $1,469 | $2.33 | 20d | 1 | 1.31mi |
| 6535 Falkirk Rd Baltimore, MD | 2.0 | 1.0 | 630 | $1,539 | $2.44 | 46d | 1 | 1.31mi |
| 6535 Falkirk Rd Baltimore, MD | 2.0 | 1.0 | 630 | $1,559 | $2.47 | 1d | 1 | 1.31mi |
| 6535 Falkirk Rd Baltimore, MD | 1.0 | 1.0 | 550 | $1,369 | $2.49 | 5d | 1 | 1.31mi |
| 6535 Falkirk Rd Baltimore, MD | 2.0 | 1.0 | 630 | $1,509 | $2.40 | 26d | 1 | 1.31mi |
| 2525 Wendover Rd Unit B Parkville, MD | 2.0 | 1.0 | 730 | $1,650 | $2.26 | 46d | 1 | 1.31mi |
| 1414 Regester Ave Unit 1545740P Baltimore, MD | 1.0 | 1.0 | 548 | $4,516 | $8.24 | 18d | 1 | 1.32mi |
Listing history 27 events
-
2026-03-25status Pending
-
2026-03-10status Active
-
2026-02-26historical Active Under Contract
-
2026-02-19price $149,999
-
2025-12-09$169,999 Active
-
2010-11-29historical
-
2010-11-29historical Expired
-
2010-06-27price
-
2010-05-28Active
-
2010-05-28$199,900
-
2009-05-31historical
-
2009-03-02price
-
2009-02-20price
-
2008-11-15
-
2008-07-01historical
-
2008-02-15price
-
2007-12-18
-
1998-02-24soldstatus $50,000
-
1998-02-24soldstatus $50,000
-
1998-02-05historical
-
1998-01-28soldstatus $50,460
-
1998-01-09historical
-
1997-11-01$59,900
-
1997-10-22historical
-
1996-12-03
-
1995-01-26
-
1991-04-19soldstatus $65,000
ⓘ Source: listings_history table (triggers on properties + properties_extension) + one-shot
backfill from property_details.listing_events for pre-trigger history.
Tax reassessment forecast MD · Partial reset (capped growth)
- Current annual tax
- $2,922 · $243/mo
- Projected year-2 tax
- $2,922 · $243/mo
- Expected delta
- $0/yr ($0/mo · 0.0%)
ⓘ Screening estimate from a state-policy table — verify with the county assessor before closing.
Climate risk First Street
- Flood 1/10 Low FEMA zone X (unshaded) · 0% chance over 30 yrs
- Wildfire 1/10 Low
- Heat 7/10 Severe 7 d/yr ≥103°F today · 15 d/yr by 30 yrs out
- Wind 6/10 Major 27% chance of damaging wind over 30 yrs
- Air quality 4/10 Moderate 3 unhealthy d/yr today · 6 by 30 yrs out
Nearby sold comps map
Loading sold comps map…
Walkable amenities ~0.75 mi
Loading nearby amenities…
Taxation est. · year 1
- Rental income
- $18,128
- − Mortgage interest
- −$8,402
- − Property taxes
- −$2,922
- − Insurance
- −$750
- − Repairs & maintenance
- −$1,450
- − Management
- −$1,450
- − Depreciation
- −$4,364
- Taxable loss
- −$1,210
- Est. tax savings @ 24.0%
- +$290
- After-tax cash flow
- $1,501/yr
For passive investors: Depreciation is non-cash, so a rental often shows a tax loss while cash-flowing — sheltering income. Rental losses are passive: they offset passive income freely, and up to $25,000/yr can offset ordinary (W-2) income if you actively participate and your MAGI is under $100k (phasing out to $0 by $150k); unused losses carry forward. On sale, claimed depreciation is recaptured at up to 25%, and gains may owe capital-gains tax (a 1031 exchange can defer both). Figures are a year-1 estimate at your 24.0% rate — not tax advice; consult a CPA.
Schools (NCES district)
- District
- Baltimore City Public Schools
- NCES district ID
- 2400090
- Math proficiency
- 7% ▼ -9.00%
- Reading proficiency
- 16% ▼ -5.00%
- Median HH income
- $42,108
- Composite
- 10.08/100
- National rank
- #9805
- State rank
- #24 of 24 in MD
Livability — Baltimore
- Score
- 76/100
- State rank
- #90
- US rank
- #3396
Category grades
Schools grade is shown separately in the Schools card above.
Census & demographics
- Census place
- Baltimore, MD
- County
- Baltimore City · 558,601 people
- City population
- 588,727
- Metro
- Baltimore-Columbia-Towson, MD
- Population (ZIP)
- 21,092
- Household income
- $86,366
- Rent vs Own
- Severe rent burden
- 432.0
Population outlook (Baltimore County) Hauer SSP2
- Today (2025)
- 624,249 people
- By 2030
- 621,541 · -0.4%
- By 2040
- 609,756 · -2.3%
- By 2050
- 597,249 · -4.3%
- By 2075
- 552,236 · -11.5%
- By 2100
- 513,934 · -17.7%
Race, ethnicity, and origin ACS 2023
- Neighborhood character
- Diverse neighborhood (Simpson 0.56)
- Race & ethnicity
- Black 58% White 33% Two or more races 6% Hispanic / Latino 3%
- Common ancestry
- Romanian 3% Italian 1% Lithuanian 1%
- Foreign-born
- 7% · Canada
- Languages at home
- 93% English-only · Spanish 3% French/Haitian/Cajun 1%
Political lean MEDSL · Baltimore
- 2024 margin
- Solid D (+73.0) · D 85.2% · R 12.2% · Other 2.6%
- 2008→2024 swing
- -2.5pp toward R · 2008: 75.5pp · 2024: 73.0pp
- All cycles
- 2024: D+73.0 2020: D+76.6 2016: D+74.6 2012: D+76.4 2008: D+75.5
Not yet ingested
- Civics
- —
Market trends
- HPI YoY
- ▼ -211.52%
- Current HPI
- 310.5637
- Rent YoY
- —
- Metro
- Baltimore-Columbia-Towson, MD
- State GDP YoY
- ▲ 2.97%
- F500 in state
- 12
Industry mix (Fortune 500 HQ in MD)
| Industry | F500 HQs | Revenue |
|---|---|---|
| Aerospace / Defense | 1 | $71B |
|
||
| Utilities | 1 | $25B |
|
||
| Hotels | 1 | $24B |
|
||
| Consumer Goods | 1 | $7B |
|
||
| Real Estate | 1 | $6B |
|
||
| Chemicals | 1 | $2B |
|
||
Price history
+130.8% since first listed27 events — show timeline
- 2026-03-25 Pending — BRIGHT MLS
- 2026-03-10 Relisted — BRIGHT MLS
- 2026-02-26 Contingent — BRIGHT MLS
- 2026-02-19 Price Changed $149,999 BRIGHT MLS
- 2025-12-09 Listed $169,999 BRIGHT MLS
- 2010-11-29 Listing Removed — BRIGHT MLS
- 2010-11-29 Delisted — MRIS
- 2010-06-27 Price Changed — MRIS
- 2010-05-28 Listed — MRIS
- 2010-05-28 Listed $199,900 BRIGHT MLS
- 2009-05-31 Delisted — MRIS
- 2009-03-02 Price Changed — MRIS
- 2009-02-20 Price Changed — MRIS
- 2008-11-15 Listed — MRIS
- 2008-07-01 Delisted — MRIS
- 2008-02-15 Price Changed — MRIS
- 2007-12-18 Listed — MRIS
- 1998-02-24 Sold (Public Records) $50,000 Public Records
- 1998-02-24 Sold (Public Records) $50,000 Public Records
- 1998-02-05 Delisted — MRIS
- 1998-01-28 Sold (MLS) $50,460 MRIS
- 1998-01-09 Delisted — MRIS
- 1997-11-01 Listed $59,900 MRIS
- 1997-10-22 Delisted — MRIS
- 1996-12-03 Listed — MRIS
- 1995-01-26 Listed — MRIS
- 1991-04-19 Sold (Public Records) $65,000 Public Records
Property tax history
+0.6%/yrLatest (2025): $2,922 · +3.8% YoY. Source: county tax records.
Cash-flow waterfall
monthlySold comps — $/sqft
last 12 mo · ≤1 miLoading sold comps…