 🏷️ Likely Rental
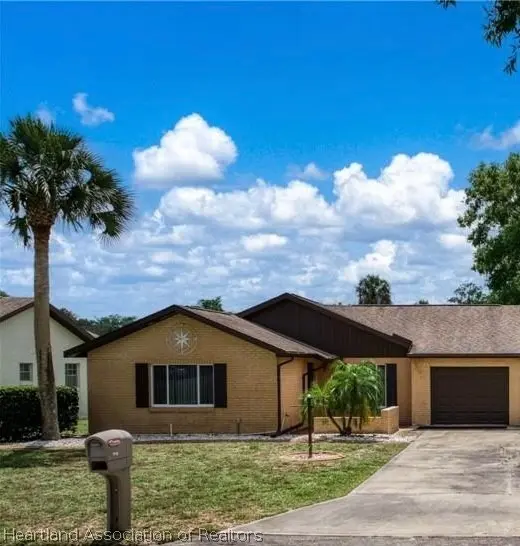
160 Parkview Cir · Lake Placid, FL
Flood risk 1/10 · Minimal
- FEMA flood zone
- X (unshaded)
- Chance of flooding over 30 yrs
- 0.0%
- Est. flood insurance / yr
- $507 – $1,088
Fire risk 5/10 · Moderate
- Est. fire insurance / yr
- $947 – $1,759
Heat risk 8/10 · Major
- Hot days now (above 108°F)
- 7 days/yr
- Hot days in 30 yrs
- 26 days/yr
Wind risk 10/10 · Severe
- Chance of severe wind over 30 yrs
- 99.0%
Air-quality risk 2/10 · Minimal
- Unhealthy air days now
- 1 days/yr
- Unhealthy air days in 30 yrs
- 1 days/yr
Risk factors via First Street. Map © Google.
Why this score? — see what drove the D+ grade
The composite is a weighted blend of 9 inputs, each scored 0–100. Each bar is that input's sub-score; the figure is the points it added to the 100-point composite (weight × sub-score).
- ARV discount +15.0/15.0
- Cash flow +13.3/30.0
- 1% rule +4.8/10.0
- DSCR +4.0/10.0
- Schools +3.6/10.0
- Livability +3.4/5.0
- Rent growth +2.7/5.0
- Condition / age +2.5/5.0
- Appreciation +0.0/10.0
$154,500
🖨 Deal sheet (PDF) 📄 Offer letter ✓ Due diligence
Listing remarks
Imagine waking up each day to a world designed for your enjoyment—that’s the promise of Covered Bridge, a premier 55+ community nestled in the heart of Lake Placid, FL. Come see for yourself and walk away with a great deal in a great place. Recently Reduced – Seller Motivated! Located in a quiet area at the back of one of Florida’s best 55+ communities, this charming 2-bedroom, 2-bath villa is perfect as a winter getaway or your forever home. The very reasonable $112/month HOA includes a wide range of amenities: basic cable TV, lawn mowing, pool, hot tub, game room, exercise room, library, clubhouse, boat/RV storage, pickleball, cornhole, shuffleboard, and a private
Key facts
- Recent upgrades
- Private boat launch
- Deep water canal
Tags
Property features AI
Finance
- Other: Pets allowed; Zoning: M1FUD; Frontage approximately 50 units
- Financial info: Financial details beyond HOA fees not provided
- HOA & community: Homeowners association with a $112 monthly fee; Located in a senior community
Exterior
- Parking: Detached garage with 1 parking space
- Security: Security details not provided
- Utilities: Public water; Public sewer
- Home design: Single-family residence (villa); One level
- Construction: Block and concrete construction; Shingle roof; Built year not provided
- Exterior features: Front porch; Paved road access
Interior
- Kitchen: Kitchen details not provided
- Bedrooms: Information on bedrooms not provided
- Flooring: Laminate; Simulated wood; Tile
- Bathrooms: 2 full bathrooms
- Heating & cooling: Central heating (electric); Central air conditioning (electric)
- Interior features: Laminate, simulated wood and tile flooring
- Laundry & utility: Laundry details not provided
Neighborhood map
What this means for you Summary
Snapshot
- This is a 2-bed/2.0-bath single-family listed at $154k.
Deal economics
- At list price, monthly cash flow is $-1 ($-11/yr) — negative.
- To cash-flow at today's rent, offer at most $154k (0.1% below list).
- To meet the 1% rule (rent ≥ 1% of price), the offer needs to be $151k (2.1% below list).
- Recommended offer: $150k (3.0% below list) — sets the bar for market timing.
- Cap rate 6.3% vs local median 3.8% in Lake Placid — top-decile yield for the area; either an underpriced asset or a hidden risk that comps aren't pricing in. Stress-test before assuming the spread holds.
Location & tenants
- Location reads 68/100 on livability (#525 in FL) — a middle-class / working-renter tenant base. Strengths: crime A+, cost of living A+, health & safety A+; Watch: amenities F, commute F, employment F.
- Highlands (other): math 45% / reading 43% proficiency, ranked #54 of 73 in FL (top 74%) — families likely to look elsewhere, expect single-tenant / working-renter base with shorter leases; 68% free/reduced lunch — lower-income household profile, screen leases tightly.
- Zoned schools: Lake Placid Elementary School (math 32% / reading 29%, grade F, #1,862 of 2,144 statewide, top 88%, 594 students, 80% FRL); Lake Placid Middle School (math 42% / reading 33%, grade F, #395 of 571 statewide, top 70%, 621 students, 75% FRL); Lake Placid High School (math 36% / reading 35%, grade F, #367 of 667 statewide, top 57%, 868 students, 66% FRL).
- Market conditions: Rents flat; 1495 active listings in the ZIP; 980 units permitted in Highlands County in 2024 (80 in 5+ unit buildings).
- This rent runs 33% of the median local income ($54k/yr) — at the standard rent-burdened threshold; future hikes will face affordability resistance.
Forward outlook
- Local home prices are declining (-3.0%/yr); year-one equity from $1k of loan paydown is wiped out by about $5k of value loss. Plan a longer hold.
Negotiation context
- It's been on market 31 days — a 3% lower offer ($150k) is reasonable based on typical stale-listing flexibility.
- Current owner paid $62k; list at $154k implies a 149% gain — meaningful room to come down on a strong offer.
Risks & watch-outs
- Climate carrying-cost: severe wind risk, 99% chance of damaging wind over 30y; moderate wildfire risk; extreme-heat days projected 7→26/yr by 2055 (HVAC capex compounding) — expect insurance premiums to compound above CPI over the hold.
Questions for the listing agent
- What do current leases actually rent for vs. the listed asking? Can we see a recent rent roll and the last 12 months of T-12 income?
- It's been on market 31 days. Have you received any prior offers? Is the seller open to a 3% concession, seller financing, or rate buy-down credit?
- What does the HOA fee cover, when was the last increase, and are there any pending special assessments or reserve-fund shortfalls?
- Is there a deadline driving the sale (1031 exchange, divorce, estate, relocation)? That informs how much negotiation room exists.
- Schools are D-rated, which usually means shorter tenancies and higher turnover. Who's the typical renter profile here, and what's been the actual vacancy rate?
- The area grade is low — what's the realistic commute time and amenity access for the typical tenant pool here? Any planned neighborhood developments (good or bad) we should know about?
- What's the average days-on-market for RENTAL listings here right now (not sales)? A rising rental-DOM trend means longer vacancies and softer asking-rent achievability than the comps imply.
- What's the recent tenant-quality profile in this submarket — average credit score on applications, eviction rate, late-payment / NSF rate, and stable-employment percentage? A property-management company in the area should have these aggregated.
- How much new for-sale + rental construction is in the pipeline within 1–3 miles? Heavy new supply typically softens prices + rents 12–24 months out; constrained supply supports both.
Investment metrics
- 1% rule
- 0.98% ✗
- Cap rate
- 6.29%
- Cash-on-cash
- -0.03%
- DSCR
- 1.00
- GRM
- 8.5
CMA / ARV
- ARV (on-the-fly)
- $227,040
- Comps found
- 12
Show comp detail 12 sales within ~0.75 mi
| Address | Dist | Beds/Ba | Sqft | Sold | Price | $/sf | Match |
|---|---|---|---|---|---|---|---|
| 158 Parkview Cir | 0.01mi | 2/2.0 | 1,290 (0%) | 6mo | $150,000 | $116 | 95 |
| 170 Parkview Cir | 0.05mi | 2/2.0 | 1,246 (-3%) | 4mo | $140,000 | $112 | 89 |
| 10443 High Grove Ave | 0.13mi | 2/2.0 | 1,268 (-2%) | 3mo | $237,000 | $187 | 88 |
| 8 Jasmine St | 0.14mi | 2/2.0 | 1,274 (-1%) | 5mo | $163,000 | $128 | 88 |
| 10433 High Grove Ave | 0.13mi | 2/2.0 | 1,381 (+7%) | 0mo | $255,000 | $185 | 82 |
| 120 Parkview Cir | 0.12mi | 2/2.0 | 1,210 (-6%) | 6mo | $160,000 | $132 | 79 |
| 10481 High Grove Ave | 0.14mi | 2/2.0 | 1,233 (-4%) | 11mo | $275,000 | $223 | 77 |
| 110 Edgewater Dr S | 0.18mi | 2/2.0 | 1,176 (-9%) | 3mo | $150,000 | $128 | 74 |
| 152 Woodside Dr | 0.23mi | 2/2.0 | 1,378 (+7%) | 4mo | $242,500 | $176 | 74 |
| 105 Hillcrest St | 0.11mi | 2/1.5 | 1,100 (-15%) | 2mo | $189,900 | $173 | 67 |
| 178 Woodside Dr | 0.26mi | 2/2.0 | 1,130 (-12%) | 6mo | $235,000 | $208 | 62 |
| 3014 Peachtree Dr | 0.39mi | 3/2.0 (+1) | 1,158 (-10%) | 1mo | $390,000 | $337 | 58 |
Match score weights: distance 35% · size 25% · config 20% · recency 20%. Top-matched comps best support the ARV.
Projected returns pro-forma
-3.0% appreciation · 0.82% rent growth · sell at horizon
- IRR
- -19.1%
- Equity multiple
- 0.35×
- Total profit
- $-28,239
- Equity at exit
- $23,036
- IRR
- -17.5%
- Equity multiple
- 0.14×
- Total profit
- $-37,009
- Equity at exit
- $13,358
Cash invested: $43,260 (down + closing). Projections, not guarantees.
Landlord ↔ Tenant lean methodology
- Overall (STATE)
- 87 Strongly Landlord-Friendly
- State Florida
- 87 Strongly Landlord-Friendly · R+3
- County
- — inherits STATE
- City
- — inherits STATE
ZIP-level market 33852
- Rents YoY
- 0.8%
- Active inventory
- 1495
- Price-to-rent
- 8.5×
Monthly cashflow live
- Estimated rent
- $1,513 medium interval (Pro) →
- Mortgage (P&I)
- −$810
- Tax from tax record
- −$210 /mo · $2,514/yr
- Insurance
- −$64
- HOA
- −$112
- Vacancy / Maint / Mgmt
- −$318
- Net cashflow
- $-1
Break-even live
Sensitivity live
| Price | -10% $87 | -5% $43 | +0% $-1 | +5% $-45 | +10% $-88 |
|---|---|---|---|---|---|
| Rent | -10% $-120 | -5% $-61 | +0% $-1 | +5% $59 | +10% $119 |
| Rate | -1.0pp $77 | -0.5pp $38 | base $-1 | +0.5pp $-41 | +1.0pp $-82 |
UW: 25.0% down · 7.5% · 30yr · 1.5% tax · 5.0% vac · 8.0% maint · 8.0% mgmt
Financing live
Cash to close
- Down payment
- $38,625
- Closing costs
- $4,635
- Reserves months
- —
- Total cash needed
- —
Loan-product check · same deal, 3 products live
Conventional
25% down · 7.5% · 30yr
- Down + closing
- —
- Monthly P&I
- —
- Monthly cashflow
- —
- DSCR
- —
- Eligible?
- —
Personal DTI + credit; lowest rate.
DSCR
20% down · 8.5% · 30yr
- Down + closing
- —
- Monthly P&I
- —
- Monthly cashflow
- —
- DSCR
- —
- Eligible?
- —
No personal income docs; deal must DSCR.
Hard money
10% down · 12.0% · 12mo
- Down + closing
- —
- Monthly P&I
- —
- Monthly cashflow
- —
- DSCR
- —
- Eligible?
- —
Short-term bridge; refi at stabilization.
HOA detail
- Monthly dues
- $112 · $1,344/yr
- Likely covers
- cablepool
Listing history 20 events
-
2026-06-21days on market $154,500 Active 31 DOM
-
2026-06-19days on market $154,500 Active 29 DOM
-
2026-06-18days on market $154,500 Active 28 DOM
-
2026-06-17days on market $154,500 Active 27 DOM
-
2026-06-16days on market $154,500 Active 26 DOM
-
2026-06-15days on market $154,500 Active 25 DOM
-
2026-06-14days on market $154,500 Active 23 DOM
-
2026-06-10days on market $154,500 Active 20 DOM
-
2026-06-09days on market $154,500 Active 19 DOM
-
2026-06-08days on market $154,500 Active 18 DOM
-
2026-06-07days on market $154,500 Active 17 DOM
-
2026-06-02days on market $154,500 Active 12 DOM
-
2026-06-01days on market $154,500 Active 11 DOM
-
2026-05-31days on market $154,500 Active 10 DOM
-
2026-05-30days on market $154,500 Active 9 DOM
-
2026-05-19$154,500 Active
-
2025-10-29price $169,900
-
2025-04-16price $189,000
-
2012-06-29soldstatus $62,000
-
1997-05-16soldstatus $49,000
ⓘ Source: listings_history table (triggers on properties + properties_extension) + one-shot
backfill from property_details.listing_events for pre-trigger history.
Tax reassessment forecast FL · Resets to sale price
- Current annual tax
- $2,514 · $210/mo
- Projected year-2 tax
- $2,514 · $210/mo
- Expected delta
- $0/yr ($0/mo · 0.0%)
ⓘ Screening estimate from a state-policy table — verify with the county assessor before closing.
Climate risk First Street
- Flood 1/10 Low FEMA zone X (unshaded) · 0% chance over 30 yrs
- Wildfire 5/10 Major
- Heat 8/10 Severe 7 d/yr ≥108°F today · 26 d/yr by 30 yrs out
- Wind 10/10 Extreme 99% chance of damaging wind over 30 yrs
- Air quality 2/10 Low 1 unhealthy d/yr today · 1 by 30 yrs out
Nearby sold comps map
Loading sold comps map…
Walkable amenities ~0.75 mi
Loading nearby amenities…
Taxation est. · year 1
- Rental income
- $18,155
- − Mortgage interest
- −$8,654
- − Property taxes
- −$2,514
- − Insurance
- −$772
- − Repairs & maintenance
- −$1,452
- − Management
- −$1,452
- − HOA
- −$1,344
- − Depreciation
- −$4,495
- Taxable loss
- −$2,529
- Est. tax savings @ 24.0%
- +$607
- After-tax cash flow
- $596/yr
For passive investors: Depreciation is non-cash, so a rental often shows a tax loss while cash-flowing — sheltering income. Rental losses are passive: they offset passive income freely, and up to $25,000/yr can offset ordinary (W-2) income if you actively participate and your MAGI is under $100k (phasing out to $0 by $150k); unused losses carry forward. On sale, claimed depreciation is recaptured at up to 25%, and gains may owe capital-gains tax (a 1031 exchange can defer both). Figures are a year-1 estimate at your 24.0% rate — not tax advice; consult a CPA.
Schools (NCES district)
- District
- Highlands
- NCES district ID
- 1200840
- Math proficiency
- 45% ▼ -7.00%
- Reading proficiency
- 43% ▼ -3.00%
- Median HH income
- $35,276
- Composite
- 36.42/100
- National rank
- #4672
- State rank
- #54 of 73 in FL
Livability — Lake Placid
- Score
- 68/100
- State rank
- #525
- US rank
- #9813
Category grades
Schools grade is shown separately in the Schools card above.
Census & demographics
- County
- Highlands County · 98,898 people
- City population
- 22,600
- Metro
- Sebring-Avon Park, FL
- Population (ZIP)
- 22,600
- Household income
- $54,284
- Rent vs Own
- Severe rent burden
- 439.0
Population outlook (Highlands County) Hauer SSP2
- Today (2025)
- 99,674 people
- By 2030
- 99,615 · -0.1%
- By 2040
- 99,342 · -0.3%
- By 2050
- 98,242 · -1.4%
- By 2075
- 93,291 · -6.4%
- By 2100
- 79,894 · -19.8%
Race, ethnicity, and origin ACS 2023
- Neighborhood character
- Predominantly White (68%)
- Race & ethnicity
- White 68% Hispanic / Latino 22% Two or more races 11% Black 6% Asian 1%
- Hispanic origin (detail)
- Mexican 11% Puerto Rican 3% Cuban 3%
- Common ancestry
- Lithuanian 2% Slovak 2% Iranian 1%
- Foreign-born
- 14% · Canada, Dominican Republic
- Languages at home
- 79% English-only · Spanish 19% Tagalog/Filipino 1%
Political lean MEDSL · Highlands
- 2024 margin
- Solid R (+40.8) · D 29.3% · R 70.1%
- 2008→2024 swing
- -22.7pp toward R · 2008: -18.1pp · 2024: -40.8pp
- All cycles
- 2024: R+40.8 2020: R+34.4 2016: R+32.0 2012: R+23.0 2008: R+18.1
Not yet ingested
- Civics
- —
Market trends
- HPI YoY
- ▼ -203.31%
- Current HPI
- 224.8693
- Rent YoY
- ▲ 0.82%
- Metro
- Sebring-Avon Park, FL
- State GDP YoY
- ▲ 3.28%
- F500 in state
- 36
Industry mix (Fortune 500 HQ in FL)
| Industry | F500 HQs | Revenue |
|---|---|---|
| Industrial Technology | 2 | $29B |
|
||
| Insurance | 2 | $17B |
|
||
| Retail | 1 | $60B |
|
||
| Technology Distribution | 1 | $58B |
|
||
| Homebuilding | 1 | $35B |
|
||
| Technology Manufacturing | 1 | $35B |
|
||
Price history
+215.3% since first listed5 events — show timeline
- 2026-05-19 Listed $154,500 HAOR as distributed by MLS GRID
- 2025-10-29 Price Changed $169,900 HAOR as distributed by MLS GRID
- 2025-04-16 Price Changed $189,000 HAOR as distributed by MLS GRID
- 2012-06-29 Sold (Public Records) $62,000 Public Records
- 1997-05-16 Sold (Public Records) $49,000 Public Records
Property tax history
+13.8%/yrLatest (2025): $2,514 · +5.7% YoY. Source: county tax records.
Cash-flow waterfall
monthlySold comps — $/sqft
last 12 mo · ≤1 miLoading sold comps…