123 Linda Kay Ct · Warner Robins, GA
Flood risk 1/10 · Minimal
- FEMA flood zone
- X (unshaded)
- Chance of flooding over 30 yrs
- 0.0%
- Est. flood insurance / yr
- $507 – $1,088
Fire risk 3/10 · Minor
- Est. fire insurance / yr
- $963 – $1,789
Heat risk 7/10 · Major
- Hot days now (above 108°F)
- 7 days/yr
- Hot days in 30 yrs
- 17 days/yr
Wind risk 6/10 · Moderate
- Chance of severe wind over 30 yrs
- 76.0%
Air-quality risk 3/10 · Minor
- Unhealthy air days now
- 2 days/yr
- Unhealthy air days in 30 yrs
- 3 days/yr
Risk factors via First Street. Map © Google.
Why this score? — see what drove the B- grade
The composite is a weighted blend of 9 inputs, each scored 0–100. Each bar is that input's sub-score; the figure is the points it added to the 100-point composite (weight × sub-score).
- Cash flow +26.3/30.0
- ARV discount +15.0/15.0
- DSCR +8.9/10.0
- 1% rule +6.4/10.0
- Schools +3.9/10.0
- Livability +3.2/5.0
- Rent growth +2.9/5.0
- Condition / age +2.5/5.0
- Appreciation +0.0/10.0
$159,999
🖨 Deal sheet 📄 Offer letter ✓ Due diligence
Listing remarks MLS
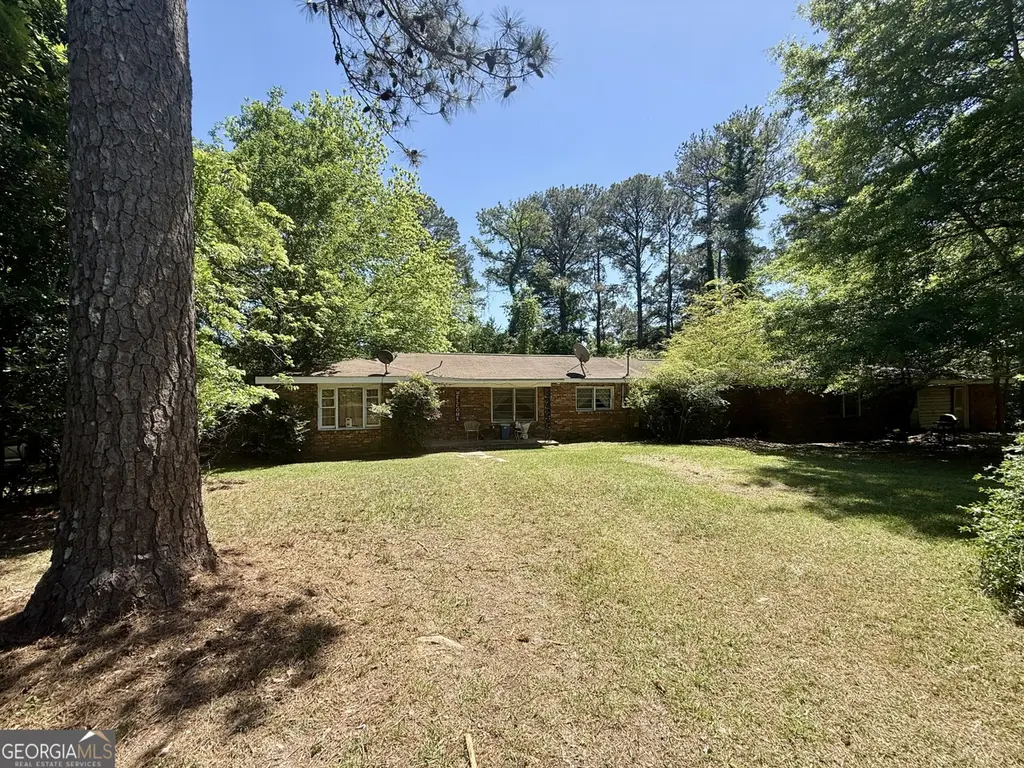
Investor opportunity in Warner Robins situated on 1.27 acres in an established neighborhood. Brick ranch style single level home offering 3 bedrooms with a bonus room and 2,270 square feet of living space. Interior features include a formal dining room, Jack and Jill bathroom setup, two full bathrooms, one car garage, covered porches, and two sliding glass doors leading to the rear porch. Property is being sold as is and will require significant repairs and full renovation throughout, ideal for investors or buyers planning a full rehab project. Large lot and ranch style layout provide a solid base for improvement and redesign. Any personal property remaining at closing will convey with the sale. Bring your contractor and vision.
Key facts
- Covered porches
- Formal dining room
- Sliding glass doors
Tags
Neighborhood map
What this means for you Summary
Snapshot
- This is a 3-bed/2.0-bath single-family listed at $160k.
Deal economics
- At list price, monthly cash flow is $414 ($5k/yr) — positive.
- The deal already cash-flows at list — no discount required.
- Meets the 1% rule at list price ($2k rent vs $160k).
- Recommended offer: $155k (3.0% below list) — sets the bar for market timing.
- Cap rate 9.4% vs local median 4.9% in Warner Robins — top-decile yield for the area; either an underpriced asset or a hidden risk that comps aren't pricing in. Stress-test before assuming the spread holds.
Location & tenants
- Location reads 65/100 on livability (#227 in GA) — a middle-class / working-renter tenant base. Strengths: cost of living A+, housing A+, health & safety A+; Watch: schools D+, employment D+, crime F.
- Houston County (urban): math 43% / reading 46% proficiency, ranked #23 of 174 in GA (top 13%) — families likely to look elsewhere, expect single-tenant / working-renter base with shorter leases.
- Market conditions: Rents rising (+1.7%/yr); 286 active listings in the ZIP; 7 comparable units currently listed for rent nearby; rentals lingering (median 44d on market — plan ~5-8 weeks vacancy on turnover, expect pricing pressure); 57% of comp listings sitting > 30 days — soft ceiling on asking rent; solid renter incomes; 1,545 units permitted in Houston County in 2024 (336 in 5+ unit buildings).
Forward outlook
- Local home prices are declining (-3.0%/yr); year-one equity from $1k of loan paydown is wiped out by about $5k of value loss. Plan a longer hold.
- Houston County population projected at +22% by 2050 — long-run rental-demand tailwind backs the buy-and-hold thesis.
Negotiation context
- It's been on market 39 days — a 3% lower offer ($155k) is reasonable based on typical stale-listing flexibility.
- 2 sale attempts with the ask held roughly flat each time — persistent listings suggest the price (not the market) is what's stuck; bring a comps-based counter.
- Current owner paid $125k; 28% above their basis — modest negotiation headroom, anchor on the comps not their cost.
Risks & watch-outs
- Watch-outs: built in 1957 — expect roof / HVAC / electrical / plumbing capex.
- Climate carrying-cost: major wind risk, 76% chance of damaging wind over 30y; extreme-heat days projected 7→17/yr by 2055 (HVAC capex compounding) — expect insurance premiums to compound above CPI over the hold.
Questions for the listing agent
- It's been on market 39 days. Have you received any prior offers? Is the seller open to a 3% concession, seller financing, or rate buy-down credit?
- Built in 1957 — when were the roof, HVAC, electrical panel, plumbing, and water heater last replaced?
- Is there a deadline driving the sale (1031 exchange, divorce, estate, relocation)? That informs how much negotiation room exists.
- Schools are D-rated, which usually means shorter tenancies and higher turnover. Who's the typical renter profile here, and what's been the actual vacancy rate?
- Crime grade is F in this area — have there been break-ins, vandalism, or insurance claims at this property in the last 3 years? What carrier currently insures it and at what premium?
- What's the average days-on-market for RENTAL listings here right now (not sales)? A rising rental-DOM trend means longer vacancies and softer asking-rent achievability than the comps imply.
- What's the recent tenant-quality profile in this submarket — average credit score on applications, eviction rate, late-payment / NSF rate, and stable-employment percentage? A property-management company in the area should have these aggregated.
- How much new for-sale + rental construction is in the pipeline within 1–3 miles? Heavy new supply typically softens prices + rents 12–24 months out; constrained supply supports both.
Investment metrics
- 1% rule
- 1.14% ✓
- Cap rate
- 9.40%
- Cash-on-cash
- 11.10%
- DSCR
- 1.49
- GRM
- 7.3
CMA / ARV
- ARV (median comp)
- $208,977
- List price
- $159,999
- Delta
- -23.44%
- Verdict
- UNDERPRICED
- Comps
- 20 within 1.0 mi
Show comp detail 12 sales within ~0.75 mi
| Address | Dist | Beds/Ba | Sqft | Sold | Price | $/sf | Match |
|---|---|---|---|---|---|---|---|
| 123 Linda Kay Ct | 0.00mi | 3/2.0 | 2,270 (0%) | 1mo | $141,000 | $62 | 100 |
| 204 Biltmore Ter | 0.18mi | 4/2.0 (+1) | 2,469 (+9%) | 10mo | $240,000 | $97 | 64 |
| 105 Lemuel Ct | 0.07mi | 4/3.0 (+1) | 2,079 (-8%) | 18mo | $230,000 | $111 | 59 |
| 505 Nelson Dr | 0.40mi | 3/2.0 | 2,030 (-11%) | 8mo | $80,000 | $39 | 57 |
| 213 Self St | 0.67mi | 4/2.0 (+1) | 2,202 (-3%) | 2mo | $245,000 | $111 | 57 |
| 201 Belmont Dr | 0.49mi | 3/2.5 | 2,489 (+10%) | 3mo | $251,000 | $101 | 56 |
| 303 Clairmont Dr | 0.25mi | 3/2.0 | 1,953 (-14%) | 14mo | $238,000 | $122 | 54 |
| 108 Vassas Ct | 0.14mi | 4/3.0 (+1) | 1,929 (-15%) | 10mo | $217,000 | $112 | 51 |
| 107 Colonial Rd | 0.47mi | 4/2.5 (+1) | 2,225 (-2%) | 20mo | $146,000 | $66 | 51 |
| 214 Laurie Ln | 0.24mi | 4/2.0 (+1) | 1,969 (-13%) | 14mo | $207,000 | $105 | 50 |
| 115 Friar Tuck Ave | 0.69mi | 4/3.5 (+1) | 2,152 (-5%) | 10mo | $218,000 | $101 | 40 |
| 611 Arrowhead Trl | 0.61mi | 3/2.5 | 1,935 (-15%) | 22mo | $237,000 | $122 | 27 |
Match score weights: distance 35% · size 25% · config 20% · recency 20%. Top-matched comps best support the ARV.
Projected returns pro-forma
-3.0% appreciation · 1.67% rent growth · sell at horizon
- IRR
- -1.2%
- Equity multiple
- 0.96×
- Total profit
- $-1,955
- Equity at exit
- $23,856
- IRR
- 7.1%
- Equity multiple
- 1.50×
- Total profit
- $22,596
- Equity at exit
- $13,834
Cash invested: $44,800 (down + closing). Projections, not guarantees.
Landlord ↔ Tenant lean methodology
- Overall (STATE)
- 90 Strongly Landlord-Friendly
- State Georgia
- 90 Strongly Landlord-Friendly · R+3
- County
- — inherits STATE
- City
- — inherits STATE
ZIP-level market 31088
- Rents YoY
- 1.7%
- Active inventory
- 286
- Price-to-rent
- 7.3×
Monthly cashflow live
- Estimated rent
- $1,818 high interval (Pro) →
- Mortgage (P&I)
- −$839
- Tax from tax record
- −$116 /mo · $1,394/yr
- Insurance
- −$67
- HOA
- −$0
- Vacancy / Maint / Mgmt
- −$382
- Net cashflow
- $414
Break-even live
UW: 25.0% down · 7.5% · 30yr · 1.5% tax · 5.0% vac · 8.0% maint · 8.0% mgmt
Financing live
Cash to close
- Down payment
- $40,000
- Closing costs
- $4,800
- Reserves months
- —
- Total cash needed
- —
Loan-product check · same deal, 3 products live
Conventional
25% down · 7.5% · 30yr
- Down + closing
- —
- Monthly P&I
- —
- Monthly cashflow
- —
- DSCR
- —
- Eligible?
- —
Personal DTI + credit; lowest rate.
DSCR
20% down · 8.5% · 30yr
- Down + closing
- —
- Monthly P&I
- —
- Monthly cashflow
- —
- DSCR
- —
- Eligible?
- —
No personal income docs; deal must DSCR.
Hard money
10% down · 12.0% · 12mo
- Down + closing
- —
- Monthly P&I
- —
- Monthly cashflow
- —
- DSCR
- —
- Eligible?
- —
Short-term bridge; refi at stabilization.
Rent comps 7 comps
| Address | Beds | Baths | Sqft | Rent | $/sqft | DOM | Units | Dist |
|---|---|---|---|---|---|---|---|---|
| 122 Rolling Woods Cir Warner Robins, GA | 3.0 | 2.5 | 1920 | $1,750 | $0.91 | 44d | 1 | 0.65mi |
| 122 Rolling Woods Cir Warner Robins, GA | 3.0 | 2.5 | 1920 | $1,750 | $0.91 | 21d | 1 | 0.65mi |
| 124 Carterwoods Dr Warner Robins, GA | 3.0 | 2.0 | 1818 | $1,811 | $1.00 | 21d | 1 | 1.00mi |
| 135 Sussex Dr Warner Robins, GA | 2.0 | 2.0 | 2047 | $1,495 | $0.73 | 44d | 1 | 1.27mi |
| 121 Highland Dr Warner Robins, GA | 3.0 | 2.0 | 1712 | $1,795 | $1.05 | 44d | 1 | 1.30mi |
| 121 Highland Dr Warner Robins, GA | 3.0 | 2.0 | 1712 | $1,795 | $1.05 | 21d | 1 | 1.30mi |
| 203 Lumpkin Dr Warner Robins, GA | 3.0 | 3.0 | 1700 | $2,200 | $1.29 | 44d | 1 | 1.38mi |
Listing history 5 events
-
2026-05-30status $159,999 Under Contract 39 DOM
-
2026-04-20$159,999 Active 738-char remark
Show marketing remark (738 chars)
Investor opportunity in Warner Robins situated on 1.27 acres in an established neighborhood. Brick ranch style single level home offering 3 bedrooms with a bonus room and 2,270 square feet of living space. Interior features include a formal dining room, Jack and Jill bathroom setup, two full bathrooms, one car garage, covered porches, and two sliding glass doors leading to the rear porch. Property is being sold as is and will require significant repairs and full renovation throughout, ideal for investors or buyers planning a full rehab project. Large lot and ranch style layout provide a solid base for improvement and redesign. Any personal property remaining at closing will convey with the sale. Bring your contractor and vision.
-
2026-04-19$159,999 New 738-char remark
Show marketing remark (738 chars)
Investor opportunity in Warner Robins situated on 1.27 acres in an established neighborhood. Brick ranch style single level home offering 3 bedrooms with a bonus room and 2,270 square feet of living space. Interior features include a formal dining room, Jack and Jill bathroom setup, two full bathrooms, one car garage, covered porches, and two sliding glass doors leading to the rear porch. Property is being sold as is and will require significant repairs and full renovation throughout, ideal for investors or buyers planning a full rehab project. Large lot and ranch style layout provide a solid base for improvement and redesign. Any personal property remaining at closing will convey with the sale. Bring your contractor and vision.
-
2011-01-05soldstatus $125,000
-
1995-05-25soldstatus $70,000
ⓘ Source: listings_history table (triggers on properties + properties_extension) + one-shot
backfill from property_details.listing_events for pre-trigger history.
Tax reassessment forecast GA · Resets to sale price
- Current annual tax
- $1,394 · $116/mo
- Projected year-2 tax
- $1,472 · $123/mo
- Expected delta
- +$78/yr (+$6/mo · 5.6%)
ⓘ Screening estimate from a state-policy table — verify with the county assessor before closing.
Climate risk First Street
- Flood 1/10 Low FEMA zone X (unshaded) · 0% chance over 30 yrs
- Wildfire 3/10 Moderate
- Heat 7/10 Severe 7 d/yr ≥108°F today · 17 d/yr by 30 yrs out
- Wind 6/10 Major 76% chance of damaging wind over 30 yrs
- Air quality 3/10 Moderate 2 unhealthy d/yr today · 3 by 30 yrs out
Nearby sold comps map
Loading sold comps map…
Walkable amenities ~0.75 mi
Loading nearby amenities…
Taxation est. · year 1
- Rental income
- $21,818
- − Mortgage interest
- −$8,962
- − Property taxes
- −$1,394
- − Insurance
- −$800
- − Repairs & maintenance
- −$1,745
- − Management
- −$1,745
- − Depreciation
- −$4,655
- Taxable income
- $2,516
- Est. tax owed @ 24.0%
- −$604
- After-tax cash flow
- $4,370/yr
For passive investors: Depreciation is non-cash, so a rental often shows a tax loss while cash-flowing — sheltering income. Rental losses are passive: they offset passive income freely, and up to $25,000/yr can offset ordinary (W-2) income if you actively participate and your MAGI is under $100k (phasing out to $0 by $150k); unused losses carry forward. On sale, claimed depreciation is recaptured at up to 25%, and gains may owe capital-gains tax (a 1031 exchange can defer both). Figures are a year-1 estimate at your 24.0% rate — not tax advice; consult a CPA.
Schools (NCES district)
- District
- Houston County
- NCES district ID
- 1302880
- Math proficiency
- 43% ▼ -7.00%
- Reading proficiency
- 46% ▼ -2.00%
- Median HH income
- $54,823
- Composite
- 38.68/100
- National rank
- #4144
- State rank
- #23 of 174 in GA
Livability — Warner Robins
- Score
- 65/100
- State rank
- #227
- US rank
- #13290
Category grades
Schools grade is shown separately in the Schools card above.
Census & demographics
- Census place
- Warner Robins, GA
- County
- Houston County · 157,321 people
- City population
- 92,102
- Metro
- Warner Robins, GA
- Population (ZIP)
- 58,585
- Household income
- $83,082
- Rent vs Own
- Severe rent burden
- 1668.0
Population outlook (Houston County) Hauer SSP2
- Today (2025)
- 169,502 people
- By 2030
- 178,486 · +5.3%
- By 2040
- 194,642 · +14.8%
- By 2050
- 207,119 · +22.2%
- By 2075
- 231,480 · +36.6%
- By 2100
- 235,034 · +38.7%
Race, ethnicity, and origin ACS 2023
- Neighborhood character
- Diverse neighborhood (Simpson 0.63)
- Race & ethnicity
- White 51% Black 32% Two or more races 9% Hispanic / Latino 7% Asian 4%
- Hispanic origin (detail)
- Mexican 4%
- Common ancestry
- Romanian 2% Slovak 2% Lithuanian 2%
- Foreign-born
- 9% · Canada, Vietnam, Jamaica
- Languages at home
- 90% English-only · Spanish 5% Other Asian/Pacific 2% Vietnamese 2%
Political lean MEDSL · Houston
- 2024 margin
- R (+11.3) · D 44.0% · R 55.3%
- 2008→2024 swing
- +8.9pp toward D · 2008: -20.2pp · 2024: -11.3pp
- All cycles
- 2024: R+11.3 2020: R+12.4 2016: R+21.6 2012: R+20.7 2008: R+20.2
Not yet ingested
- Civics
- —
Market trends
- HPI YoY
- ▼ -135.75%
- Current HPI
- 219.8261
- Rent YoY
- ▲ 1.67%
- Metro
- Warner Robins, GA
- State GDP YoY
- ▲ 2.66%
- F500 in state
- 28
Industry mix (Fortune 500 HQ in GA)
| Industry | F500 HQs | Revenue |
|---|---|---|
| Paper / Packaging | 2 | $29B |
|
||
| Retail | 1 | $160B |
|
||
| Transportation / Logistics | 1 | $91B |
|
||
| Airlines | 1 | $62B |
|
||
| Consumer Goods | 1 | $47B |
|
||
| Utilities | 1 | $25B |
|
||
Price history
+128.6% since first listed4 events — show timeline
- 2026-04-20 Listed $159,999 CGMLS
- 2026-04-19 Listed $159,999 GAMLS
- 2011-01-05 Sold (Public Records) $125,000 Public Records
- 1995-05-25 Sold (Public Records) $70,000 Public Records
Property tax history
+3.3%/yrLatest (2025): $1,394 · +2.7% YoY. Source: county tax records.
Cash-flow waterfall
monthlySold comps — $/sqft
last 12 mo · ≤1 miLoading sold comps…