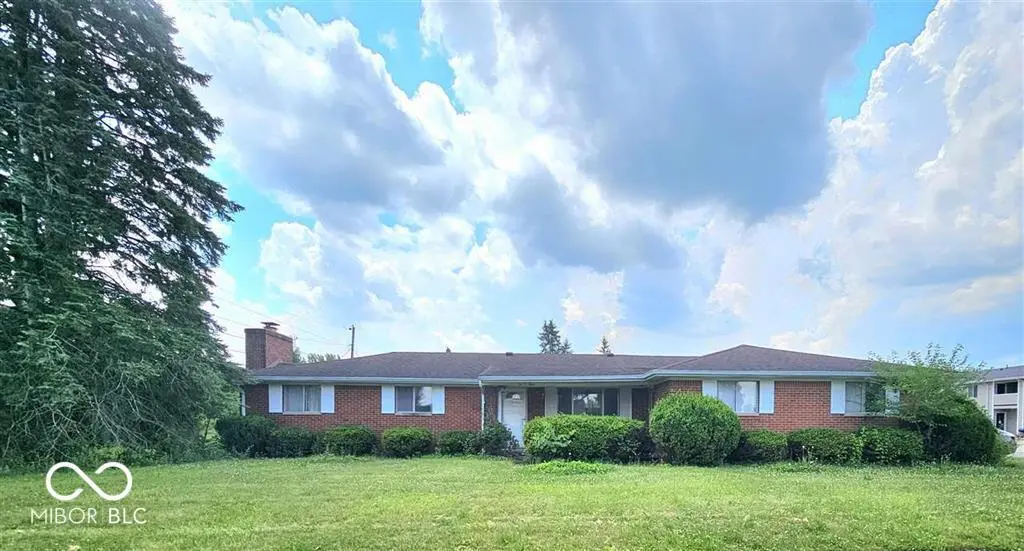
1009 Eastcrest Dr · Greentown, IN
Flood risk 1/10 · Minimal
- FEMA flood zone
- X (unshaded)
- Chance of flooding over 30 yrs
- 0.0%
- Est. flood insurance / yr
- $473 – $860
Fire risk 1/10 · Minimal
- Est. fire insurance / yr
- $717 – $1,331
Heat risk 3/10 · Minor
- Hot days now (above 100°F)
- 7 days/yr
- Hot days in 30 yrs
- 17 days/yr
Wind risk 2/10 · Minimal
- Chance of severe wind over 30 yrs
- —
Air-quality risk 3/10 · Minor
- Unhealthy air days now
- 1 days/yr
- Unhealthy air days in 30 yrs
- 3 days/yr
Risk factors via First Street. Map © Google.
Why this score? — see what drove the C- grade
The composite is a weighted blend of 9 inputs, each scored 0–100. Each bar is that input's sub-score; the figure is the points it added to the 100-point composite (weight × sub-score).
- ARV discount +15.0/15.0
- Cash flow +14.9/30.0
- 1% rule +4.7/10.0
- DSCR +4.6/10.0
- Schools +3.8/10.0
- Livability +3.4/5.0
- Rent growth +2.5/5.0
- Condition / age +2.5/5.0
- Appreciation +0.0/10.0
$155,000
🖨 Deal sheet (PDF) 📄 Offer letter ✓ Due diligence
Listing remarks MLS
Welcome to 1009 East Crest Drive in the heart of Greentown, Indiana. This spacious 3-bedroom, 2-bath home—including a private master suite—offers 1,800 square feet of living space thoughtfully designed for comfort and flexibility. With central air conditioning, a full basement complete with a fireplace, and a layout built for both relaxation and entertaining, this property is ideal for homeowners seeking a move-in ready space and investors looking for long-term value. Enjoy the large yard that’s perfect for outdoor gatherings, gardening projects, or creating a private retreat. The attached two-car garage adds convenience and extra storage, while the basement’s generous footprint provides room for additional living space, a game room, or even a separate rental opportunity. Whether you're expanding your portfolio or settling into your forever home, this property offers the versatility to match your goals. Opportunities like this don’t come along often. For more information or to schedule a private tour, contact Brian Ingle @ 765-960-0533 or email brian. [email protected].
Key facts
- Private master suite
- Large yard
- Full basement
Tags
Property features AI
Exterior
- Parking: Attached garage with garage door opener; 2-car garage
- Utilities: Public water; Municipal sewer connected; Solid waste service
- Home design: Single-family residence; One story
- Construction: Brick construction; Block foundation
- Exterior features: Approximately 0.35-acre lot
Interior
- Kitchen: Kitchen (main level)
- Bedrooms: 3 bedrooms on the main level
- Bathrooms: 2 full bathrooms (both on the main level)
- Heating & cooling: Forced air heating (natural gas); No central cooling
- Interior features: Breakfast bar; Basement
Neighborhood map
What this means for you Summary
Snapshot
- This is a 3-bed/1.5-bath single-family listed at $155k.
Deal economics
- At list price, monthly cash flow is $46 ($555/yr) — positive.
- The deal already cash-flows at list — no discount required.
- To meet the 1% rule (rent ≥ 1% of price), the offer needs to be $150k (3.2% below list).
- Recommended offer: $150k (3.2% below list) — sets the bar for 1% rule.
Location & tenants
- Location reads 67/100 on livability (#243 in IN) — a middle-class / working-renter tenant base. Strengths: crime A+, cost of living A+, housing A+; Watch: amenities F, commute F, health & safety D-.
- Eastern Howard School Corporation (town): math 40% / reading 47% proficiency, ranked #100 of 301 in IN (top 33%) — families likely to look elsewhere, expect single-tenant / working-renter base with shorter leases.
- Zoned schools: Eastern Elementary School (math 50% / reading 39%, grade F, #379 of 994 statewide, top 41%, 770 students, 45% FRL); Eastern Middle School (math 30% / reading 44%, grade F, #152 of 330 statewide, top 47%, 397 students, 48% FRL); Eastern High School (math 42% / reading 82%, grade B-, #41 of 369 statewide, top 12%, 467 students, 42% FRL) — zoned schools average 45% FRL vs 24% district-wide (20 pts higher); higher-poverty schools than district average — tighter screening recommended.
- Market conditions: 29 active listings in the ZIP; 1 comparable units currently listed for rent nearby; 194 units permitted in Howard County in 2024 (0 in 5+ unit buildings).
Forward outlook
- Local home prices are declining (-3.0%/yr); year-one equity from $1k of loan paydown is wiped out by about $5k of value loss. Plan a longer hold.
- Howard County population projected at -11% by 2050 — secular population decline; favor cash flow + early exit over multi-decade hold.
Negotiation context
- It's been on market 47 days — a 3% lower offer ($150k) is reasonable based on typical stale-listing flexibility.
- 7 sale attempts since 3y ago; this cycle's ask has dropped $20k (11%) from the opening price — seller is motivated, your offer sets the floor, not the list.
- Current owner paid $130k; 19% above their basis — modest negotiation headroom, anchor on the comps not their cost.
Questions for the listing agent
- It's been on market 47 days. Have you received any prior offers? Is the seller open to a 3% concession, seller financing, or rate buy-down credit?
- Built in 1966 — when were the roof, HVAC, electrical panel, plumbing, and water heater last replaced?
- Is there a deadline driving the sale (1031 exchange, divorce, estate, relocation)? That informs how much negotiation room exists.
- What's the average days-on-market for RENTAL listings here right now (not sales)? A rising rental-DOM trend means longer vacancies and softer asking-rent achievability than the comps imply.
- What's the recent tenant-quality profile in this submarket — average credit score on applications, eviction rate, late-payment / NSF rate, and stable-employment percentage? A property-management company in the area should have these aggregated.
- How much new for-sale + rental construction is in the pipeline within 1–3 miles? Heavy new supply typically softens prices + rents 12–24 months out; constrained supply supports both.
Investment metrics
- 1% rule
- 0.97% ✗
- Cap rate
- 6.65%
- Cash-on-cash
- 1.28%
- DSCR
- 1.06
- GRM
- 8.6
CMA / ARV
- ARV (median comp)
- $243,979
- List price
- $155,000
- Delta
- -36.47%
- Verdict
- UNDERPRICED
- Comps
- 20 within 1.0 mi
Show comp detail 12 sales within ~0.75 mi
| Address | Dist | Beds/Ba | Sqft | Sold | Price | $/sf | Match |
|---|---|---|---|---|---|---|---|
| 603 S Maple St | 0.10mi | 3/1.5 | 1,884 (+5%) | 13mo | $225,000 | $119 | 77 |
| 1508 Sunflower Ct | 0.32mi | 3/2.5 | 1,850 (+3%) | 8mo | $345,000 | $186 | 70 |
| 1233 Killdeer Rd | 0.30mi | 3/2.0 | 1,878 (+4%) | 11mo | $269,900 | $144 | 68 |
| 605 S Maple St | 0.10mi | 3/2.0 | 1,592 (-12%) | 8mo | $200,000 | $126 | 67 |
| 601 S Maple St | 0.09mi | 4/2.5 (+1) | 1,656 (-8%) | 8mo | $270,000 | $163 | 67 |
| 624 E Main St | 0.39mi | 3/2.0 | 1,854 (+3%) | 12mo | $210,000 | $113 | 65 |
| 709 E Main St | 0.34mi | 3/2.0 | 1,931 (+7%) | 7mo | $101,000 | $52 | 64 |
| 207 Meadows Dr | 0.37mi | 3/2.0 | 1,889 (+5%) | 11mo | $334,000 | $177 | 63 |
| 218 N Howard St | 0.64mi | 3/2.0 | 1,861 (+3%) | 3mo | $190,000 | $102 | 60 |
| 318 N Howard St | 0.69mi | 3/1.0 | 1,740 (-3%) | 12mo | $187,500 | $108 | 50 |
| 210 Meadows Dr | 0.39mi | 4/2.5 (+1) | 2,038 (+13%) | 12mo | $350,000 | $172 | 41 |
| 419 N Indiana St | 0.72mi | 3/1.0 | 1,588 (-12%) | 13mo | $107,000 | $67 | 34 |
Match score weights: distance 35% · size 25% · config 20% · recency 20%. Top-matched comps best support the ARV.
Projected returns pro-forma
-3.0% appreciation · 3.0% rent growth · sell at horizon
- IRR
- -14.2%
- Equity multiple
- 0.49×
- Total profit
- $-22,107
- Equity at exit
- $23,111
- IRR
- -5.4%
- Equity multiple
- 0.65×
- Total profit
- $-15,197
- Equity at exit
- $13,402
Cash invested: $43,400 (down + closing). Projections, not guarantees.
Landlord ↔ Tenant lean methodology
- Overall (STATE)
- 90 Strongly Landlord-Friendly
- State Indiana
- 90 Strongly Landlord-Friendly · R+11
- County
- — inherits STATE
- City
- — inherits STATE
ZIP-level market 46936
- Home prices YoY
- -24.1%
- Active inventory
- 29
- Price-to-rent
- 8.6×
Monthly cashflow live
- Estimated rent
- $1,500 medium interval (Pro) →
- Mortgage (P&I)
- −$813
- Tax from tax record
- −$261 /mo · $3,136/yr
- Insurance
- −$65
- HOA
- −$0
- Vacancy / Maint / Mgmt
- −$315
- Net cashflow
- $46
Break-even live
Sensitivity live
| Price | -10% $134 | -5% $90 | +0% $46 | +5% $2 | +10% $-41 |
|---|---|---|---|---|---|
| Rent | -10% $-72 | -5% $-13 | +0% $46 | +5% $105 | +10% $165 |
| Rate | -1.0pp $124 | -0.5pp $86 | base $46 | +0.5pp $6 | +1.0pp $-35 |
UW: 25.0% down · 7.5% · 30yr · 1.5% tax · 5.0% vac · 8.0% maint · 8.0% mgmt
Financing live
Cash to close
- Down payment
- $38,750
- Closing costs
- $4,650
- Reserves months
- —
- Total cash needed
- —
Loan-product check · same deal, 3 products live
Conventional
25% down · 7.5% · 30yr
- Down + closing
- —
- Monthly P&I
- —
- Monthly cashflow
- —
- DSCR
- —
- Eligible?
- —
Personal DTI + credit; lowest rate.
DSCR
20% down · 8.5% · 30yr
- Down + closing
- —
- Monthly P&I
- —
- Monthly cashflow
- —
- DSCR
- —
- Eligible?
- —
No personal income docs; deal must DSCR.
Hard money
10% down · 12.0% · 12mo
- Down + closing
- —
- Monthly P&I
- —
- Monthly cashflow
- —
- DSCR
- —
- Eligible?
- —
Short-term bridge; refi at stabilization.
Rent comps 1 comps
| Address | Beds | Baths | Sqft | Rent | $/sqft | DOM | Units | Dist |
|---|---|---|---|---|---|---|---|---|
| 623 W Main St Greentown, IN | 3.0 | 2.0 | 1656 | $1,500 | $0.91 | 45d | 1 | 1.05mi |
Listing history 33 events
-
2026-06-22days on market $155,000 Active 47 DOM
-
2026-06-19days on market $155,000 Active 45 DOM
-
2026-06-18days on market $155,000 Active 44 DOM
-
2026-06-17days on market $155,000 Active 43 DOM
-
2026-06-17price $155,000 Active 42 DOM
-
2026-06-16days on market $175,000 Active 42 DOM
Show marketing remark (1121 chars)
Welcome to 1009 East Crest Drive in the heart of Greentown, Indiana. This spacious 3-bedroom, 2-bath home—including a private master suite—offers 1,800 square feet of living space thoughtfully designed for comfort and flexibility. With central air conditioning, a full basement complete with a fireplace, and a layout built for both relaxation and entertaining, this property is ideal for homeowners seeking a move-in ready space and investors looking for long-term value. Enjoy the large yard that’s perfect for outdoor gatherings, gardening projects, or creating a private retreat. The attached two-car garage adds convenience and extra storage, while the basement’s generous footprint provides room for additional living space, a game room, or even a separate rental opportunity. Whether you're expanding your portfolio or settling into your forever home, this property offers the versatility to match your goals. Opportunities like this don’t come along often. For more information or to schedule a private tour, contact Brian Ingle @ 765-960-0533 or email brian. [email protected].
-
2026-06-15days on market $175,000 Active 41 DOM
-
2026-06-14days on market $175,000 Active 39 DOM
-
2026-06-13days on market $175,000 Active 38 DOM
-
2026-06-10days on market $175,000 Active 36 DOM
-
2026-06-09days on market $175,000 Active 35 DOM
-
2026-06-08days on market $175,000 Active 34 DOM
-
2026-06-07days on market $175,000 Active 33 DOM
-
2026-06-05days on market $175,000 Active 30 DOM
-
2026-06-03days on market $175,000 Active 29 DOM
-
2026-06-02days on market $175,000 Active 28 DOM
-
2026-06-01days on market $175,000 Active 27 DOM
-
2026-05-31days on market $175,000 Active 26 DOM
-
2026-05-30days on market $175,000 Active 25 DOM
-
2026-05-04$175,000 Active 964-char remark
-
2025-07-01$175,000 Active 1121-char remark
Show marketing remark (1121 chars)
Welcome to 1009 East Crest Drive in the heart of Greentown, Indiana. This spacious 3-bedroom, 2-bath home—including a private master suite—offers 1,800 square feet of living space thoughtfully designed for comfort and flexibility. With central air conditioning, a full basement complete with a fireplace, and a layout built for both relaxation and entertaining, this property is ideal for homeowners seeking a move-in ready space and investors looking for long-term value. Enjoy the large yard that’s perfect for outdoor gatherings, gardening projects, or creating a private retreat. The attached two-car garage adds convenience and extra storage, while the basement’s generous footprint provides room for additional living space, a game room, or even a separate rental opportunity. Whether you're expanding your portfolio or settling into your forever home, this property offers the versatility to match your goals. Opportunities like this don’t come along often. For more information or to schedule a private tour, contact Brian Ingle @ 765-960-0533 or email brian. [email protected].
-
2025-02-15price $169,000
-
2024-11-12$195,000 Active
-
2024-10-18historical
-
2023-09-08price $189,000
-
2023-09-08price $189,000
-
2023-09-08price $189,000
-
2023-08-31status Active
-
2023-08-13historical
-
2023-03-19$199,000 Active
-
2023-03-19$199,000 Active
-
2023-03-19$199,000 Active
-
2023-02-13soldstatus $130,000
ⓘ Source: listings_history table (triggers on properties + properties_extension) + one-shot
backfill from property_details.listing_events for pre-trigger history.
Tax reassessment forecast IN · Partial reset (capped growth)
- Current annual tax
- $3,136 · $261/mo
- Projected year-2 tax
- $3,136 · $261/mo
- Expected delta
- $0/yr ($0/mo · 0.0%)
ⓘ Screening estimate from a state-policy table — verify with the county assessor before closing.
Climate risk First Street
- Flood 1/10 Low FEMA zone X (unshaded) · 0% chance over 30 yrs
- Wildfire 1/10 Low
- Heat 3/10 Moderate 7 d/yr ≥100°F today · 17 d/yr by 30 yrs out
- Wind 2/10 Low
- Air quality 3/10 Moderate 1 unhealthy d/yr today · 3 by 30 yrs out
Nearby sold comps map
Loading sold comps map…
Walkable amenities ~0.75 mi
Loading nearby amenities…
Taxation est. · year 1
- Rental income
- $18,000
- − Mortgage interest
- −$8,682
- − Property taxes
- −$3,136
- − Insurance
- −$775
- − Repairs & maintenance
- −$1,440
- − Management
- −$1,440
- − Depreciation
- −$4,509
- Taxable loss
- −$1,983
- Est. tax savings @ 24.0%
- +$476
- After-tax cash flow
- $1,031/yr
For passive investors: Depreciation is non-cash, so a rental often shows a tax loss while cash-flowing — sheltering income. Rental losses are passive: they offset passive income freely, and up to $25,000/yr can offset ordinary (W-2) income if you actively participate and your MAGI is under $100k (phasing out to $0 by $150k); unused losses carry forward. On sale, claimed depreciation is recaptured at up to 25%, and gains may owe capital-gains tax (a 1031 exchange can defer both). Figures are a year-1 estimate at your 24.0% rate — not tax advice; consult a CPA.
Schools (NCES district)
- District
- Eastern Howard School Corporation
- NCES district ID
- 1803150
- Math proficiency
- 40% ▼ -6.00%
- Reading proficiency
- 47% ▼ -2.00%
- Median HH income
- $58,636
- Composite
- 38.2/100
- National rank
- #4255
- State rank
- #100 of 301 in IN
Livability — Greentown
- Score
- 67/100
- State rank
- #243
- US rank
- #10353
Category grades
Schools grade is shown separately in the Schools card above.
Census & demographics
- Census place
- Greentown, IN
- Population (ZIP)
- 5,956
Population outlook (Howard County) Hauer SSP2
- Today (2025)
- 81,522 people
- By 2030
- 80,104 · -1.7%
- By 2040
- 76,708 · -5.9%
- By 2050
- 72,880 · -10.6%
- By 2075
- 64,016 · -21.5%
- By 2100
- 51,705 · -36.6%
Race, ethnicity, and origin ACS 2023
- Neighborhood character
- Predominantly White (92%)
- Race & ethnicity
- White 92% Hispanic / Latino 4% Two or more races 3% Black 1%
- Common ancestry
- Italian 3% Portuguese 2% Slovak 1%
- Foreign-born
- 1%
Political lean MEDSL · Howard
- 2024 margin
- Solid R (+35.3) · D 31.4% · R 66.7% · Other 1.8%
- 2008→2024 swing
- -29.1pp toward R · 2008: -6.2pp · 2024: -35.3pp
- All cycles
- 2024: R+35.3 2020: R+32.4 2016: R+33.9 2012: R+14.3 2008: R+6.2
Not yet ingested
- Civics
- —
Market trends
- HPI YoY
- ▼ -66.91%
- Current HPI
- 211.2334
- Rent YoY
- —
- Metro
- —
- State GDP YoY
- ▲ 2.90%
- F500 in state
- 18
Industry mix (Fortune 500 HQ in IN)
| Industry | F500 HQs | Revenue |
|---|---|---|
| Industrial Machinery | 2 | $37B |
|
||
| Healthcare | 1 | $177B |
|
||
| Pharmaceuticals | 1 | $45B |
|
||
| Metals / Steel | 1 | $18B |
|
||
| Agriculture | 1 | $17B |
|
||
| Packaging | 1 | $12B |
|
||
Price history
+19.2% since first listed16 events — show timeline
- 2026-06-16 Price Changed $155,000 RRELMS
- 2026-06-16 Price Changed $155,000 MIBOR as Distributed by MLS Grid
- 2026-05-04 Listed $175,000 MIBOR as Distributed by MLS Grid
- 2025-07-01 Listed $175,000 RRELMS
- 2025-02-15 Price Changed $169,000 IRMLS
- 2024-11-12 Listed $195,000 IRMLS
- 2024-10-18 Listing Removed — MIBOR as Distributed by MLS Grid
- 2023-09-08 Price Changed $189,000 THAAR
- 2023-09-08 Price Changed $189,000 IRMLS
- 2023-09-08 Price Changed $189,000 MIBOR as Distributed by MLS Grid
- 2023-08-31 Relisted — IRMLS
- 2023-08-13 Delisted — IRMLS
- 2023-03-19 Listed $199,000 IRMLS
- 2023-03-19 Listed $199,000 MIBOR as Distributed by MLS Grid
- 2023-03-19 Listed $199,000 THAAR
- 2023-02-13 Sold (Public Records) $130,000 Public Records
Property tax history
+19.5%/yrLatest (2024): $3,136 · +8.9% YoY. Source: county tax records.
Cash-flow waterfall
monthlySold comps — $/sqft
last 12 mo · ≤1 miLoading sold comps…