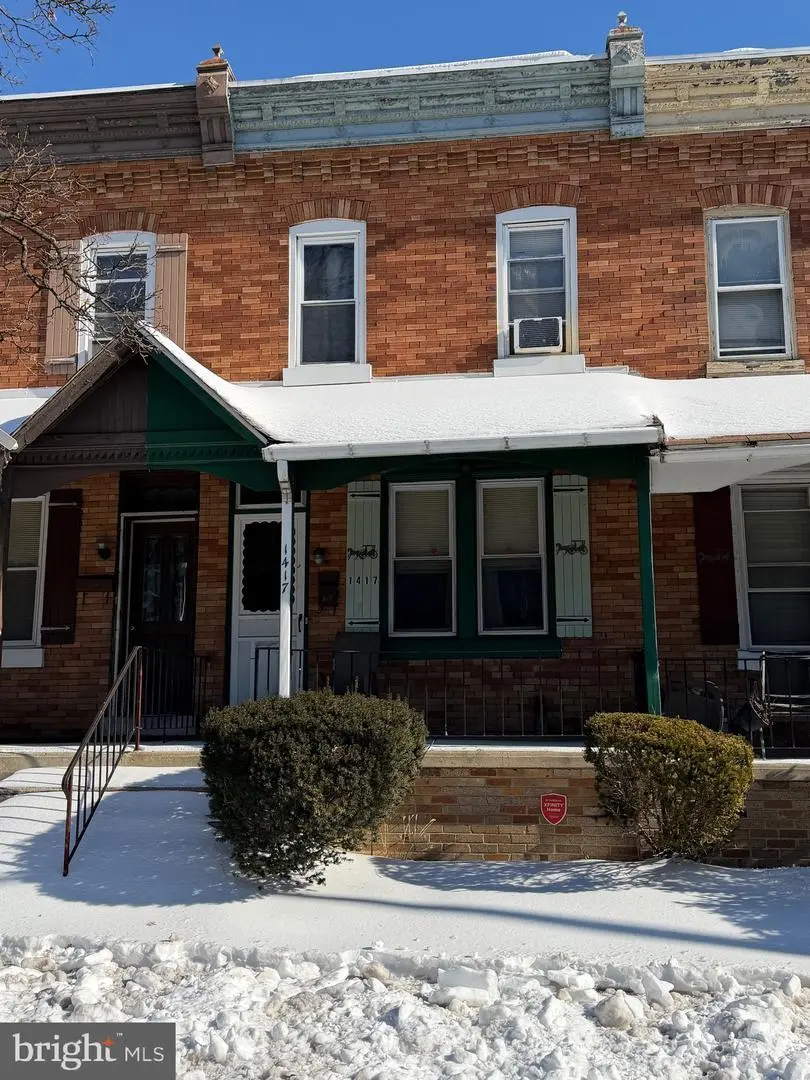
1417 Edgmont Ave · Chester, PA
Flood risk No data
- FEMA flood zone
- —
- Chance of flooding over 30 yrs
- —
- Est. flood insurance / yr
- —
Fire risk No data
- Est. fire insurance / yr
- —
Heat risk No data
- Hot days now (above threshold)
- —
- Hot days in 30 yrs
- —
Wind risk No data
- Chance of severe wind over 30 yrs
- —
Air-quality risk No data
- Unhealthy air days now
- —
- Unhealthy air days in 30 yrs
- —
Risk factors via First Street. Map © Google.
Why this score? — see what drove the C grade
The composite is a weighted blend of 9 inputs, each scored 0–100. Each bar is that input's sub-score; the figure is the points it added to the 100-point composite (weight × sub-score).
- Cash flow +23.6/30.0
- DSCR +7.6/10.0
- 1% rule +7.5/10.0
- ARV discount +5.9/15.0
- Rent growth +4.2/5.0
- Livability +3.7/5.0
- Condition / age +2.5/5.0
- Schools +0.8/10.0
- Appreciation +0.0/10.0
$129,900
🖨 Deal sheet 📄 Offer letter ✓ Due diligence
Listing remarks MLS
Located on a great, well-established block just steps from Widener University, this well-kept 3-bedroom, 1-full-bath brick rowhome offers comfort, convenience, and charm. The inviting covered front porch leads into a spacious living and dining area, perfect for everyday living and entertaining. The home has been lovingly maintained and features a functional layout with generously sized bedrooms and a full bathroom. Enjoy the convenience of city living with easy access to public transportation, shopping, dining, and major routes. Whether you’re a homeowner or investor, this property is a solid opportunity in a desirable location near Widener.
Key facts
- Covered front porch
- Functional layout
- Built 1945
Tags
Neighborhood map
What this means for you Summary
Snapshot
- This is a 3-bed/1.0-bath townhouse listed at $130k.
Deal economics
- At list price, monthly cash flow is $246 ($3k/yr) — positive.
- The deal already cash-flows at list — no discount required.
- Meets the 1% rule at list price ($2k rent vs $130k).
- Recommended offer: $114k (12.0% below list) — sets the bar for market timing.
Location & tenants
- Location reads 73/100 on livability (#540 in PA) — a middle-class / working-renter tenant base. Strengths: amenities A+, commute A+, cost of living A+; Watch: schools F, crime F, employment F.
- Chester-Upland SD (suburban): math 4% / reading 17% proficiency, ranked #533 of 539 in PA (top 99%) — low school quality limits family demand, transient renter base, plan for 1-2y turnover; 81% free/reduced lunch — lower-income household profile, screen leases tightly.
- Market conditions: Rents rising fast (+6.9%/yr); 138 active listings in the ZIP; 26 comparable units currently listed for rent nearby; rentals at typical pace (median 25d on market — plan ~3-4 weeks tenant-placement turnaround); lower-income renter base — watch delinquency; 299 units permitted in Delaware County in 2024 (5 in 5+ unit buildings).
- At $1,630/mo this rent would consume 47% of the median local household income ($41k/yr) (locally 2668% of renters already pay >50% of income on rent) — very limited rent-growth headroom before tenants either downsize or default.
Forward outlook
- Local home prices are declining (-3.0%/yr); year-one equity from $898 of loan paydown is wiped out by about $4k of value loss. Plan a longer hold.
- At projected returns (-3.0% appreciation + 6.9% rent growth), your $36k cash investment doubles in ~9 years — after that, you're playing with house money.
Negotiation context
- It's been on market 140 days — a 12% lower offer ($114k) is reasonable based on typical stale-listing flexibility.
- 2 sale attempts since 27y ago with the ask held roughly flat each time — persistent listings suggest the price (not the market) is what's stuck; bring a comps-based counter.
- Current owner paid $28k; list at $130k implies a 364% gain — meaningful room to come down on a strong offer.
Risks & watch-outs
- Watch-outs: property tax is 2.8% of price; built in 1945 — expect roof / HVAC / electrical / plumbing capex.
Questions for the listing agent
- It's been on market 140 days. Have you received any prior offers? Is the seller open to a 12% concession, seller financing, or rate buy-down credit?
- Built in 1945 — when were the roof, HVAC, electrical panel, plumbing, and water heater last replaced?
- Property tax is high relative to price — has the assessment been appealed recently, and will the sale trigger a re-assessment?
- Why hasn't it sold? Are there any deal-killer items the seller is aware of (foundation, flood, title, zoning, code violations)?
- Is there a deadline driving the sale (1031 exchange, divorce, estate, relocation)? That informs how much negotiation room exists.
- Schools are F-rated, which usually means shorter tenancies and higher turnover. Who's the typical renter profile here, and what's been the actual vacancy rate?
- Crime grade is F in this area — have there been break-ins, vandalism, or insurance claims at this property in the last 3 years? What carrier currently insures it and at what premium?
- What's the average days-on-market for RENTAL listings here right now (not sales)? A rising rental-DOM trend means longer vacancies and softer asking-rent achievability than the comps imply.
- What's the recent tenant-quality profile in this submarket — average credit score on applications, eviction rate, late-payment / NSF rate, and stable-employment percentage? A property-management company in the area should have these aggregated.
- How much new for-sale + rental construction is in the pipeline within 1–3 miles? Heavy new supply typically softens prices + rents 12–24 months out; constrained supply supports both.
Investment metrics
- 1% rule
- 1.25% ✓
- Cap rate
- 8.56%
- Cash-on-cash
- 8.11%
- DSCR
- 1.36
- GRM
- 6.6
CMA / ARV
- ARV (median comp)
- $125,321
- List price
- $129,900
- Delta
- 3.65%
- Verdict
- FAIR
- Comps
- 20 within 1.0 mi
Show comp detail 12 sales within ~0.75 mi
| Address | Dist | Beds/Ba | Sqft | Sold | Price | $/sf | Match |
|---|---|---|---|---|---|---|---|
| 1424 Ridley Ave | 0.63mi | 3/1.0 | 1,248 (+1%) | 2mo | $130,000 | $104 | 68 |
| 125 W 21st St | 0.42mi | 3/1.5 | 1,152 (-7%) | 1mo | $135,000 | $117 | 66 |
| 312 W 21st St | 0.44mi | 3/1.0 | 1,152 (-7%) | 2mo | $155,000 | $135 | 66 |
| 327 W 21st St | 0.42mi | 3/1.5 | 1,152 (-7%) | 2mo | $105,312 | $91 | 65 |
| 21 W 21st St | 0.44mi | 3/1.0 | 1,151 (-7%) | 3mo | $137,500 | $119 | 65 |
| 200 W 21st St | 0.44mi | 3/1.0 | 1,152 (-7%) | 3mo | $160,000 | $139 | 65 |
| 1008 E 18th St | 0.66mi | 3/1.0 | 1,200 (-3%) | 1mo | $200,000 | $167 | 63 |
| 2419 Upland St | 0.66mi | 3/1.0 | 1,212 (-2%) | 3mo | $105,000 | $87 | 63 |
| 921 Mcdowell Ave | 0.57mi | 3/1.0 | 1,108 (-11%) | 3mo | $74,000 | $67 | 53 |
| 1118 Brown St | 0.60mi | 3/1.0 | 1,092 (-12%) | 1mo | $147,000 | $135 | 51 |
| 1109 Brown St | 0.60mi | 3/1.0 | 1,092 (-12%) | 3mo | $47,000 | $43 | 50 |
| 1105 Brown St | 0.59mi | 3/1.0 | 1,080 (-13%) | 4mo | $50,000 | $46 | 48 |
Match score weights: distance 35% · size 25% · config 20% · recency 20%. Top-matched comps best support the ARV.
Projected returns pro-forma
-3.0% appreciation · 6.88% rent growth · sell at horizon
- IRR
- 0.9%
- Equity multiple
- 1.04×
- Total profit
- $1,324
- Equity at exit
- $19,369
- IRR
- 14.5%
- Equity multiple
- 2.41×
- Total profit
- $51,148
- Equity at exit
- $11,231
Cash invested: $36,372 (down + closing). Projections, not guarantees.
Landlord ↔ Tenant lean methodology
- Overall (STATE)
- 62 Landlord-Friendly
- State Pennsylvania
- 62 Landlord-Friendly · EVEN
- County
- — inherits STATE
- City
- — inherits STATE
ZIP-level market 19013
- Rents YoY
- 6.9%
- Active inventory
- 138
- Price-to-rent
- 6.6×
Monthly cashflow live
- Estimated rent
- $1,630 high interval (Pro) →
- Mortgage (P&I)
- −$681
- Tax from tax record
- −$306 /mo · $3,676/yr
- Insurance
- −$54
- HOA
- −$0
- Vacancy / Maint / Mgmt
- −$342
- Net cashflow
- $246
Break-even live
UW: 25.0% down · 7.5% · 30yr · 1.5% tax · 5.0% vac · 8.0% maint · 8.0% mgmt
Financing live
Cash to close
- Down payment
- $32,475
- Closing costs
- $3,897
- Reserves months
- —
- Total cash needed
- —
Loan-product check · same deal, 3 products live
Conventional
25% down · 7.5% · 30yr
- Down + closing
- —
- Monthly P&I
- —
- Monthly cashflow
- —
- DSCR
- —
- Eligible?
- —
Personal DTI + credit; lowest rate.
DSCR
20% down · 8.5% · 30yr
- Down + closing
- —
- Monthly P&I
- —
- Monthly cashflow
- —
- DSCR
- —
- Eligible?
- —
No personal income docs; deal must DSCR.
Hard money
10% down · 12.0% · 12mo
- Down + closing
- —
- Monthly P&I
- —
- Monthly cashflow
- —
- DSCR
- —
- Eligible?
- —
Short-term bridge; refi at stabilization.
Rent comps 26 comps
| Address | Beds | Baths | Sqft | Rent | $/sqft | DOM | Units | Dist |
|---|---|---|---|---|---|---|---|---|
| 1127 Walnut St Chester, PA | 4.0 | 1.5 | 1312 | $1,600 | $1.22 | 8d | 1 | 0.34mi |
| 13 E 21st St Unit A Chester, PA | 2.0 | 1.0 | 900 | $1,250 | $1.39 | 44d | 1 | 0.40mi |
| 125 W 21st St Chester, PA | 4.0 | 1.5 | 1152 | $1,850 | $1.61 | 24d | 1 | 0.40mi |
| 330 W 21st St Chester, PA | 3.0 | 1.0 | 1152 | $1,500 | $1.30 | 44d | 1 | 0.43mi |
| 814 Upland St Chester, PA | 3.0 | 1.0 | 1344 | $1,525 | $1.13 | 8d | 1 | 0.45mi |
| 2219 Madison St Unit B Chester, PA | 2.0 | 1.0 | 800 | $1,000 | $1.25 | 44d | 1 | 0.51mi |
| 1211 Johnson St Chester, PA | 3.0 | 1.0 | 882 | $1,500 | $1.70 | 3d | 1 | 0.53mi |
| 1510 Washington Ave Chester, PA | 4.0 | 1.5 | 1280 | $2,000 | $1.56 | 18d | 1 | 0.57mi |
| 2015 Hyatt St Chester, PA | 3.0 | 1.0 | 988 | $1,950 | $1.97 | 11d | 1 | 0.57mi |
| 1118 Brown St Unit 318 Chester, PA | 3.0 | 1.0 | 1092 | $1,900 | $1.74 | 15d | 1 | 0.61mi |
| 314 E 24th St Chester, PA | 2.0 | 1.0–1.5 | 800 | $1,500 | $1.88 | 4d | 13 | 0.66mi |
| 1124 Thomas St Chester, PA | 3.0 | 1.0 | 1046 | $1,200 | $1.15 | 24d | 1 | 0.67mi |
| 1206 Thomas St Chester, PA | 3.0 | 1.0 | 833 | $1,399 | $1.68 | 24d | 1 | 0.71mi |
| 2701 Madison St Chester, PA | 1.0–2.0 | 1.0 | 860 | $1,533 | $1.78 | 2d | 10 | 0.73mi |
| 25 W Parkway Ave Chester, PA | 3.0 | 1.0 | 1324 | $1,600 | $1.21 | 5d | 1 | 0.74mi |
| 418 Penn St Chester, PA | 3.0 | 1.0 | 1250 | $1,350 | $1.08 | 44d | 1 | 0.89mi |
| 2607 Edgmont Ave Unit 2F Brookhaven, PA | 2.0 | 1.0 | 850 | $1,600 | $1.88 | 24d | 1 | 0.89mi |
| 1944 Ridley Mill Ln Woodlyn, PA | 2.0 | 1.0 | 840 | $1,600 | $1.90 | 44d | 1 | 0.91mi |
| 30 W Roland Rd Brookhaven, PA | 3.0 | 1.0 | 1424 | $1,695 | $1.19 | 44d | 1 | 0.94mi |
| 1312 E 13th St Crum Lynne, PA | 3.0 | 1.0 | 1280 | $1,940 | $1.52 | 18d | 1 | 0.97mi |
| 89 Park Valley Ln Brookhaven, PA | 2.0 | 1.5 | 984 | $1,705 | $1.73 | 44d | 1 | 1.28mi |
| 51 Park Valley Ln Brookhaven, PA | 2.0 | 1.5 | 990 | $1,795 | $1.81 | 18d | 1 | 1.29mi |
| 925 W 3rd St Chester, PA | 4.0 | 1.0 | 1500 | $1,700 | $1.13 | 18d | 1 | 1.31mi |
| 1400 MacDade Blvd Woodlyn, PA | 1.0–2.0 | 1.0 | 775 | $1,600 | $2.06 | 44d | 2 | 1.31mi |
| 1433 Grant Ave Unit B Woodlyn, PA | 2.0 | 1.0 | 1200 | $1,450 | $1.21 | 44d | 1 | 1.38mi |
| 407 Beech Rd Apt B Wallingford, PA | 2.0 | 1.0 | 998 | $1,600 | $1.60 | 44d | 1 | 1.47mi |
Listing history 20 events
-
2026-06-18days on market $129,900 Active 140 DOM
-
2026-06-17days on market $129,900 Active 139 DOM
-
2026-06-16days on market $129,900 Active 138 DOM
-
2026-06-15days on market $129,900 Active 137 DOM
-
2026-06-13days on market $129,900 Active 135 DOM
-
2026-06-13days on market $129,900 Active 134 DOM
-
2026-06-09days on market $129,900 Active 131 DOM
-
2026-06-08days on market $129,900 Active 130 DOM
-
2026-06-07days on market $129,900 Active 129 DOM
-
2026-06-04days on market $129,900 Active 126 DOM
-
2026-06-03days on market $129,900 Active 125 DOM
-
2026-06-02days on market $129,900 Active 124 DOM
-
2026-06-01days on market $129,900 Active 123 DOM
-
2026-05-31days on market $129,900 Active 122 DOM
-
2026-03-17price $129,900 655-char remark
Show marketing remark (655 chars)
Located on a great, well-established block just steps from Widener University, this well-kept 3-bedroom, 1-full-bath brick rowhome offers comfort, convenience, and charm. The inviting covered front porch leads into a spacious living and dining area, perfect for everyday living and entertaining. The home has been lovingly maintained and features a functional layout with generously sized bedrooms and a full bathroom. Enjoy the convenience of city living with easy access to public transportation, shopping, dining, and major routes. Whether you’re a homeowner or investor, this property is a solid opportunity in a desirable location near Widener.
-
2026-01-29$135,000 Active 655-char remark
Show marketing remark (655 chars)
Located on a great, well-established block just steps from Widener University, this well-kept 3-bedroom, 1-full-bath brick rowhome offers comfort, convenience, and charm. The inviting covered front porch leads into a spacious living and dining area, perfect for everyday living and entertaining. The home has been lovingly maintained and features a functional layout with generously sized bedrooms and a full bathroom. Enjoy the convenience of city living with easy access to public transportation, shopping, dining, and major routes. Whether you’re a homeowner or investor, this property is a solid opportunity in a desirable location near Widener.
-
2001-02-16historical
-
1999-11-11$22,300
-
1992-07-30soldstatus $28,000
-
1992-05-11soldstatus $28,000
ⓘ Source: listings_history table (triggers on properties + properties_extension) + one-shot
backfill from property_details.listing_events for pre-trigger history.
Tax reassessment forecast PA · Partial reset (capped growth)
- Current annual tax
- $3,676 · $306/mo
- Projected year-2 tax
- $3,676 · $306/mo
- Expected delta
- $0/yr ($0/mo · 0.0%)
ⓘ Screening estimate from a state-policy table — verify with the county assessor before closing.
Nearby sold comps map
Loading sold comps map…
Walkable amenities ~0.75 mi
Loading nearby amenities…
Taxation est. · year 1
- Rental income
- $19,555
- − Mortgage interest
- −$7,276
- − Property taxes
- −$3,676
- − Insurance
- −$650
- − Repairs & maintenance
- −$1,564
- − Management
- −$1,564
- − Depreciation
- −$3,779
- Taxable income
- $1,046
- Est. tax owed @ 24.0%
- −$251
- After-tax cash flow
- $2,698/yr
For passive investors: Depreciation is non-cash, so a rental often shows a tax loss while cash-flowing — sheltering income. Rental losses are passive: they offset passive income freely, and up to $25,000/yr can offset ordinary (W-2) income if you actively participate and your MAGI is under $100k (phasing out to $0 by $150k); unused losses carry forward. On sale, claimed depreciation is recaptured at up to 25%, and gains may owe capital-gains tax (a 1031 exchange can defer both). Figures are a year-1 estimate at your 24.0% rate — not tax advice; consult a CPA.
Schools (NCES district)
- District
- Chester-Upland SD
- NCES district ID
- 4205860
- Math proficiency
- 4% ▼ -3.00%
- Reading proficiency
- 17% ▼ -6.00%
- Median HH income
- $29,790
- Composite
- 8.05/100
- National rank
- #9918
- State rank
- #533 of 539 in PA
Livability — Chester
- Score
- 73/100
- State rank
- #540
- US rank
- #5053
Category grades
Schools grade is shown separately in the Schools card above.
Census & demographics
- Census place
- Chester, PA
- County
- Delaware County · 399,863 people
- City population
- 35,064
- Metro
- Philadelphia-Camden-Wilmington, PA-NJ-DE-MD
- Population (ZIP)
- 35,064
- Household income
- $41,261
- Rent vs Own
- Severe rent burden
- 2668.0
Population outlook (Delaware County) Hauer SSP2
- Today (2025)
- 577,490 people
- By 2030
- 581,243 · +0.6%
- By 2040
- 584,700 · +1.2%
- By 2050
- 586,581 · +1.6%
- By 2075
- 598,706 · +3.7%
- By 2100
- 590,823 · +2.3%
Race, ethnicity, and origin ACS 2023
- Neighborhood character
- Predominantly Black (71%)
- Race & ethnicity
- Black 71% White 14% Hispanic / Latino 9% Two or more races 4%
- Hispanic origin (detail)
- Puerto Rican 6%
- Common ancestry
- Romanian 2%
- Foreign-born
- 4% · Canada
- Languages at home
- 92% English-only · Spanish 6%
Political lean MEDSL · Delaware
- 2024 margin
- Strong D (+23.7) · D 61.4% · R 37.6% · Other 1.0%
- 2008→2024 swing
- +2.3pp toward D · 2008: 21.4pp · 2024: 23.7pp
- All cycles
- 2024: D+23.7 2020: D+26.7 2016: D+22.0 2012: D+21.8 2008: D+21.4
Not yet ingested
- Civics
- —
Market trends
- HPI YoY
- ▼ -149.69%
- Current HPI
- 219.5173
- Rent YoY
- ▲ 6.88%
- Metro
- Philadelphia-Camden-Wilmington, PA-NJ-DE-MD
- State GDP YoY
- ▲ 1.68%
- F500 in state
- 34
Industry mix (Fortune 500 HQ in PA)
| Industry | F500 HQs | Revenue |
|---|---|---|
| Healthcare | 2 | $309B |
|
||
| Insurance | 2 | $27B |
|
||
| Telecommunications / Media | 1 | $124B |
|
||
| Industrial Distribution | 1 | $22B |
|
||
| Financial Services | 1 | $20B |
|
||
| Chemicals / Materials | 1 | $18B |
|
||
Price history
+363.9% since first listed6 events — show timeline
- 2026-03-17 Price Changed $129,900 BRIGHT MLS
- 2026-01-29 Listed $135,000 BRIGHT MLS
- 2001-02-16 Listing Removed — BRIGHT MLS
- 1999-11-11 Listed $22,300 BRIGHT MLS
- 1992-07-30 Sold (Public Records) $28,000 Public Records
- 1992-05-11 Sold (Public Records) $28,000 Public Records
Property tax history
+19.9%/yrLatest (2026): $3,676 · +143.3% YoY. Source: county tax records.
Cash-flow waterfall
monthlySold comps — $/sqft
last 12 mo · ≤1 miLoading sold comps…