1089 Rabbit Trail Rd · Lexington, AL
Flood risk 9/10 · Severe
- FEMA flood zone
- X (unshaded)
- Chance of flooding over 30 yrs
- 0.99%
- Est. flood insurance / yr
- $473 – $860
Fire risk 5/10 · Moderate
- Est. fire insurance / yr
- $949 – $1,763
Heat risk 5/10 · Moderate
- Hot days now (above 105°F)
- 7 days/yr
- Hot days in 30 yrs
- 19 days/yr
Wind risk 5/10 · Moderate
- Chance of severe wind over 30 yrs
- 26.0%
Air-quality risk 2/10 · Minimal
- Unhealthy air days now
- 0 days/yr
- Unhealthy air days in 30 yrs
- 1 days/yr
Risk factors via First Street. Map © Google.
Why this score? — see what drove the B grade
The composite is a weighted blend of 9 inputs, each scored 0–100. Each bar is that input's sub-score; the figure is the points it added to the 100-point composite (weight × sub-score).
- Cash flow +30.0/30.0
- 1% rule +10.0/10.0
- DSCR +10.0/10.0
- ARV discount +7.5/15.0
- Appreciation +7.0/10.0
- Livability +3.6/5.0
- Rent growth +2.5/5.0
- Schools +2.4/10.0
- Condition / age +1.0/5.0
$69,900
🖨 Deal sheet 📄 Offer letter ✓ Due diligence
Listing remarks
MOTIVATED SELLERS! Bring offers! Investor special with endless potential! This 4 bedroom, 2 bath spacious home sits on 1.5 acres near the state line. In need of repairs & updates, this property is ideal for flippers.
Key facts
- 1.4 acre lot
- Built 1940
- Listed 56 days
Property features AI
Exterior
- Parking: No covered parking indicated; No parking total indicated
- Utilities: Well water; Septic tank; Electricity available
- Home design: Single-family residence; One level; Residential property
- Construction: Vinyl siding; Existing structure (year built not specified)
- Exterior features: 1.5-acre lot
Interior
- Kitchen: No appliances listed
- Bedrooms: 4 bedrooms (all on main level)
- Flooring: Carpet; Laminate
- Bathrooms: 2 full bathrooms
- Heating & cooling: Electric heating; Electric cooling
- Interior features: Open basement: none; Carpet and laminate flooring
- Laundry & utility: No laundry appliances listed
Neighborhood map
What this means for you Summary
Snapshot
- This is a 4-bed/2.0-bath single-family listed at $70k. Condition is rated poor.
Deal economics
- At list price, monthly cash flow is $510 ($6k/yr) — positive.
- The deal already cash-flows at list — no discount required.
- Meets the 1% rule at list price ($1k rent vs $70k).
- Recommended offer: $68k (3.0% below list) — sets the bar for market timing.
- Cap rate 16.0% vs local median 3.2% in Lexington — top-decile yield for the area; either an underpriced asset or a hidden risk that comps aren't pricing in. Stress-test before assuming the spread holds.
Location & tenants
- Location reads 71/100 on livability (#34 in AL) — a middle-class / working-renter tenant base. Strengths: crime A+, cost of living A+, housing A+; Watch: amenities F, commute F, health & safety D-.
- Lawrence County (rural): math 29% / reading 29% proficiency, ranked #67 of 139 in TN (top 48%) — low school quality limits family demand, transient renter base, plan for 1-2y turnover.
- Zoned schools: South Lawrence Elementary (math 34% / reading 30%, grade F, #369 of 952 statewide, top 42%, 540 students, 0% FRL); Loretto High School (math 8% / reading 32%, grade F, #183 of 332 statewide, top 59%, 493 students, 0% FRL) — zoned schools average 0% FRL vs 50% district-wide (50 pts lower); this property's tenant base skews higher-income than the district average.
- Market conditions: 27 units permitted in Lawrence County in 2024 (0 in 5+ unit buildings).
Forward outlook
- In year one you build about $3k of equity ($483 loan paydown + $3k appreciation (4.0% local appreciation)).
- Lawrence County population projected to shrink 4% by 2050 — rents likely to lag national; underwrite the cash flow, not the appreciation.
- At projected returns (4.0% appreciation + 3.0% rent growth), your $20k cash investment doubles in ~3 years — after that, you're playing with house money.
- By year 10, paydown + projected appreciation supports a ~$32k cash-out refi (75% LTV) — recoverable capital for the next deal without selling this one.
Negotiation context
- It's been on market 57 days — a 3% lower offer ($68k) is reasonable based on typical stale-listing flexibility.
- 2 sale attempts; this cycle's ask has dropped $10k (13%) from the opening price — seller is motivated, your offer sets the floor, not the list.
Risks & watch-outs
- Watch-outs: flood insurance adds $56/mo; built in 1940 — expect roof / HVAC / electrical / plumbing capex.
- Climate carrying-cost: severe flood risk; moderate wind risk, 26% chance of damaging wind over 30y; moderate wildfire risk; extreme-heat days projected 7→19/yr by 2055 (HVAC capex compounding) — expect insurance premiums to compound above CPI over the hold.
Questions for the listing agent
- It's been on market 57 days. Have you received any prior offers? Is the seller open to a 3% concession, seller financing, or rate buy-down credit?
- Have any recent inspections been done? Can we get a copy of the seller's disclosures and any deferred-maintenance estimates?
- Built in 1940 — when were the roof, HVAC, electrical panel, plumbing, and water heater last replaced?
- What's the actual annual flood-insurance premium (NFIP or private), and is the property in a SFHA with mandatory coverage?
- Is there a deadline driving the sale (1031 exchange, divorce, estate, relocation)? That informs how much negotiation room exists.
- What's the average days-on-market for RENTAL listings here right now (not sales)? A rising rental-DOM trend means longer vacancies and softer asking-rent achievability than the comps imply.
- What's the recent tenant-quality profile in this submarket — average credit score on applications, eviction rate, late-payment / NSF rate, and stable-employment percentage? A property-management company in the area should have these aggregated.
- How much new for-sale + rental construction is in the pipeline within 1–3 miles? Heavy new supply typically softens prices + rents 12–24 months out; constrained supply supports both.
Investment metrics
- 1% rule
- 1.90% ✓
- Cap rate
- 16.01%
- Cash-on-cash
- 34.69%
- DSCR
- 2.54
- GRM
- 4.4
CMA / ARV
No comps found within radius.
Projected returns pro-forma
3.99% appreciation · 3.0% rent growth · sell at horizon
- IRR
- 38.7%
- Equity multiple
- 3.28×
- Total profit
- $44,683
- Equity at exit
- $35,381
- IRR
- 37.8%
- Equity multiple
- 6.58×
- Total profit
- $109,213
- Equity at exit
- $57,821
Cash invested: $19,572 (down + closing). Projections, not guarantees.
Landlord ↔ Tenant lean methodology
- Overall (STATE)
- 90 Strongly Landlord-Friendly
- State Alabama
- 90 Strongly Landlord-Friendly · R+15
- County
- — inherits STATE
- City
- — inherits STATE
ZIP-level market 38457
- Home prices YoY
- 3.6%
- Price-to-rent
- 4.4×
Monthly cashflow live
- Estimated rent
- $1,328 medium interval (Pro) →
- Mortgage (P&I)
- −$367
- Tax est. 1.5%
- −$87 /mo · $1,048/yr
- Insurance
- −$29
- Flood insurance flood zone
- −$56 /mo · $666/yr
- HOA
- −$0
- Vacancy / Maint / Mgmt
- −$279
- Net cashflow
- $510
Break-even live
UW: 25.0% down · 7.5% · 30yr · 1.5% tax · 5.0% vac · 8.0% maint · 8.0% mgmt
Financing live
Cash to close
- Down payment
- $17,475
- Closing costs
- $2,097
- Reserves months
- —
- Total cash needed
- —
Loan-product check · same deal, 3 products live
Conventional
25% down · 7.5% · 30yr
- Down + closing
- —
- Monthly P&I
- —
- Monthly cashflow
- —
- DSCR
- —
- Eligible?
- —
Personal DTI + credit; lowest rate.
DSCR
20% down · 8.5% · 30yr
- Down + closing
- —
- Monthly P&I
- —
- Monthly cashflow
- —
- DSCR
- —
- Eligible?
- —
No personal income docs; deal must DSCR.
Hard money
10% down · 12.0% · 12mo
- Down + closing
- —
- Monthly P&I
- —
- Monthly cashflow
- —
- DSCR
- —
- Eligible?
- —
Short-term bridge; refi at stabilization.
Listing history 18 events
-
2026-06-18days on market $69,900 Active 57 DOM
-
2026-06-17days on market $69,900 Active 56 DOM
-
2026-06-16days on market $69,900 Active 55 DOM
-
2026-06-15days on market $69,900 Active 54 DOM
-
2026-06-13days on market $69,900 Active 52 DOM
-
2026-06-12days on market $69,900 Active 51 DOM
-
2026-06-09days on market $69,900 Active 48 DOM
-
2026-06-08days on market $69,900 Active 47 DOM
-
2026-06-08days on market $69,900 Active 46 DOM
-
2026-06-07days on market $69,900 Active 45 DOM
-
2026-06-03days on market $69,900 Active 42 DOM
-
2026-06-02days on market $69,900 Active 41 DOM
-
2026-06-01days on market $69,900 Active 40 DOM
-
2026-05-31days on market $69,900 Active 39 DOM
-
2026-05-19status Active
-
2026-05-08historical Active Under Contract
-
2026-04-23$79,900 Active
-
2026-04-22historical $79,900
ⓘ Source: listings_history table (triggers on properties + properties_extension) + one-shot
backfill from property_details.listing_events for pre-trigger history.
Climate risk First Street
- Flood 9/10 Extreme FEMA zone X (unshaded) · 99% chance over 30 yrs
- Wildfire 5/10 Major
- Heat 5/10 Major 7 d/yr ≥105°F today · 19 d/yr by 30 yrs out
- Wind 5/10 Major 26% chance of damaging wind over 30 yrs
- Air quality 2/10 Low 0 unhealthy d/yr today · 1 by 30 yrs out
Nearby sold comps map
Loading sold comps map…
Walkable amenities ~0.75 mi
Loading nearby amenities…
Taxation est. · year 1
- Rental income
- $15,931
- − Mortgage interest
- −$3,915
- − Property taxes
- −$1,048
- − Insurance
- −$1,016
- − Repairs & maintenance
- −$1,274
- − Management
- −$1,274
- − Depreciation
- −$2,033
- Taxable income
- $5,369
- Est. tax owed @ 24.0%
- −$1,289
- After-tax cash flow
- $4,834/yr
For passive investors: Depreciation is non-cash, so a rental often shows a tax loss while cash-flowing — sheltering income. Rental losses are passive: they offset passive income freely, and up to $25,000/yr can offset ordinary (W-2) income if you actively participate and your MAGI is under $100k (phasing out to $0 by $150k); unused losses carry forward. On sale, claimed depreciation is recaptured at up to 25%, and gains may owe capital-gains tax (a 1031 exchange can defer both). Figures are a year-1 estimate at your 24.0% rate — not tax advice; consult a CPA.
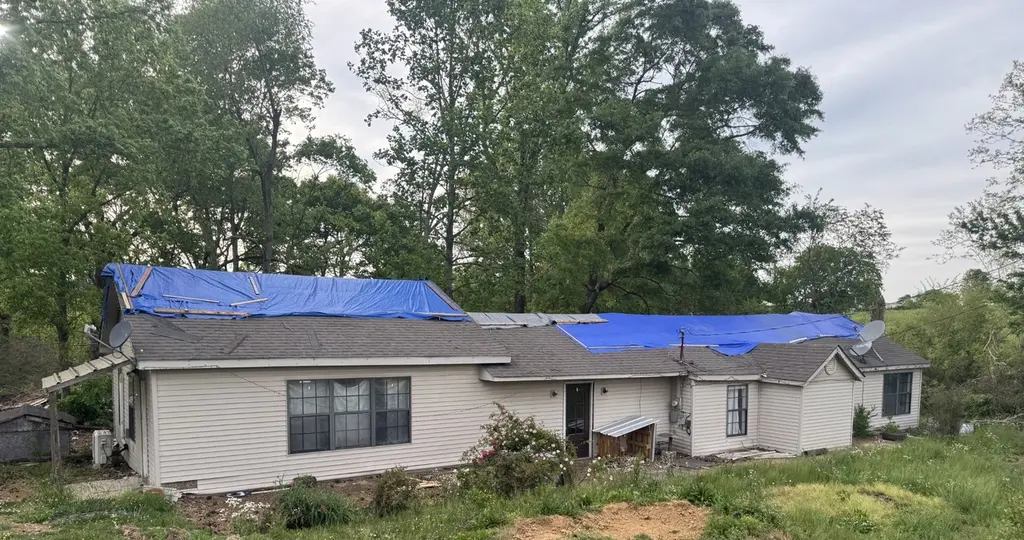
Condition & rehab AI · 4 photos
This home requires extensive repairs and updates, including a new roof, siding, HVAC unit, and landscaping, to become move-in ready and increase its value.
Repairs flagged
- Major roof — The blue tarps indicate significant damage that needs to be addressed.
- Major siding — The siding is weathered and in need of replacement or repainting.
- Major HVAC unit — The unit appears old and not functioning, requiring replacement or repair.
- Major interior walls — The walls are bare and the paint is old and chipped, requiring repainting or new walls.
- Major landscaping — The landscaping is sparse and overgrown, requiring significant work to improve curb appeal.
Value-add opportunities
- Resale Painting the interior walls — Fresh paint can make a significant difference in the home's appearance and value.
- Rental Replacing the HVAC unit — A functioning HVAC system is crucial for rental properties and can attract tenants.
- Both Landscaping the yard — Improved landscaping can enhance curb appeal and attract both buyers and renters.
Renovation cost estimate screening
| Repair item | Severity | Est. cost |
|---|---|---|
| roof · The blue tarps indicate significant damage that needs to be addressed. | Major | $15,000–50,000 |
| siding · The siding is weathered and in need of replacement or repainting. | Major | $15,000–50,000 |
| HVAC unit · The unit appears old and not functioning, requiring replacement or repair. | Major | $15,000–50,000 |
| interior walls · The walls are bare and the paint is old and chipped, requiring repainting or new walls. | Major | $15,000–50,000 |
| landscaping · The landscaping is sparse and overgrown, requiring significant work to improve curb appeal. | Major | $15,000–50,000 |
| Total estimated repair cost · 5 items | $75,000–250,000 |
Value-add ROI direction
- Resale Painting the interior walls — Fresh paint can make a significant difference in the home's appearance and value. ↑
- Rental Replacing the HVAC unit — A functioning HVAC system is crucial for rental properties and can attract tenants. ↑
- Both Landscaping the yard — Improved landscaping can enhance curb appeal and attract both buyers and renters. ↑
ⓘ Cost ranges are severity-bucket heuristics (US national rule-of-thumb). Get contractor quotes + a written scope before underwriting a rehab budget.
Schools (NCES district)
- District
- Lawrence County
- NCES district ID
- 4702340
- Math proficiency
- 29% ▼ -11.00%
- Reading proficiency
- 29% ▼ -8.00%
- Median HH income
- $37,613
- Composite
- 24.2/100
- National rank
- #7729
- State rank
- #67 of 139 in TN
Livability — Lexington
- Score
- 71/100
- State rank
- #34
- US rank
- #6638
Category grades
Schools grade is shown separately in the Schools card above.
Census & demographics
- City population
- 3,622
- Population (ZIP)
- 491
Population outlook (Lawrence County) Hauer SSP2
- Today (2025)
- 42,724 people
- By 2030
- 42,627 · -0.2%
- By 2040
- 42,144 · -1.4%
- By 2050
- 40,800 · -4.5%
- By 2075
- 36,643 · -14.2%
- By 2100
- 29,193 · -31.7%
Race, ethnicity, and origin ACS 2023
- Neighborhood character
- Predominantly White (97%)
- Race & ethnicity
- White 97% Hispanic / Latino 3% Two or more races 3%
- Common ancestry
- Serbian 4% Slovak 4% Lithuanian 3%
- Languages at home
- 99% English-only · Spanish 1%
Political lean MEDSL · Lawrence
- 2024 margin
- Solid R (+69.1) · D 15.1% · R 84.1%
- 2008→2024 swing
- -35.3pp toward R · 2008: -33.7pp · 2024: -69.1pp
- All cycles
- 2024: R+69.1 2020: R+64.8 2016: R+61.3 2012: R+42.9 2008: R+33.7
Not yet ingested
- Civics
- —
Market trends
- HPI YoY
- ▲ 3.99%
- Current HPI
- 114.4646
- Rent YoY
- —
- Metro
- —
- State GDP YoY
- ▲ 2.94%
- F500 in state
- 4
Industry mix (Fortune 500 HQ in AL)
| Industry | F500 HQs | Revenue |
|---|---|---|
| Financial Services | 1 | $8B |
|
||
| Healthcare | 1 | $5B |
|
||
Price history
+0.0% since first listed4 events — show timeline
- 2026-05-19 Relisted — REALTRACS as Distributed by MLS Grid
- 2026-05-08 Contingent — REALTRACS as Distributed by MLS Grid
- 2026-04-23 Listed $79,900 REALTRACS as Distributed by MLS Grid
- 2026-04-22 Coming Soon $79,900 REALTRACS as Distributed by MLS Grid
Cash-flow waterfall
monthlySold comps — $/sqft
last 12 mo · ≤1 miLoading sold comps…