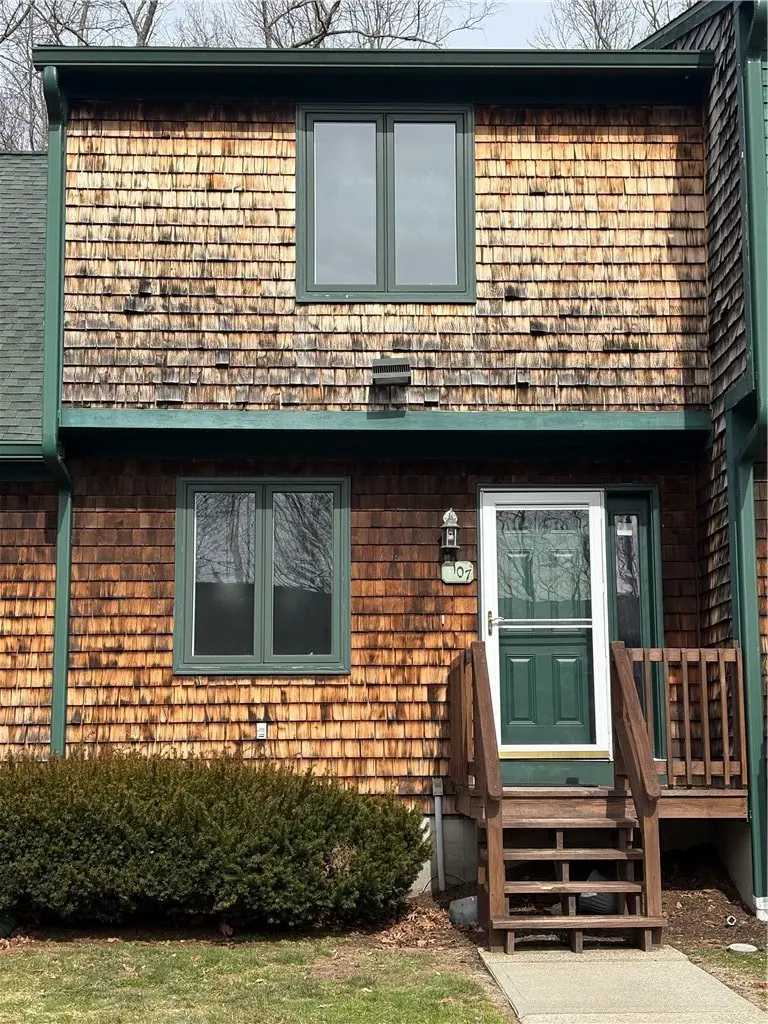
107 Arthurs Way #107 · Pascoag, RI
Flood risk No data
- FEMA flood zone
- —
- Chance of flooding over 30 yrs
- —
- Est. flood insurance / yr
- —
Fire risk No data
- Est. fire insurance / yr
- —
Heat risk No data
- Hot days now (above threshold)
- —
- Hot days in 30 yrs
- —
Wind risk No data
- Chance of severe wind over 30 yrs
- —
Air-quality risk No data
- Unhealthy air days now
- —
- Unhealthy air days in 30 yrs
- —
Risk factors via First Street. Map © Google.
Why this score? — see what drove the D- grade
The composite is a weighted blend of 9 inputs, each scored 0–100. Each bar is that input's sub-score; the figure is the points it added to the 100-point composite (weight × sub-score).
- Appreciation +10.0/10.0
- ARV discount +7.5/15.0
- Cash flow +6.9/30.0
- Livability +3.5/5.0
- 1% rule +2.6/10.0
- Rent growth +2.5/5.0
- Condition / age +2.5/5.0
- Schools +2.1/10.0
- DSCR +1.2/10.0
$269,900
🖨 Deal sheet 📄 Offer letter ✓ Due diligence
Listing remarks
Live in a wooded oasis with the convenience of living in a condominium! This lovely unit features 2 spacious bedrooms, 1 full bath and 1 half bath featuring an updated kitchen, lots of natural light, ample closet space and a roomy basement. Enjoy a convenient Northern Rhode Island location with 2 parking spots and a peaceful deck facing the woods.
Key facts
- Roomy basement
- Ample closet space
- Natural light
Tags
Neighborhood map
What this means for you Summary
Snapshot
- This is a 2-bed/1.5-bath condo listed at $270k.
Deal economics
- At list price, monthly cash flow is $-402 ($-5k/yr) — negative.
- To cash-flow at today's rent, offer at most $199k (26.3% below list).
- To meet the 1% rule (rent ≥ 1% of price), the offer needs to be $205k (24.1% below list).
- Recommended offer: $199k (26.3% below list) — sets the bar for cash-flow.
Location & tenants
- Location reads 70/100 on livability (#17 in RI) — a middle-class / working-renter tenant base. Strengths: crime A+, employment A+, housing A+; Watch: schools F, amenities F, commute F.
- Burrillville (suburban): math 14% / reading 29% proficiency, ranked #27 of 39 in RI (top 69%) — low school quality limits family demand, transient renter base, plan for 1-2y turnover.
- Market conditions: 47 active listings in the ZIP; 776 units permitted in Providence County in 2024 (229 in 5+ unit buildings).
Forward outlook
- In year one you build about $29k of equity ($2k loan paydown + $27k appreciation (10.0% local appreciation)).
- Providence County population projected at +5% by 2050 — modest demand growth; plan on rents tracking national, not racing it.
- By year 2, paydown + projected appreciation supports a ~$46k cash-out refi (75% LTV) — recoverable capital for the next deal without selling this one.
Negotiation context
- Only 1 days on market — expect competitive offers; lowballing is unlikely to land.
Questions for the listing agent
- What do current leases actually rent for vs. the listed asking? Can we see a recent rent roll and the last 12 months of T-12 income?
- What does the HOA fee cover, when was the last increase, and are there any pending special assessments or reserve-fund shortfalls?
- Any open or pending special assessments — roof, HVAC, plumbing, elevator, façade? What's the per-unit balance and payoff schedule, and is the seller paying it off at close or rolling it to the buyer?
- Is there a deadline driving the sale (1031 exchange, divorce, estate, relocation)? That informs how much negotiation room exists.
- Schools are F-rated, which usually means shorter tenancies and higher turnover. Who's the typical renter profile here, and what's been the actual vacancy rate?
- The area grade is low — what's the realistic commute time and amenity access for the typical tenant pool here? Any planned neighborhood developments (good or bad) we should know about?
- What's the average days-on-market for RENTAL listings here right now (not sales)? A rising rental-DOM trend means longer vacancies and softer asking-rent achievability than the comps imply.
- What's the recent tenant-quality profile in this submarket — average credit score on applications, eviction rate, late-payment / NSF rate, and stable-employment percentage? A property-management company in the area should have these aggregated.
- How much new apartment / multifamily construction is in the pipeline within 1–3 miles? Heavy new supply (>2% of stock underway) typically softens rents 12–24 months out; light construction supports rent growth.
Investment metrics
- 1% rule
- 0.76% ✗
- Cap rate
- 4.50%
- Cash-on-cash
- -6.39%
- DSCR
- 0.72
- GRM
- 11.0
CMA / ARV
No comps found within radius.
Projected returns pro-forma
10.0% appreciation · 3.0% rent growth · sell at horizon
- IRR
- 19.8%
- Equity multiple
- 2.61×
- Total profit
- $121,490
- Equity at exit
- $243,147
- IRR
- 18.1%
- Equity multiple
- 6.00×
- Total profit
- $378,176
- Equity at exit
- $524,356
Cash invested: $75,572 (down + closing). Projections, not guarantees.
Landlord ↔ Tenant lean methodology
- Overall (STATE)
- 31 Tenant-Leaning
- State Rhode Island
- 31 Tenant-Leaning · D+8
- County
- — inherits STATE
- City
- — inherits STATE
ZIP-level market 02859
- Home prices YoY
- 4.8%
- Active inventory
- 47
- Price-to-rent
- 11.0×
Monthly cashflow live
- Estimated rent
- $2,049 medium interval (Pro) →
- Mortgage (P&I)
- −$1,415
- Tax from tax record
- −$193 /mo · $2,321/yr
- Insurance
- −$112
- HOA
- −$300
- Vacancy / Maint / Mgmt
- −$430
- Net cashflow
- $-402
Break-even live
UW: 25.0% down · 7.5% · 30yr · 1.5% tax · 5.0% vac · 8.0% maint · 8.0% mgmt
Financing live
Cash to close
- Down payment
- $67,475
- Closing costs
- $8,097
- Reserves months
- —
- Total cash needed
- —
Loan-product check · same deal, 3 products live
Conventional
25% down · 7.5% · 30yr
- Down + closing
- —
- Monthly P&I
- —
- Monthly cashflow
- —
- DSCR
- —
- Eligible?
- —
Personal DTI + credit; lowest rate.
DSCR
20% down · 8.5% · 30yr
- Down + closing
- —
- Monthly P&I
- —
- Monthly cashflow
- —
- DSCR
- —
- Eligible?
- —
No personal income docs; deal must DSCR.
Hard money
10% down · 12.0% · 12mo
- Down + closing
- —
- Monthly P&I
- —
- Monthly cashflow
- —
- DSCR
- —
- Eligible?
- —
Short-term bridge; refi at stabilization.
HOA detail condo
- Monthly dues
- $300 · $3,600/yr
- Assessments
- None detected in remarks — confirm with the listing agent.
Listing history 2 events
-
2026-06-07remarks 351-char remark
-
2026-06-07$269,900 Pending 1 DOM
ⓘ Source: listings_history table (triggers on properties + properties_extension) + one-shot
backfill from property_details.listing_events for pre-trigger history.
Tax reassessment forecast RI · Partial reset (capped growth)
- Current annual tax
- $2,321 · $193/mo
- Projected year-2 tax
- $3,360 · $280/mo
- Expected delta
- +$1,039/yr (+$87/mo · 44.8%)
ⓘ Screening estimate from a state-policy table — verify with the county assessor before closing.
Nearby sold comps map
Loading sold comps map…
Walkable amenities ~0.75 mi
Loading nearby amenities…
Taxation est. · year 1
- Rental income
- $24,590
- − Mortgage interest
- −$15,119
- − Property taxes
- −$2,321
- − Insurance
- −$1,350
- − Repairs & maintenance
- −$1,967
- − Management
- −$1,967
- − HOA
- −$3,600
- − Depreciation
- −$7,852
- Taxable loss
- −$9,585
- Est. tax savings @ 24.0%
- +$2,300
- After-tax cash flow
- $-2,529/yr
For passive investors: Depreciation is non-cash, so a rental often shows a tax loss while cash-flowing — sheltering income. Rental losses are passive: they offset passive income freely, and up to $25,000/yr can offset ordinary (W-2) income if you actively participate and your MAGI is under $100k (phasing out to $0 by $150k); unused losses carry forward. On sale, claimed depreciation is recaptured at up to 25%, and gains may owe capital-gains tax (a 1031 exchange can defer both). Figures are a year-1 estimate at your 24.0% rate — not tax advice; consult a CPA.
Schools (NCES district)
- District
- Burrillville
- NCES district ID
- 4400090
- Math proficiency
- 14% ▼ -6.00%
- Reading proficiency
- 29% ▼ -5.00%
- Median HH income
- $66,679
- Composite
- 20.69/100
- National rank
- #8529
- State rank
- #27 of 39 in RI
Livability — Pascoag
- Score
- 70/100
- State rank
- #17
- US rank
- #7646
Category grades
Schools grade is shown separately in the Schools card above.
Census & demographics
- Census place
- Pascoag, RI
- Population (ZIP)
- 6,803
Population outlook (Providence County) Hauer SSP2
- Today (2025)
- 653,469 people
- By 2030
- 660,819 · +1.1%
- By 2040
- 672,747 · +3.0%
- By 2050
- 683,741 · +4.6%
- By 2075
- 720,435 · +10.2%
- By 2100
- 741,582 · +13.5%
Race, ethnicity, and origin ACS 2023
- Neighborhood character
- Predominantly White (88%)
- Race & ethnicity
- White 88% Hispanic / Latino 8% Two or more races 2% Asian 1%
- Hispanic origin (detail)
- Dominican 5%
- Common ancestry
- Lithuanian 16% Russian 4% Romanian 3%
- Foreign-born
- 8% · Canada
- Languages at home
- 90% English-only · Spanish 9% French/Haitian/Cajun 1%
Political lean MEDSL · Providence
- 2024 margin
- D (+14.4) · D 56.1% · R 41.7% · Other 2.2%
- 2008→2024 swing
- -20.0pp toward R · 2008: 34.4pp · 2024: 14.4pp
- All cycles
- 2024: D+14.4 2020: D+22.9 2016: D+21.2 2012: D+34.9 2008: D+34.4
Not yet ingested
- Civics
- —
Market trends
- HPI YoY
- ▲ 15.22%
- Current HPI
- 330.7456
- Rent YoY
- —
- Metro
- —
- State GDP YoY
- ▲ 2.25%
- F500 in state
- 10
Industry mix (Fortune 500 HQ in RI)
| Industry | F500 HQs | Revenue |
|---|---|---|
| Healthcare | 1 | $373B |
|
||
| Food Distribution | 1 | $31B |
|
||
| Aerospace / Defense | 1 | $14B |
|
||
| Financial Services | 1 | $8B |
|
||
| Consumer Goods | 1 | $4B |
|
||
Price history
3 events — show timeline
- 2026-03-19 Pending — RIS
- 2026-03-18 Price Changed $269,900 RIS
- 2026-03-18 Listed $269 RIS
Property tax history
+0.7%/yrLatest (2025): $2,321 · +4.1% YoY. Source: county tax records.
Cash-flow waterfall
monthlySold comps — $/sqft
last 12 mo · ≤1 miLoading sold comps…