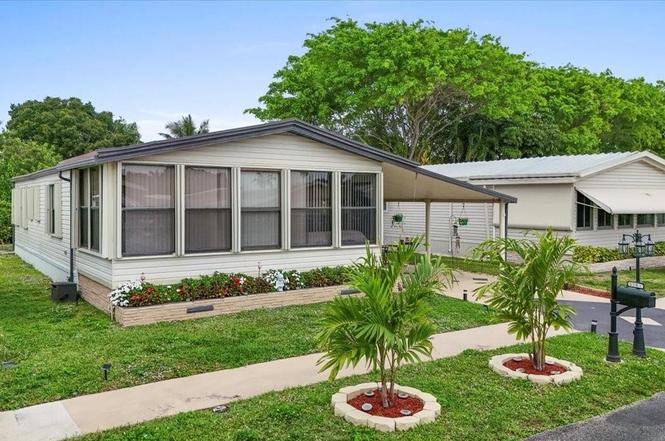
5343 NW 4th Ter · Deerfield Beach, FL
Flood risk 1/10 · Minimal
- FEMA flood zone
- AH
- Chance of flooding over 30 yrs
- 0.0%
- Est. flood insurance / yr
- $1,142 – $2,507
Fire risk 1/10 · Minimal
- Est. fire insurance / yr
- $947 – $1,759
Heat risk 9/10 · Severe
- Hot days now (above 107°F)
- 7 days/yr
- Hot days in 30 yrs
- 26 days/yr
Wind risk 10/10 · Severe
- Chance of severe wind over 30 yrs
- 99.0%
Air-quality risk 2/10 · Minimal
- Unhealthy air days now
- 1 days/yr
- Unhealthy air days in 30 yrs
- 3 days/yr
Risk factors via First Street. Map © Google.
Why this score? — see what drove the C+ grade
The composite is a weighted blend of 9 inputs, each scored 0–100. Each bar is that input's sub-score; the figure is the points it added to the 100-point composite (weight × sub-score).
- Cash flow +27.3/30.0
- DSCR +9.5/10.0
- 1% rule +8.1/10.0
- Schools +4.1/10.0
- Livability +3.8/5.0
- ARV discount +3.7/15.0
- Rent growth +2.9/5.0
- Condition / age +2.5/5.0
- Appreciation +0.0/10.0
$179,900
🖨 Deal sheet (PDF) 📄 Offer letter ✓ Due diligence
Listing remarks
CONVENTIONAL , VA, FHA FINANCING AVAILABLE * * * REDUCED * * * MANUFACTURED HOME LOCATED IN AN ADULT, GATED COMMUNITY, OWN YOUR LAND!! NO LOT RENT!!! THIS HOME INCLUDES NEW TIE DOWNS, STABILIZER AND SKIRTING, ACCORDION SHUTTERS, NEW APPLIANCES & FIXTURES, FRESH PAINT, A/C 2020, * COMMUNITY CLUBHOUSE, HEATED POOL, TENNIS, PICKLE BALL, SHUFFLEBOARD, SOCIAL ACTIVITIES AND MORE. CONVENIENTLY LOCATED NEAR SHOPPING AND RESTAURANTS, MAJOR ROADS AND THE BEACH. SOLD AS-IS WITH RIGHT TO INSPECT. QUARTERLY MAINTENANCE FEE ONLY $385.
Key facts
- 3,660 sq ft lot
- 2 parking spots
- Built 1985
Property features AI
Finance
- Other: Private road maintained by association
- Financial info: Pets allowed with breed restrictions
- HOA & community: Community association: HIGHLAND MEADOWS ESTATES WEST; Quarterly HOA fee ($385/monthly equivalent); Association includes security, trash, common areas and recreation facilities; Community amenities: Clubhouse, heated pool, tennis courts, pickleball courts, putting green, gated; Senior community
Exterior
- Parking: Attached carport (2 covered spaces); Driveway; Total parking for 2 vehicles
- Security: Gated community (no guard)
- Utilities: Public water; Public sewer; Water connected; Electricity available; Cable available
- Home design: Mobile home (double wide); One story; First-floor entry; Model: FUQUA; Faces west
- Construction: Mobile home remains on site; Approx. 40 ft by 24 ft; Other construction materials; Other roof; Skirting: Other
- Exterior features: Shed(s); Private paved road frontage; Not waterfront
Interior
- Kitchen: Dishwasher; Disposal; Electric range; Microwave; Refrigerator
- Bedrooms: 2 bedrooms on the main level (stacked layout)
- Flooring: Ceramic tile; Laminate; Tile; Wood
- Bathrooms: 2 full bathrooms on the main level
- Heating & cooling: Electric heating; Central air conditioning; Ceiling fan(s)
- Interior features: Stacked bedroom layout; Partially furnished
- Laundry & utility: Washer hookup; Electric dryer hookup; Laundry located in carport; Electric water heater
Neighborhood map
What this means for you Summary
Snapshot
- This is a 2-bed/2.0-bath manufactured listed at $180k.
Deal economics
- At list price, monthly cash flow is $371 ($4k/yr) — positive.
- The deal already cash-flows at list — no discount required.
- Meets the 1% rule at list price ($2k rent vs $180k).
- Recommended offer: $164k (9.0% below list) — sets the bar for market timing.
- Cap rate 9.8% vs local median 4.1% in Deerfield Beach — top-decile yield for the area; either an underpriced asset or a hidden risk that comps aren't pricing in. Stress-test before assuming the spread holds.
Location & tenants
- Location reads 75/100 on livability (#250 in FL, #3,970 nationally) — a middle-class / working-renter tenant base. Strengths: housing A+, health & safety A+, cost of living A; Watch: amenities D-, employment D-.
- Broward (suburban): math 42% / reading 53% proficiency, ranked #46 of 73 in FL (top 63%) — families likely to look elsewhere, expect single-tenant / working-renter base with shorter leases.
- Zoned schools: Park Ridge Elementary School (math 26% / reading 24%, grade F, #2,030 of 2,144 statewide, top 95%, 577 students, 79% FRL); Lyons Creek Middle School (math 49% / reading 53%, grade C, #237 of 571 statewide, top 43%, 1,757 students, 60% FRL); Deerfield Beach High School (math 12% / reading 37%, grade F, #505 of 667 statewide, top 79%, 2,251 students, 69% FRL) — zoned schools average 69% FRL vs 51% district-wide (18 pts higher); higher-poverty schools than district average — tighter screening recommended.
- Zoned-school proficiency averages 34% at this address vs 48% district-wide (-14 pts) — the specific schools serving this property underperform the Broward average; the district grade overstates school quality for this exact location.
- Market conditions: Rents rising (+1.8%/yr); 595 active listings in the ZIP; 40 comparable units currently listed for rent nearby; rentals at typical pace (median 26d on market — plan ~3-4 weeks tenant-placement turnaround); 2,111 units permitted in Broward County in 2024 (1,265 in 5+ unit buildings).
Forward outlook
- Local home prices are declining (-3.0%/yr); year-one equity from $1k of loan paydown is wiped out by about $5k of value loss. Plan a longer hold.
- Broward County population projected at +34% by 2050 — long-run rental-demand tailwind backs the buy-and-hold thesis.
Negotiation context
- It's been on market 102 days — a 9% lower offer ($164k) is reasonable based on typical stale-listing flexibility.
- 4 sale attempts; this cycle's ask is 7096% above the opening price — seller raised mid-cycle; expect resistance to lowballs.
- Current owner paid $149k; 21% above their basis — modest negotiation headroom, anchor on the comps not their cost.
Risks & watch-outs
- Watch-outs: flood insurance adds $152/mo.
- Climate carrying-cost: in FEMA flood zone AH (mandatory federal flood insurance); severe wind risk, 99% chance of damaging wind over 30y; extreme-heat days projected 7→26/yr by 2055 (HVAC capex compounding) — expect insurance premiums to compound above CPI over the hold.
Questions for the listing agent
- It's been on market 102 days. Have you received any prior offers? Is the seller open to a 9% concession, seller financing, or rate buy-down credit?
- What's the actual annual flood-insurance premium (NFIP or private), and is the property in a SFHA with mandatory coverage?
- What does the HOA fee cover, when was the last increase, and are there any pending special assessments or reserve-fund shortfalls?
- Why hasn't it sold? Are there any deal-killer items the seller is aware of (foundation, flood, title, zoning, code violations)?
- Is there a deadline driving the sale (1031 exchange, divorce, estate, relocation)? That informs how much negotiation room exists.
- Schools are D-rated, which usually means shorter tenancies and higher turnover. Who's the typical renter profile here, and what's been the actual vacancy rate?
- What's the average days-on-market for RENTAL listings here right now (not sales)? A rising rental-DOM trend means longer vacancies and softer asking-rent achievability than the comps imply.
- What's the recent tenant-quality profile in this submarket — average credit score on applications, eviction rate, late-payment / NSF rate, and stable-employment percentage? A property-management company in the area should have these aggregated.
- How much new for-sale + rental construction is in the pipeline within 1–3 miles? Heavy new supply typically softens prices + rents 12–24 months out; constrained supply supports both.
Investment metrics
- 1% rule
- 1.31% ✓
- Cap rate
- 9.78%
- Cash-on-cash
- 12.46%
- DSCR
- 1.55
- GRM
- 6.4
CMA / ARV
- ARV (on-the-fly)
- $166,002
- Comps found
- 3
Show comp detail 3 sales within ~0.75 mi
| Address | Dist | Beds/Ba | Sqft | Sold | Price | $/sf | Match |
|---|---|---|---|---|---|---|---|
| 5279 NW 4th Ter | 0.05mi | 2/2.0 | 1,196 (+5%) | 3mo | $175,000 | $146 | 87 |
| 261 NW 53rd Ct | 0.14mi | 2/2.0 | 1,300 (+14%) | 2mo | $210,000 | $162 | 68 |
| 303 NW 50th St | 0.28mi | 2/2.0 | 1,152 (+1%) | 21mo | $79,000 | $69 | 67 |
Match score weights: distance 35% · size 25% · config 20% · recency 20%. Top-matched comps best support the ARV.
Projected returns pro-forma
-3.0% appreciation · 1.75% rent growth · sell at horizon
- IRR
- -4.5%
- Equity multiple
- 0.84×
- Total profit
- $-8,263
- Equity at exit
- $26,824
- IRR
- 3.6%
- Equity multiple
- 1.24×
- Total profit
- $12,273
- Equity at exit
- $15,554
Cash invested: $50,372 (down + closing). Projections, not guarantees.
Landlord ↔ Tenant lean methodology
- Overall (STATE)
- 87 Strongly Landlord-Friendly
- State Florida
- 87 Strongly Landlord-Friendly · R+3
- County
- — inherits STATE
- City
- — inherits STATE
ZIP-level market 33064
- Home prices YoY
- -18.7%
- Rents YoY
- 1.8%
- Active inventory
- 595
- Price-to-rent
- 6.4×
Monthly cashflow live
- Estimated rent
- $2,359 high interval (Pro) →
- Mortgage (P&I)
- −$943
- Tax from tax record
- −$195 /mo · $2,334/yr
- Insurance
- −$75
- Flood insurance flood zone
- −$152 /mo · $1,824/yr
- HOA
- −$128
- Vacancy / Maint / Mgmt
- −$495
- Net cashflow
- $371
Break-even live
Sensitivity live
| Price | -10% $473 | -5% $422 | +0% $371 | +5% $320 | +10% $269 |
|---|---|---|---|---|---|
| Rent | -10% $185 | -5% $278 | +0% $371 | +5% $464 | +10% $557 |
| Rate | -1.0pp $462 | -0.5pp $417 | base $371 | +0.5pp $324 | +1.0pp $277 |
UW: 25.0% down · 7.5% · 30yr · 1.5% tax · 5.0% vac · 8.0% maint · 8.0% mgmt
Financing live
Cash to close
- Down payment
- $44,975
- Closing costs
- $5,397
- Reserves months
- —
- Total cash needed
- —
Loan-product check · same deal, 3 products live
Conventional
25% down · 7.5% · 30yr
- Down + closing
- —
- Monthly P&I
- —
- Monthly cashflow
- —
- DSCR
- —
- Eligible?
- —
Personal DTI + credit; lowest rate.
DSCR
20% down · 8.5% · 30yr
- Down + closing
- —
- Monthly P&I
- —
- Monthly cashflow
- —
- DSCR
- —
- Eligible?
- —
No personal income docs; deal must DSCR.
Hard money
10% down · 12.0% · 12mo
- Down + closing
- —
- Monthly P&I
- —
- Monthly cashflow
- —
- DSCR
- —
- Eligible?
- —
Short-term bridge; refi at stabilization.
Rent comps 40 comps
| Address | Beds | Baths | Sqft | Rent | $/sqft | DOM | Units | Dist |
|---|---|---|---|---|---|---|---|---|
| 1929 SW 15th St #41 Deerfield Beach, FL | 2.0 | 2.0 | 1150 | $2,400 | $2.09 | 26d | 1 | 0.15mi |
| 2067 SW 15th St Deerfield Beach, FL | 2.0 | 2.0 | 1150 | $2,300 | $2.00 | 22d | 2 | 0.23mi |
| 2297 SW 15th St #122 Deerfield Beach, FL | 2.0 | 2.0 | 1200 | $2,200 | $1.83 | 14d | 1 | 0.33mi |
| 1250 S Military Trl #1612 Deerfield Beach, FL | 2.0 | 1.5 | 1035 | $2,500 | $2.42 | 7d | 1 | 0.34mi |
| 1234 S Military Trl #1811 Deerfield Beach, FL | 2.0 | 2.0 | 1099 | $2,500 | $2.27 | 26d | 1 | 0.34mi |
| 1244 S Military Trl #724 Deerfield Beach, FL | 2.0 | 1.5 | 916 | $1,950 | $2.13 | 15d | 1 | 0.34mi |
| 1230 S Military Trl #2014 Deerfield Beach, FL | 2.0 | 2.0 | 937 | $2,400 | $2.56 | 26d | 1 | 0.35mi |
| 1230 S Military Trl #2014 Deerfield Beach, FL | 2.0 | 2.0 | 937 | $2,400 | $2.56 | 18d | 1 | 0.35mi |
| 1947 Discovery Cir E Deerfield Beach, FL | 2.0 | 2.0 | 1126 | $2,450 | $2.18 | 26d | 1 | 0.36mi |
| 2265 SW 15th St #165 Deerfield Beach, FL | 3.0 | 2.0 | 1350 | $2,400 | $1.78 | 26d | 1 | 0.36mi |
| 1266 S Military Trl Deerfield Beach, FL | 1.0–2.0 | 1.0–2.0 | 1050 | $2,550 | $2.43 | 23d | 2 | 0.36mi |
| 2246 Discovery Cir W Deerfield Beach, FL | 2.0 | 2.5 | 1300 | $2,650 | $2.04 | 26d | 1 | 0.39mi |
| 1272 S Military Trl #313 Deerfield Beach, FL | 2.0 | 2.0 | 900 | $2,390 | $2.66 | 23d | 1 | 0.40mi |
| 2355 SW 15th St Deerfield Beach, FL | 2.0 | 2.0 | 1100 | $2,098 | $1.91 | 26d | 2 | 0.42mi |
| 2217 Discovery Cir W Deerfield Beach, FL | 2.0 | 2.5 | 1429 | $2,400 | $1.68 | 16d | 1 | 0.43mi |
| 640 Cypress Club Way Unit G Pompano Beach, FL | 2.0 | 2.0 | 891 | $1,950 | $2.19 | 26d | 1 | 0.43mi |
| 2149 Discovery Cir W Unit 1 Deerfield Beach, FL | 2.0 | 2.5 | 1300 | $2,850 | $2.19 | 23d | 1 | 0.45mi |
| 1100 S Military Trl Deerfield Beach, FL | 2.0–3.0 | 1.0–2.0 | 1119 | $2,250 | $2.01 | 26d | 2 | 0.49mi |
| 2173 Discovery Cir W Deerfield Beach, FL | 2.0 | 2.0 | 1126 | $2,950 | $2.62 | 4d | 1 | 0.49mi |
| 800 Cypress Park Way Unit M Pompano Beach, FL | 2.0 | 2.0 | 807 | $2,000 | $2.48 | 3d | 1 | 0.51mi |
| 800 Cypress Park Way Unit F1 Deerfield Beach, FL | 2.0 | 2.0 | 807 | $2,000 | $2.48 | 26d | 1 | 0.51mi |
| 671 Cypress Lake Blvd Unit D21 Deerfield Beach, FL | 3.0 | 2.0 | 974 | $2,250 | $2.31 | 13d | 1 | 0.51mi |
| 631 Cypress Lake Blvd Unit O17 Deerfield Beach, FL | 2.0 | 2.0 | 807 | $2,100 | $2.60 | 26d | 1 | 0.52mi |
| 631 Cypress Lake Blvd Unit P17 Deerfield Beach, FL | 2.0 | 2.0 | 807 | $1,950 | $2.42 | 13d | 1 | 0.52mi |
| 840 Cypress Park Way Unit N3 Deerfield Beach, FL | 2.0 | 2.0 | 807 | $1,950 | $2.42 | 0d | 1 | 0.52mi |
| 661 Cypress Lake Blvd Unit I20 Deerfield Beach, FL | 3.0 | 2.0 | 974 | $2,250 | $2.31 | 3d | 1 | 0.55mi |
| 661 Cypress Lake Blvd Unit I20 Deerfield Beach, FL | 3.0 | 2.0 | 974 | $2,300 | $2.36 | 26d | 1 | 0.55mi |
| 551 NW 46th St Deerfield Beach, FL | 2.0 | 2.0 | 952 | $2,485 | $2.61 | 26d | 1 | 0.59mi |
| 616 NW 47th St Deerfield Beach, FL | 2.0 | 2.0 | 793 | $2,495 | $3.15 | 6d | 1 | 0.60mi |
| 624 NW 47th St Deerfield Beach, FL | 2.0 | 2.0 | 793 | $2,100 | $2.65 | 16d | 1 | 0.60mi |
| 4503 NW 6th Ave Deerfield Beach, FL | 3.0 | 2.0 | 1148 | $2,850 | $2.48 | 26d | 1 | 0.62mi |
| 5161 NW 11th Ln Deerfield Beach, FL | 3.0 | 2.0 | 1486 | $2,925 | $1.97 | 26d | 1 | 0.63mi |
| 4905 NE 2nd Way Pompano Beach, FL | 2.0 | 1.0 | 1100 | $2,150 | $1.95 | 26d | 1 | 0.63mi |
| 5140 NW 11th Dr Deerfield Beach, FL | 3.0 | 2.0 | 1324 | $3,000 | $2.27 | 15d | 1 | 0.66mi |
| 329 Farnham P #329 Deerfield Beach, FL | 1.0 | 1.5 | 700 | $1,450 | $2.07 | 26d | 1 | 0.67mi |
| 333 Farnham P Unit P Deerfield Beach, FL | 2.0 | 1.5 | 828 | $1,800 | $2.17 | 22d | 1 | 0.67mi |
| 137 Farnham F #137 Deerfield Beach, FL | 1.0 | 1.5 | 700 | $2,500 | $3.57 | 26d | 1 | 0.69mi |
| 4740 NE 2nd Ter Deerfield Beach, FL | 3.0 | 2.0 | 1000 | $3,250 | $3.25 | 26d | 1 | 0.69mi |
| 4740 NE 2nd Ter Deerfield Beach, FL | 3.0 | 2.0 | 1000 | $3,250 | $3.25 | 5d | 1 | 0.69mi |
| 144 Farnham F Unit F Deerfield Beach, FL | 2.0 | 1.5 | 828 | $2,500 | $3.02 | 26d | 1 | 0.71mi |
HOA detail
- Monthly dues
- $128 · $1,536/yr
- Likely covers
- poolsecurity
Listing history 21 events
-
2026-06-21days on market $179,900 Active 102 DOM
-
2026-06-18days on market $179,900 Active 99 DOM
-
2026-06-17days on market $179,900 Active 98 DOM
-
2026-06-16days on market $179,900 Active 97 DOM
-
2026-06-15days on market $179,900 Active 96 DOM
-
2026-06-13days on market $179,900 Active 94 DOM
-
2026-06-09days on market $179,900 Active 90 DOM
-
2026-06-07days on market $179,900 Active 88 DOM
-
2026-06-04days on market $179,900 Active 85 DOM
-
2026-06-03days on market $179,900 Active 84 DOM
-
2026-06-02days on market $179,900 Active 83 DOM
-
2026-06-01days on market $179,900 Active 82 DOM
-
2026-05-31days on market $179,900 Active 81 DOM
-
2026-04-17price $179,900
-
2026-04-13status Active
-
2026-03-11Active Under Contract
-
2025-09-17historical $2,500
-
2025-09-03$2,500
-
2025-02-20$189,900
-
2024-08-09soldstatus $149,000
-
1985-05-01soldstatus $25,000
ⓘ Source: listings_history table (triggers on properties + properties_extension) + one-shot
backfill from property_details.listing_events for pre-trigger history.
Tax reassessment forecast FL · Resets to sale price
- Current annual tax
- $2,334 · $195/mo
- Projected year-2 tax
- $2,334 · $195/mo
- Expected delta
- $0/yr ($0/mo · 0.0%)
ⓘ Screening estimate from a state-policy table — verify with the county assessor before closing.
Climate risk First Street
- Flood 1/10 Low FEMA zone AH · 0% chance over 30 yrs
- Wildfire 1/10 Low
- Heat 9/10 Extreme 7 d/yr ≥107°F today · 26 d/yr by 30 yrs out
- Wind 10/10 Extreme 99% chance of damaging wind over 30 yrs
- Air quality 2/10 Low 1 unhealthy d/yr today · 3 by 30 yrs out
Nearby sold comps map
Loading sold comps map…
Walkable amenities ~0.75 mi
Loading nearby amenities…
Taxation est. · year 1
- Rental income
- $28,314
- − Mortgage interest
- −$10,077
- − Property taxes
- −$2,334
- − Insurance
- −$2,724
- − Repairs & maintenance
- −$2,265
- − Management
- −$2,265
- − HOA
- −$1,536
- − Depreciation
- −$5,233
- Taxable income
- $1,878
- Est. tax owed @ 24.0%
- −$451
- After-tax cash flow
- $4,002/yr
For passive investors: Depreciation is non-cash, so a rental often shows a tax loss while cash-flowing — sheltering income. Rental losses are passive: they offset passive income freely, and up to $25,000/yr can offset ordinary (W-2) income if you actively participate and your MAGI is under $100k (phasing out to $0 by $150k); unused losses carry forward. On sale, claimed depreciation is recaptured at up to 25%, and gains may owe capital-gains tax (a 1031 exchange can defer both). Figures are a year-1 estimate at your 24.0% rate — not tax advice; consult a CPA.
Schools (NCES district)
- District
- Broward
- NCES district ID
- 1200180
- Math proficiency
- 42% ▼ -18.00%
- Reading proficiency
- 53% ▼ -5.00%
- Median HH income
- $52,139
- Composite
- 40.88/100
- National rank
- #3621
- State rank
- #46 of 73 in FL
Livability — Deerfield Beach
- Score
- 75/100
- State rank
- #250
- US rank
- #3970
Category grades
Schools grade is shown separately in the Schools card above.
Census & demographics
- Census place
- Deerfield Beach, FL
- County
- Broward County · 1,963,430 people
- City population
- 61,449
- Metro
- Miami-Fort Lauderdale-Pompano Beach, FL
- Population (ZIP)
- 64,563
- Household income
- $71,301
- Rent vs Own
- Severe rent burden
- 2907.0
Population outlook (Broward County) Hauer SSP2
- Today (2025)
- 2,207,033 people
- By 2030
- 2,360,704 · +7.0%
- By 2040
- 2,661,208 · +20.6%
- By 2050
- 2,946,698 · +33.5%
- By 2075
- 3,602,273 · +63.2%
- By 2100
- 3,970,984 · +79.9%
Race, ethnicity, and origin ACS 2023
- Neighborhood character
- Highly diverse neighborhood (Simpson 0.75)
- Race & ethnicity
- White 34% Hispanic / Latino 27% Black 25% Two or more races 24% Asian 2%
- Hispanic origin (detail)
- Mexican 4% Puerto Rican 4% Cuban 4% Dominican 2%
- Common ancestry
- Hispanic 13% Estonian 10% Romanian 1%
- Foreign-born
- 43% · Canada, Jamaica, Dominican Republic
- Languages at home
- 45% English-only · Spanish 23% French/Haitian/Cajun 16% Other Indo-European 13%
Political lean MEDSL · Broward
- 2024 margin
- D (+17.0) · D 58.0% · R 41.0%
- 2008→2024 swing
- -17.8pp toward R · 2008: 34.7pp · 2024: 17.0pp
- All cycles
- 2024: D+17.0 2020: D+29.8 2016: D+35.0 2012: D+34.9 2008: D+34.7
Not yet ingested
- Civics
- —
Market trends
- HPI YoY
- ▼ -109.09%
- Current HPI
- 474.7007
- Rent YoY
- ▲ 1.75%
- Metro
- Miami-Fort Lauderdale-Pompano Beach, FL
- State GDP YoY
- ▲ 3.28%
- F500 in state
- 36
Industry mix (Fortune 500 HQ in FL)
| Industry | F500 HQs | Revenue |
|---|---|---|
| Industrial Technology | 2 | $29B |
|
||
| Insurance | 2 | $17B |
|
||
| Retail | 1 | $60B |
|
||
| Technology Distribution | 1 | $58B |
|
||
| Homebuilding | 1 | $35B |
|
||
| Technology Manufacturing | 1 | $35B |
|
||
Price history
+619.6% since first listed8 events — show timeline
- 2026-04-17 Price Changed $179,900 Beaches MLS
- 2026-04-13 Relisted — Beaches MLS
- 2026-03-11 Listed — Beaches MLS
- 2025-09-17 Rental Removed $2,500 GFLMLS
- 2025-09-03 Listed for Rent $2,500 GFLMLS
- 2025-02-20 Listed $189,900 Beaches MLS
- 2024-08-09 Sold (Public Records) $149,000 Public Records
- 1985-05-01 Sold (Public Records) $25,000 Public Records
Property tax history
+8.8%/yrLatest (2025): $2,334 · -25.4% YoY. Source: county tax records.
Cash-flow waterfall
monthlySold comps — $/sqft
last 12 mo · ≤1 miLoading sold comps…