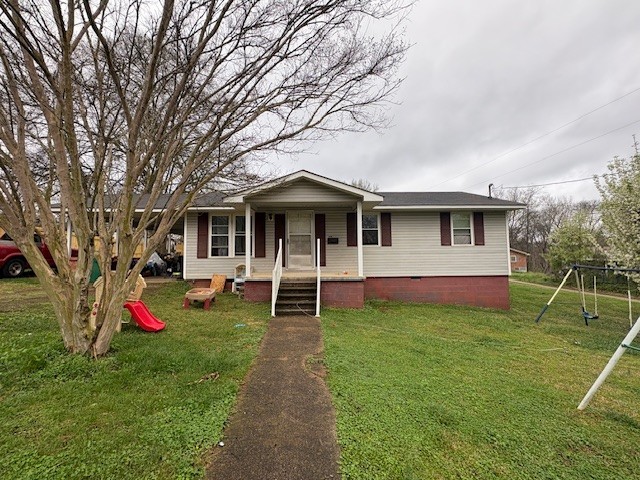
1011 Massengill St · Winchester, TN
Flood risk 1/10 · Minimal
- FEMA flood zone
- X (unshaded)
- Chance of flooding over 30 yrs
- 0.0%
- Est. flood insurance / yr
- $507 – $1,088
Fire risk 1/10 · Minimal
- Est. fire insurance / yr
- $949 – $1,763
Heat risk 5/10 · Moderate
- Hot days now (above 104°F)
- 7 days/yr
- Hot days in 30 yrs
- 20 days/yr
Wind risk 4/10 · Minor
- Chance of severe wind over 30 yrs
- 14.0%
Air-quality risk 2/10 · Minimal
- Unhealthy air days now
- 2 days/yr
- Unhealthy air days in 30 yrs
- 2 days/yr
Risk factors via First Street. Map © Google.
Why this score? — see what drove the B- grade
The composite is a weighted blend of 9 inputs, each scored 0–100. Each bar is that input's sub-score; the figure is the points it added to the 100-point composite (weight × sub-score).
- Cash flow +26.7/30.0
- ARV discount +14.7/15.0
- DSCR +9.1/10.0
- 1% rule +5.9/10.0
- Livability +3.2/5.0
- Rent growth +2.5/5.0
- Condition / age +2.5/5.0
- Schools +1.7/10.0
- Appreciation +0.0/10.0
$199,900
🖨 Deal sheet (PDF) 📄 Offer letter ✓ Due diligence
Listing remarks
Great started home or Investment property (currently rented. ) Cute little 3 bedroom/2 bath home with bonus room that could even serve as a 4th bedroom. Located within walking distance of Tim's Ford Lake and just minutes from Downtown Winchester!
Key facts
- Bonus room
- 0.26 acre lot
- Parking
Tags
Property features AI
Exterior
- Parking: Attached parking; Carport with 1 covered space (total 1 parking space)
- Utilities: Public water; Public sewer; Water available
- Home design: Single-family residence; One-story
- Construction: Vinyl siding; Existing structure
- Exterior features: Lot roughly 0.26 acres (approx. dimensions 97 x 115 irregular)
Interior
- Kitchen: Electric oven
- Bedrooms: 3 bedrooms (all on the main level)
- Flooring: Wood flooring; Vinyl flooring
- Bathrooms: 2 full bathrooms
- Heating & cooling: Wall furnace heating; Wall/window air conditioning units
- Interior features: Electric oven; Crawl space
Neighborhood map
What this means for you Summary
Snapshot
- This is a 3-bed/1.0-bath single-family listed at $200k.
Deal economics
- At list price, monthly cash flow is $538 ($6k/yr) — positive.
- The deal already cash-flows at list — no discount required.
- Meets the 1% rule at list price ($2k rent vs $200k).
- Recommended offer: $188k (6.0% below list) — sets the bar for market timing.
- Cap rate 9.5% vs local median 3.2% in Winchester — top-decile yield for the area; either an underpriced asset or a hidden risk that comps aren't pricing in. Stress-test before assuming the spread holds.
Location & tenants
- Location reads 65/100 on livability (#149 in TN) — a middle-class / working-renter tenant base. Strengths: cost of living A+, housing A+; Watch: employment C-, crime D, amenities D-.
- Franklin County (town): math 18% / reading 22% proficiency, ranked #111 of 139 in TN (top 80%) — low school quality limits family demand, transient renter base, plan for 1-2y turnover.
- Zoned schools: Clark Memorial School (math 14% / reading 27%, grade F, #637 of 952 statewide, top 68%, 489 students, 0% FRL); North Middle School (math 13% / reading 19%, grade F, #223 of 333 statewide, top 68%, 587 students, 0% FRL); Franklin Co High School (math 5% / reading 22%, grade F, #255 of 332 statewide, top 77%, 1,180 students, 0% FRL) — zoned schools average 0% FRL vs 48% district-wide (48 pts lower); this property's tenant base skews higher-income than the district average.
- Market conditions: 325 active listings in the ZIP; 422 units permitted in Franklin County in 2024 (5 in 5+ unit buildings).
Forward outlook
- Local home prices are declining (-3.0%/yr); year-one equity from $1k of loan paydown is wiped out by about $6k of value loss. Plan a longer hold.
- Franklin County population projected at +6% by 2050 — modest demand growth; plan on rents tracking national, not racing it.
- At projected returns (-3.0% appreciation + 3.0% rent growth), your $56k cash investment doubles in ~10 years — after that, you're playing with house money.
Negotiation context
- It's been on market 84 days — a 6% lower offer ($188k) is reasonable based on typical stale-listing flexibility.
- 2 sale attempts with the ask held roughly flat each time — persistent listings suggest the price (not the market) is what's stuck; bring a comps-based counter.
- Current owner paid $126k; list at $200k implies a 59% gain — meaningful room to come down on a strong offer.
Risks & watch-outs
- Climate carrying-cost: extreme-heat days projected 7→20/yr by 2055 (HVAC capex compounding) — expect insurance premiums to compound above CPI over the hold.
Questions for the listing agent
- It's been on market 84 days. Have you received any prior offers? Is the seller open to a 6% concession, seller financing, or rate buy-down credit?
- Built in 1969 — when were the roof, HVAC, electrical panel, plumbing, and water heater last replaced?
- Why hasn't it sold? Are there any deal-killer items the seller is aware of (foundation, flood, title, zoning, code violations)?
- Is there a deadline driving the sale (1031 exchange, divorce, estate, relocation)? That informs how much negotiation room exists.
- Schools are F-rated, which usually means shorter tenancies and higher turnover. Who's the typical renter profile here, and what's been the actual vacancy rate?
- Crime grade is D in this area — have there been break-ins, vandalism, or insurance claims at this property in the last 3 years? What carrier currently insures it and at what premium?
- What's the average days-on-market for RENTAL listings here right now (not sales)? A rising rental-DOM trend means longer vacancies and softer asking-rent achievability than the comps imply.
- What's the recent tenant-quality profile in this submarket — average credit score on applications, eviction rate, late-payment / NSF rate, and stable-employment percentage? A property-management company in the area should have these aggregated.
- How much new for-sale + rental construction is in the pipeline within 1–3 miles? Heavy new supply typically softens prices + rents 12–24 months out; constrained supply supports both.
Investment metrics
- 1% rule
- 1.09% ✓
- Cap rate
- 9.52%
- Cash-on-cash
- 11.54%
- DSCR
- 1.51
- GRM
- 7.6
CMA / ARV
- ARV (on-the-fly)
- $237,728
- Comps found
- 12
Show comp detail 12 sales within ~0.75 mi
| Address | Dist | Beds/Ba | Sqft | Sold | Price | $/sf | Match |
|---|---|---|---|---|---|---|---|
| 211 Wilson St | 0.20mi | 4/2.0 (+1) | 1,248 (-3%) | 2mo | $113,000 | $91 | 74 |
| 711 Hunt St | 0.19mi | 3/2.0 | 1,176 (-9%) | 2mo | $215,975 | $184 | 70 |
| 707 Hunt St | 0.21mi | 3/2.0 | 1,176 (-9%) | 10mo | $221,400 | $188 | 63 |
| 715 Hunt St | 0.18mi | 3/1.0 | 1,472 (+14%) | 10mo | $227,000 | $154 | 60 |
| 103 Dalewood Dr | 0.43mi | 3/1.5 | 1,120 (-13%) | 2mo | $188,000 | $168 | 54 |
| 102 Lisa Cir | 0.67mi | 3/2.0 | 1,380 (+7%) | 0mo | $294,200 | $213 | 53 |
| 114 Allen Dr | 0.72mi | 3/2.0 | 1,400 (+8%) | 1mo | $199,500 | $143 | 47 |
| 119 Highland Dr | 0.70mi | 3/1.0 | 1,433 (+11%) | 2mo | $210,000 | $147 | 47 |
| 811 Cumberland Dr | 0.64mi | 3/2.0 | 1,418 (+10%) | 4mo | $235,000 | $166 | 46 |
| 115 Highland Dr | 0.73mi | 3/2.0 | 1,356 (+5%) | 10mo | $260,000 | $192 | 46 |
| 804 Pleasant View Dr | 0.56mi | 4/2.0 (+1) | 1,148 (-11%) | 6mo | $220,000 | $192 | 41 |
| 132 Highland Dr | 0.70mi | 3/2.0 | 1,466 (+14%) | 5mo | $275,000 | $188 | 36 |
Match score weights: distance 35% · size 25% · config 20% · recency 20%. Top-matched comps best support the ARV.
Projected returns pro-forma
-3.0% appreciation · 3.0% rent growth · sell at horizon
- IRR
- 0.8%
- Equity multiple
- 1.03×
- Total profit
- $1,801
- Equity at exit
- $29,806
- IRR
- 10.4%
- Equity multiple
- 1.81×
- Total profit
- $45,365
- Equity at exit
- $17,284
Cash invested: $55,972 (down + closing). Projections, not guarantees.
Landlord ↔ Tenant lean methodology
- Overall (STATE)
- 87 Strongly Landlord-Friendly
- State Tennessee
- 87 Strongly Landlord-Friendly · R+13
- County
- — inherits STATE
- City
- — inherits STATE
ZIP-level market 37398
- Home prices YoY
- -21.1%
- Active inventory
- 325
- Price-to-rent
- 7.6×
Monthly cashflow live
- Estimated rent
- $2,188 medium interval (Pro) →
- Mortgage (P&I)
- −$1,048
- Tax from tax record
- −$59 /mo · $706/yr
- Insurance
- −$83
- HOA
- −$0
- Lot rent
- −$0
- Vacancy / Maint / Mgmt
- −$460
- Net cashflow
- $538
Break-even live
Sensitivity live
| Price | -10% $651 | -5% $595 | +0% $538 | +5% $482 | +10% $425 |
|---|---|---|---|---|---|
| Rent | -10% $365 | -5% $452 | +0% $538 | +5% $625 | +10% $711 |
| Rate | -1.0pp $639 | -0.5pp $589 | base $538 | +0.5pp $486 | +1.0pp $434 |
UW: 25.0% down · 7.5% · 30yr · 1.5% tax · 5.0% vac · 8.0% maint · 8.0% mgmt
Financing live
Cash to close
- Down payment
- $49,975
- Closing costs
- $5,997
- Reserves months
- —
- Total cash needed
- —
Loan-product check · same deal, 3 products live
Conventional
25% down · 7.5% · 30yr
- Down + closing
- —
- Monthly P&I
- —
- Monthly cashflow
- —
- DSCR
- —
- Eligible?
- —
Personal DTI + credit; lowest rate.
DSCR
20% down · 8.5% · 30yr
- Down + closing
- —
- Monthly P&I
- —
- Monthly cashflow
- —
- DSCR
- —
- Eligible?
- —
No personal income docs; deal must DSCR.
Hard money
10% down · 12.0% · 12mo
- Down + closing
- —
- Monthly P&I
- —
- Monthly cashflow
- —
- DSCR
- —
- Eligible?
- —
Short-term bridge; refi at stabilization.
Listing history 12 events
-
2026-06-08days on market $199,900 Active 84 DOM
-
2026-06-07days on market $199,900 Active 83 DOM
-
2026-06-05days on market $199,900 Active 80 DOM
-
2026-06-03days on market $199,900 Active 79 DOM
-
2026-06-02days on market $199,900 Active 78 DOM
-
2026-06-01days on market $199,900 Active 77 DOM
-
2026-05-31days on market $199,900 Active 76 DOM
-
2026-05-30days on market $199,900 Active 75 DOM
-
2026-03-16$199,900 Active
-
2026-03-04historical
-
2026-01-12$199,900 Active
-
2025-09-30soldstatus $125,500
ⓘ Source: listings_history table (triggers on properties + properties_extension) + one-shot
backfill from property_details.listing_events for pre-trigger history.
Tax reassessment forecast TN · Resets to sale price
- Current annual tax
- $706 · $59/mo
- Projected year-2 tax
- $1,419 · $118/mo
- Expected delta
- +$713/yr (+$59/mo · 101.0%)
ⓘ Screening estimate from a state-policy table — verify with the county assessor before closing.
Climate risk First Street
- Flood 1/10 Low FEMA zone X (unshaded) · 0% chance over 30 yrs
- Wildfire 1/10 Low
- Heat 5/10 Major 7 d/yr ≥104°F today · 20 d/yr by 30 yrs out
- Wind 4/10 Moderate 14% chance of damaging wind over 30 yrs
- Air quality 2/10 Low 2 unhealthy d/yr today · 2 by 30 yrs out
Nearby sold comps map
Loading sold comps map…
Walkable amenities ~0.75 mi
Loading nearby amenities…
Taxation est. · year 1
- Rental income
- $26,258
- − Mortgage interest
- −$11,198
- − Property taxes
- −$706
- − Insurance
- −$1,000
- − Repairs & maintenance
- −$2,101
- − Management
- −$2,101
- − Depreciation
- −$5,815
- Taxable income
- $3,338
- Est. tax owed @ 24.0%
- −$801
- After-tax cash flow
- $5,657/yr
For passive investors: Depreciation is non-cash, so a rental often shows a tax loss while cash-flowing — sheltering income. Rental losses are passive: they offset passive income freely, and up to $25,000/yr can offset ordinary (W-2) income if you actively participate and your MAGI is under $100k (phasing out to $0 by $150k); unused losses carry forward. On sale, claimed depreciation is recaptured at up to 25%, and gains may owe capital-gains tax (a 1031 exchange can defer both). Figures are a year-1 estimate at your 24.0% rate — not tax advice; consult a CPA.
Schools (NCES district)
- District
- Franklin County
- NCES district ID
- 4701290
- Math proficiency
- 18% ▼ -9.00%
- Reading proficiency
- 22% ▼ -8.00%
- Median HH income
- $43,108
- Composite
- 17.24/100
- National rank
- #9094
- State rank
- #111 of 139 in TN
Livability — Winchester
- Score
- 65/100
- State rank
- #149
- US rank
- #13341
Category grades
Schools grade is shown separately in the Schools card above.
Census & demographics
- Census place
- Winchester, TN
- Population (ZIP)
- 15,712
Population outlook (Franklin County) Hauer SSP2
- Today (2025)
- 42,858 people
- By 2030
- 43,540 · +1.6%
- By 2040
- 44,623 · +4.1%
- By 2050
- 45,523 · +6.2%
- By 2075
- 48,954 · +14.2%
- By 2100
- 50,170 · +17.1%
Race, ethnicity, and origin ACS 2023
- Neighborhood character
- Predominantly White (81%)
- Race & ethnicity
- White 81% Hispanic / Latino 7% Black 7% Two or more races 6% Asian 1%
- Hispanic origin (detail)
- Mexican 4%
- Common ancestry
- Serbian 2% Lithuanian 2% Slovak 1%
- Foreign-born
- 4% · Canada
- Languages at home
- 93% English-only · Spanish 5% Other Indo-European 1% German/W. Germanic 1%
Political lean MEDSL · Franklin
- 2024 margin
- Solid R (+53.2) · D 23.0% · R 76.1%
- 2008→2024 swing
- -30.6pp toward R · 2008: -22.5pp · 2024: -53.2pp
- All cycles
- 2024: R+53.2 2020: R+47.7 2016: R+43.7 2012: R+28.9 2008: R+22.5
Not yet ingested
- Civics
- —
Market trends
- HPI YoY
- ▼ -89.03%
- Current HPI
- 333.839
- Rent YoY
- —
- Metro
- —
- State GDP YoY
- ▲ 2.78%
- F500 in state
- 22
Industry mix (Fortune 500 HQ in TN)
| Industry | F500 HQs | Revenue |
|---|---|---|
| Healthcare | 3 | $91B |
|
||
| Retail | 3 | $72B |
|
||
| Transportation / Logistics | 1 | $88B |
|
||
| Paper / Packaging | 1 | $19B |
|
||
| Insurance | 1 | $13B |
|
||
| Energy | 1 | $12B |
|
||
Price history
+59.3% since first listed4 events — show timeline
- 2026-03-16 Listed $199,900 REALTRACS as Distributed by MLS Grid
- 2026-03-04 Listing Removed — REALTRACS as Distributed by MLS Grid
- 2026-01-12 Listed $199,900 REALTRACS as Distributed by MLS Grid
- 2025-09-30 Sold (Public Records) $125,500 Public Records
Property tax history
+7.2%/yrLatest (2025): $706 · +0.4% YoY. Source: county tax records.
Cash-flow waterfall
monthlySold comps — $/sqft
last 12 mo · ≤1 miLoading sold comps…