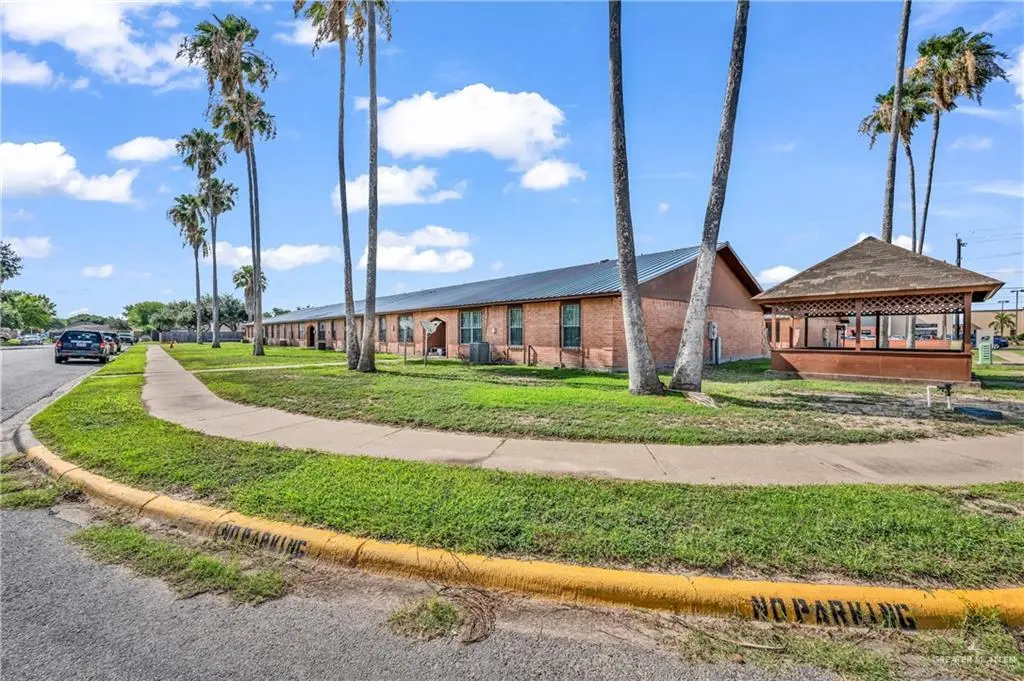
1700 E 23rd St #15 · Mission, TX
Flood risk 9/10 · Severe
- FEMA flood zone
- —
- Chance of flooding over 30 yrs
- 0.99%
- Est. flood insurance / yr
- —
Fire risk 1/10 · Minimal
- Est. fire insurance / yr
- $1,222 – $2,270
Heat risk 9/10 · Severe
- Hot days now (above 111°F)
- 7 days/yr
- Hot days in 30 yrs
- 22 days/yr
Wind risk 8/10 · Major
- Chance of severe wind over 30 yrs
- 99.0%
Air-quality risk 2/10 · Minimal
- Unhealthy air days now
- 1 days/yr
- Unhealthy air days in 30 yrs
- 2 days/yr
Risk factors via First Street. Map © Google.
Why this score? — see what drove the C grade
The composite is a weighted blend of 9 inputs, each scored 0–100. Each bar is that input's sub-score; the figure is the points it added to the 100-point composite (weight × sub-score).
- Cash flow +20.9/30.0
- 1% rule +8.0/10.0
- ARV discount +8.0/15.0
- DSCR +6.7/10.0
- Livability +3.8/5.0
- Schools +3.4/10.0
- Rent growth +2.5/5.0
- Condition / age +2.5/5.0
- Appreciation +0.0/10.0
$90,000
🖨 Deal sheet (PDF) 📄 Offer letter ✓ Due diligence
Listing remarks MLS
Your opportunity of owning a condominium that offers a blend of convenience and lifestyle benefits is here. Condos provide a low-maintenance living experience and allows residents to enjoy their living space without the hassle of yard work or external repairs. Moreover, this strategically located condo offers proximity to shopping, dining, and entertainment. Now, from an investment perspective, condos may appreciate in value, making them a potentially lucrative asset. Additionally, they can be more affordable than standalone homes, providing an entry point into homeownership for individuals or families.
Key facts
- Proximity to dining
- $125 HOA
- Built 1985
Tags
Neighborhood map
What this means for you Summary
Snapshot
- This is a 2-bed/1.0-bath condo listed at $90k.
Deal economics
- At list price, monthly cash flow is $126 ($2k/yr) — positive.
- The deal already cash-flows at list — no discount required.
- Meets the 1% rule at list price ($1k rent vs $90k).
- Recommended offer: $79k (12.0% below list) — sets the bar for market timing.
- Cap rate 8.0% vs local median 3.5% in Mission — top-decile yield for the area; either an underpriced asset or a hidden risk that comps aren't pricing in. Stress-test before assuming the spread holds.
Location & tenants
- Location reads 75/100 on livability (#148 in TX, #4,155 nationally) — a middle-class / working-renter tenant base. Strengths: cost of living A+, housing A+, health & safety A+; Watch: schools C-, amenities F, commute F.
- Sharyland ISD (urban): math 34% / reading 44% proficiency, ranked #406 of 826 in TX (top 49%) — families likely to look elsewhere, expect single-tenant / working-renter base with shorter leases.
- Market conditions: 474 active listings in the ZIP; 5 comparable units currently listed for rent nearby; rentals lingering (median 45d on market — plan ~5-8 weeks vacancy on turnover, expect pricing pressure); 100% of comp listings sitting > 30 days — soft ceiling on asking rent; 7,378 units permitted in Hidalgo County in 2024 (641 in 5+ unit buildings).
Forward outlook
- Local home prices are declining (-3.0%/yr); year-one equity from $622 of loan paydown is wiped out by about $3k of value loss. Plan a longer hold.
- Hidalgo County population projected at +28% by 2050 — long-run rental-demand tailwind backs the buy-and-hold thesis.
Negotiation context
- It's been on market 323 days — a 12% lower offer ($79k) is reasonable based on typical stale-listing flexibility.
- 2 sale attempts; this cycle's ask has dropped $29k (24%) from the opening price — seller is motivated, your offer sets the floor, not the list.
Risks & watch-outs
- Climate carrying-cost: severe flood risk; severe wind risk, 99% chance of damaging wind over 30y; extreme-heat days projected 7→22/yr by 2055 (HVAC capex compounding) — expect insurance premiums to compound above CPI over the hold.
Questions for the listing agent
- It's been on market 323 days. Have you received any prior offers? Is the seller open to a 12% concession, seller financing, or rate buy-down credit?
- What does the HOA fee cover, when was the last increase, and are there any pending special assessments or reserve-fund shortfalls?
- Any open or pending special assessments — roof, HVAC, plumbing, elevator, façade? What's the per-unit balance and payoff schedule, and is the seller paying it off at close or rolling it to the buyer?
- Why hasn't it sold? Are there any deal-killer items the seller is aware of (foundation, flood, title, zoning, code violations)?
- Is there a deadline driving the sale (1031 exchange, divorce, estate, relocation)? That informs how much negotiation room exists.
- What's the average days-on-market for RENTAL listings here right now (not sales)? A rising rental-DOM trend means longer vacancies and softer asking-rent achievability than the comps imply.
- What's the recent tenant-quality profile in this submarket — average credit score on applications, eviction rate, late-payment / NSF rate, and stable-employment percentage? A property-management company in the area should have these aggregated.
- How much new apartment / multifamily construction is in the pipeline within 1–3 miles? Heavy new supply (>2% of stock underway) typically softens rents 12–24 months out; light construction supports rent growth.
Investment metrics
- 1% rule
- 1.30% ✓
- Cap rate
- 7.97%
- Cash-on-cash
- 5.99%
- DSCR
- 1.27
- GRM
- 6.4
CMA / ARV
- ARV (median comp)
- $90,992
- List price
- $90,000
- Delta
- -1.09%
- Verdict
- FAIR
- Comps
- 5 within 1.0 mi
Projected returns pro-forma
-3.0% appreciation · 3.0% rent growth · sell at horizon
- IRR
- -6.9%
- Equity multiple
- 0.74×
- Total profit
- $-6,451
- Equity at exit
- $13,419
- IRR
- 2.9%
- Equity multiple
- 1.21×
- Total profit
- $5,206
- Equity at exit
- $7,782
Cash invested: $25,200 (down + closing). Projections, not guarantees.
Landlord ↔ Tenant lean methodology
- Overall (STATE)
- 87 Strongly Landlord-Friendly
- State Texas
- 87 Strongly Landlord-Friendly · R+5
- County
- — inherits STATE
- City
- — inherits STATE
ZIP-level market 78574
- Home prices YoY
- -16.1%
- Active inventory
- 474
- Price-to-rent
- 6.4×
Monthly cashflow live
- Estimated rent
- $1,170 high interval (Pro) →
- Mortgage (P&I)
- −$472
- Tax from tax record
- −$164 /mo · $1,968/yr
- Insurance
- −$38
- HOA
- −$125
- Vacancy / Maint / Mgmt
- −$246
- Net cashflow
- $126
Break-even live
Sensitivity live
| Price | -10% $177 | -5% $151 | +0% $126 | +5% $100 | +10% $75 |
|---|---|---|---|---|---|
| Rent | -10% $33 | -5% $80 | +0% $126 | +5% $172 | +10% $218 |
| Rate | -1.0pp $171 | -0.5pp $149 | base $126 | +0.5pp $102 | +1.0pp $79 |
UW: 25.0% down · 7.5% · 30yr · 1.5% tax · 5.0% vac · 8.0% maint · 8.0% mgmt
Financing live
Cash to close
- Down payment
- $22,500
- Closing costs
- $2,700
- Reserves months
- —
- Total cash needed
- —
Loan-product check · same deal, 3 products live
Conventional
25% down · 7.5% · 30yr
- Down + closing
- —
- Monthly P&I
- —
- Monthly cashflow
- —
- DSCR
- —
- Eligible?
- —
Personal DTI + credit; lowest rate.
DSCR
20% down · 8.5% · 30yr
- Down + closing
- —
- Monthly P&I
- —
- Monthly cashflow
- —
- DSCR
- —
- Eligible?
- —
No personal income docs; deal must DSCR.
Hard money
10% down · 12.0% · 12mo
- Down + closing
- —
- Monthly P&I
- —
- Monthly cashflow
- —
- DSCR
- —
- Eligible?
- —
Short-term bridge; refi at stabilization.
Rent comps 5 comps
| Address | Beds | Baths | Sqft | Rent | $/sqft | DOM | Units | Dist |
|---|---|---|---|---|---|---|---|---|
| 1901 N Glasscock Rd Lot 37 Mission, TX | 1.0 | 1.0 | 419 | $650 | $1.55 | 45d | 1 | 0.28mi |
| 806 Ragland Rd Unit 1 Mission, TX | 1.0 | 1.0 | 651 | $925 | $1.42 | 45d | 1 | 1.16mi |
| 800 Ragland Rd Unit 5 Mission, TX | 1.0 | 1.0 | 651 | $925 | $1.42 | 45d | 1 | 1.16mi |
| 720 Ragland Rd #6 Mission, TX | 1.0 | 1.0 | 651 | $925 | $1.42 | 45d | 1 | 1.21mi |
| 716 Ragland Rd #3 Mission, TX | 1.0 | 1.0 | 651 | $925 | $1.42 | 45d | 1 | 1.22mi |
HOA detail condo
- Monthly dues
- $125 · $1,500/yr
- Assessments
- None detected in remarks — confirm with the listing agent.
Listing history 23 events
-
2026-06-18days on market $90,000 Active 323 DOM
-
2026-06-17days on market $90,000 Active 322 DOM
-
2026-06-16days on market $90,000 Active 321 DOM
-
2026-06-15days on market $90,000 Active 320 DOM
-
2026-06-14days on market $90,000 Active 318 DOM
-
2026-06-10days on market $90,000 Active 315 DOM
-
2026-06-09days on market $90,000 Active 314 DOM
-
2026-06-08days on market $90,000 Active 313 DOM
-
2026-06-07days on market $90,000 Active 312 DOM
-
2026-06-03days on market $90,000 Active 308 DOM
-
2026-06-02days on market $90,000 Active 307 DOM
-
2026-06-01days on market $90,000 Active 306 DOM
-
2026-05-31days on market $90,000 Active 305 DOM
-
2026-05-31days on market $90,000 Active 304 DOM
-
2026-05-20price $90,000 610-char remark
Show marketing remark (610 chars)
Your opportunity of owning a condominium that offers a blend of convenience and lifestyle benefits is here. Condos provide a low-maintenance living experience and allows residents to enjoy their living space without the hassle of yard work or external repairs. Moreover, this strategically located condo offers proximity to shopping, dining, and entertainment. Now, from an investment perspective, condos may appreciate in value, making them a potentially lucrative asset. Additionally, they can be more affordable than standalone homes, providing an entry point into homeownership for individuals or families.
-
2026-04-25price $117,000 610-char remark
Show marketing remark (610 chars)
Your opportunity of owning a condominium that offers a blend of convenience and lifestyle benefits is here. Condos provide a low-maintenance living experience and allows residents to enjoy their living space without the hassle of yard work or external repairs. Moreover, this strategically located condo offers proximity to shopping, dining, and entertainment. Now, from an investment perspective, condos may appreciate in value, making them a potentially lucrative asset. Additionally, they can be more affordable than standalone homes, providing an entry point into homeownership for individuals or families.
-
2026-04-13price $117,900 610-char remark
Show marketing remark (610 chars)
Your opportunity of owning a condominium that offers a blend of convenience and lifestyle benefits is here. Condos provide a low-maintenance living experience and allows residents to enjoy their living space without the hassle of yard work or external repairs. Moreover, this strategically located condo offers proximity to shopping, dining, and entertainment. Now, from an investment perspective, condos may appreciate in value, making them a potentially lucrative asset. Additionally, they can be more affordable than standalone homes, providing an entry point into homeownership for individuals or families.
-
2026-03-10price $118,000 610-char remark
Show marketing remark (610 chars)
Your opportunity of owning a condominium that offers a blend of convenience and lifestyle benefits is here. Condos provide a low-maintenance living experience and allows residents to enjoy their living space without the hassle of yard work or external repairs. Moreover, this strategically located condo offers proximity to shopping, dining, and entertainment. Now, from an investment perspective, condos may appreciate in value, making them a potentially lucrative asset. Additionally, they can be more affordable than standalone homes, providing an entry point into homeownership for individuals or families.
-
2025-07-30$119,000 Active 610-char remark
Show marketing remark (610 chars)
Your opportunity of owning a condominium that offers a blend of convenience and lifestyle benefits is here. Condos provide a low-maintenance living experience and allows residents to enjoy their living space without the hassle of yard work or external repairs. Moreover, this strategically located condo offers proximity to shopping, dining, and entertainment. Now, from an investment perspective, condos may appreciate in value, making them a potentially lucrative asset. Additionally, they can be more affordable than standalone homes, providing an entry point into homeownership for individuals or families.
-
2025-06-29$119,900 Active
-
2025-03-19soldstatus
-
2005-10-17soldstatus
-
1986-02-18soldstatus
ⓘ Source: listings_history table (triggers on properties + properties_extension) + one-shot
backfill from property_details.listing_events for pre-trigger history.
Tax reassessment forecast TX · Resets to sale price
- Current annual tax
- $1,968 · $164/mo
- Projected year-2 tax
- $1,968 · $164/mo
- Expected delta
- $0/yr ($0/mo · 0.0%)
ⓘ Screening estimate from a state-policy table — verify with the county assessor before closing.
Climate risk First Street
- Flood 9/10 Extreme 99% chance over 30 yrs
- Wildfire 1/10 Low
- Heat 9/10 Extreme 7 d/yr ≥111°F today · 22 d/yr by 30 yrs out
- Wind 8/10 Severe 99% chance of damaging wind over 30 yrs
- Air quality 2/10 Low 1 unhealthy d/yr today · 2 by 30 yrs out
Nearby sold comps map
Loading sold comps map…
Walkable amenities ~0.75 mi
Loading nearby amenities…
Taxation est. · year 1
- Rental income
- $14,039
- − Mortgage interest
- −$5,041
- − Property taxes
- −$1,968
- − Insurance
- −$450
- − Repairs & maintenance
- −$1,123
- − Management
- −$1,123
- − HOA
- −$1,500
- − Depreciation
- −$2,618
- Taxable income
- $215
- Est. tax owed @ 24.0%
- −$52
- After-tax cash flow
- $1,457/yr
For passive investors: Depreciation is non-cash, so a rental often shows a tax loss while cash-flowing — sheltering income. Rental losses are passive: they offset passive income freely, and up to $25,000/yr can offset ordinary (W-2) income if you actively participate and your MAGI is under $100k (phasing out to $0 by $150k); unused losses carry forward. On sale, claimed depreciation is recaptured at up to 25%, and gains may owe capital-gains tax (a 1031 exchange can defer both). Figures are a year-1 estimate at your 24.0% rate — not tax advice; consult a CPA.
Schools (NCES district)
- District
- Sharyland ISD
- NCES district ID
- 4839930
- Math proficiency
- 34% ▼ -35.00%
- Reading proficiency
- 44% ▼ -15.00%
- Median HH income
- $57,792
- Composite
- 34.38/100
- National rank
- #5214
- State rank
- #406 of 826 in TX
Livability — Mission
- Score
- 75/100
- State rank
- #148
- US rank
- #4155
Category grades
Schools grade is shown separately in the Schools card above.
Census & demographics
- Census place
- Mission, TX
- County
- Hidalgo County · 623,128 people
- City population
- 78,024
- Metro
- McAllen-Edinburg-Mission, TX
- Population (ZIP)
- 62,456
- Household income
- $52,393
- Rent vs Own
- Severe rent burden
- 803.0
Population outlook (Hidalgo County) Hauer SSP2
- Today (2025)
- 955,232 people
- By 2030
- 1,009,774 · +5.7%
- By 2040
- 1,120,332 · +17.3%
- By 2050
- 1,225,036 · +28.2%
- By 2075
- 1,439,189 · +50.7%
- By 2100
- 1,533,429 · +60.5%
Race, ethnicity, and origin ACS 2023
- Neighborhood character
- Predominantly Hispanic (97%)
- Race & ethnicity
- Hispanic / Latino 97% Two or more races 62% White 2%
- Hispanic origin (detail)
- Mexican 93%
- Foreign-born
- 33% · Canada
- Languages at home
- 12% English-only · Spanish 87%
Political lean MEDSL · Hidalgo
- 2024 margin
- Toss-up / Even · D 48.1% · R 51.0%
- 2008→2024 swing
- -41.6pp toward R · 2008: 38.7pp · 2024: -2.9pp
- All cycles
- 2024: R+2.9 2020: D+17.1 2016: D+40.5 2012: D+41.8 2008: D+38.7
Not yet ingested
- Civics
- —
Market trends
- HPI YoY
- ▼ -44.13%
- Current HPI
- 230.3323
- Rent YoY
- —
- Metro
- McAllen-Edinburg-Mission, TX
- State GDP YoY
- ▲ 3.95%
- F500 in state
- 110
Industry mix (Fortune 500 HQ in TX)
| Industry | F500 HQs | Revenue |
|---|---|---|
| Energy | 16 | $1,198B |
|
||
| Technology | 5 | $198B |
|
||
| Engineering / Construction | 4 | $72B |
|
||
| Energy Services | 3 | $60B |
|
||
| Utilities | 3 | $41B |
|
||
| Healthcare | 2 | $330B |
|
||
Price history
-24.9% since first listed9 events — show timeline
- 2026-05-20 Price Changed $90,000 MCALLENMLS
- 2026-04-25 Price Changed $117,000 MCALLENMLS
- 2026-04-13 Price Changed $117,900 MCALLENMLS
- 2026-03-10 Price Changed $118,000 MCALLENMLS
- 2025-07-30 Listed $119,000 MCALLENMLS
- 2025-06-29 Listed $119,900 MCALLENMLS
- 2025-03-19 Sold (Public Records) — Public Records
- 2005-10-17 Sold (Public Records) — Public Records
- 1986-02-18 Sold (Public Records) — Public Records
Property tax history
+5.7%/yrLatest (2025): $1,968 · +82.2% YoY. Source: county tax records.
Cash-flow waterfall
monthlySold comps — $/sqft
last 12 mo · ≤1 miLoading sold comps…