3634 Sagauro Dr · Grand Prairie, TX
Flood risk No data
- FEMA flood zone
- —
- Chance of flooding over 30 yrs
- —
- Est. flood insurance / yr
- —
Fire risk No data
- Est. fire insurance / yr
- —
Heat risk No data
- Hot days now (above threshold)
- —
- Hot days in 30 yrs
- —
Wind risk No data
- Chance of severe wind over 30 yrs
- —
Air-quality risk No data
- Unhealthy air days now
- —
- Unhealthy air days in 30 yrs
- —
Risk factors via First Street. Map © Google.
Why this score? — see what drove the F grade
The composite is a weighted blend of 9 inputs, each scored 0–100. Each bar is that input's sub-score; the figure is the points it added to the 100-point composite (weight × sub-score).
- ARV discount +7.5/15.0
- Cash flow +4.4/30.0
- Livability +4.0/5.0
- Schools +2.8/10.0
- Rent growth +2.5/5.0
- Condition / age +2.5/5.0
- 1% rule +0.6/10.0
- DSCR +0.0/10.0
- Appreciation +0.0/10.0
$480,990
🖨 Deal sheet 📄 Offer letter ✓ Due diligence
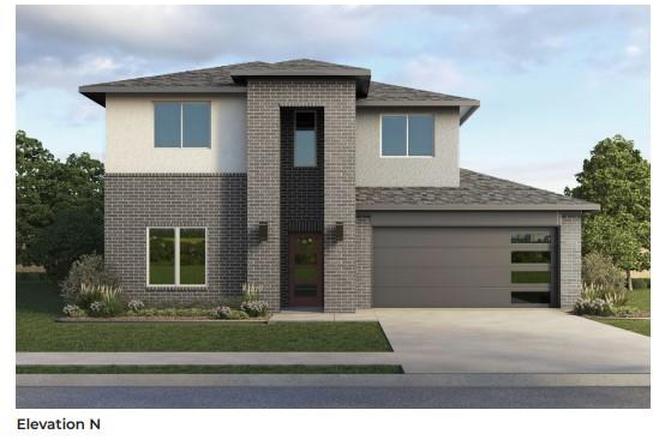
Listing remarks
Welcome to the Tangerine floor plan, a stunning 2,330 sq. ft. home located in the brand-new Preserve at Forum community in Grand Prairie. This 4-bedroom, 3-bathroom, 2-story home is designed to combine elegance, functionality, and modern living. The exterior features brick and rock accents, lush landscaping, a full irrigation system, and a charming front yard tree. Step inside to discover a spacious kitchen with 42” flat-panel cabinets, granite countertops, and stainless-steel appliances. The open-concept design allows the kitchen to overlook the living area, perfect for seamless entertaining. The living room boasts soaring 2-story ceilings, complemented by 6 large windows that flood
Key facts
- Open-concept design
- Spacious kitchen
- Granite countertops
Tags
Neighborhood map
What this means for you Summary
Snapshot
- This is a 4-bed/3.0-bath land listed at $481k.
Deal economics
- At list price, monthly cash flow is $-1k ($-15k/yr) — negative.
- To cash-flow at today's rent, offer at most $299k (37.9% below list).
- To meet the 1% rule (rent ≥ 1% of price), the offer needs to be $270k (43.9% below list).
- Recommended offer: $270k (43.9% below list) — sets the bar for 1% rule.
Location & tenants
- Location reads 80/100 on livability (#33 in TX, #1,660 nationally) — a professional / high-income tenant draw. Strengths: amenities A+, cost of living A+, housing A+; Watch: commute F.
- Grand Prairie ISD (suburban): math 29% / reading 35% proficiency, ranked #572 of 826 in TX (top 69%) — families likely to look elsewhere, expect single-tenant / working-renter base with shorter leases; 63% free/reduced lunch — lower-income household profile, screen leases tightly.
- Market conditions: Rents flat; 287 active listings in the ZIP; 22 comparable units currently listed for rent nearby; rentals lingering (median 44d on market — plan ~5-8 weeks vacancy on turnover, expect pricing pressure); 50% of comp listings sitting > 30 days — soft ceiling on asking rent; solid renter incomes; 12,577 units permitted in Dallas County in 2024 (6,829 in 5+ unit buildings).
- This rent runs 36% of the median local income ($89k/yr) — at the standard rent-burdened threshold; future hikes will face affordability resistance.
Forward outlook
- Local home prices are declining (-3.0%/yr); year-one equity from $3k of loan paydown is wiped out by about $14k of value loss. Plan a longer hold.
- Dallas County population projected at +35% by 2050 — long-run rental-demand tailwind backs the buy-and-hold thesis.
Negotiation context
- It's been on market 46 days — a 3% lower offer ($467k) is reasonable based on typical stale-listing flexibility.
Questions for the listing agent
- What do current leases actually rent for vs. the listed asking? Can we see a recent rent roll and the last 12 months of T-12 income?
- It's been on market 46 days. Have you received any prior offers? Is the seller open to a 44% concession, seller financing, or rate buy-down credit?
- What does the HOA fee cover, when was the last increase, and are there any pending special assessments or reserve-fund shortfalls?
- Is there a deadline driving the sale (1031 exchange, divorce, estate, relocation)? That informs how much negotiation room exists.
- The area grade is low — what's the realistic commute time and amenity access for the typical tenant pool here? Any planned neighborhood developments (good or bad) we should know about?
- What's the average days-on-market for RENTAL listings here right now (not sales)? A rising rental-DOM trend means longer vacancies and softer asking-rent achievability than the comps imply.
- What's the recent tenant-quality profile in this submarket — average credit score on applications, eviction rate, late-payment / NSF rate, and stable-employment percentage? A property-management company in the area should have these aggregated.
- How much new for-sale + rental construction is in the pipeline within 1–3 miles? Heavy new supply typically softens prices + rents 12–24 months out; constrained supply supports both.
Investment metrics
- 1% rule
- 0.56% ✗
- Cap rate
- 3.15%
- Cash-on-cash
- -11.21%
- DSCR
- 0.50
- GRM
- 14.8
CMA / ARV
No comps found within radius.
Projected returns pro-forma
-3.0% appreciation · 0.08% rent growth · sell at horizon
- IRR
- -40.0%
- Equity multiple
- -0.23×
- Total profit
- $-165,728
- Equity at exit
- $71,717
- IRR
- -86.0%
- Equity multiple
- -1.06×
- Total profit
- $-277,029
- Equity at exit
- $41,587
Cash invested: $134,677 (down + closing). Projections, not guarantees.
Landlord ↔ Tenant lean methodology
- Overall (STATE)
- 87 Strongly Landlord-Friendly
- State Texas
- 87 Strongly Landlord-Friendly · R+5
- County
- — inherits STATE
- City
- — inherits STATE
ZIP-level market 75052
- Home prices YoY
- -26.3%
- Rents YoY
- 0.1%
- Active inventory
- 287
- Price-to-rent
- 14.8×
Monthly cashflow live
- Estimated rent
- $2,699 high interval (Pro) →
- Mortgage (P&I)
- −$2,522
- Tax est. 1.5%
- −$601 /mo · $7,215/yr
- Insurance
- −$200
- HOA
- −$67
- Vacancy / Maint / Mgmt
- −$567
- Net cashflow
- $-1,259
Break-even live
UW: 25.0% down · 7.5% · 30yr · 1.5% tax · 5.0% vac · 8.0% maint · 8.0% mgmt
Financing live
Cash to close
- Down payment
- $120,248
- Closing costs
- $14,430
- Reserves months
- —
- Total cash needed
- —
Loan-product check · same deal, 3 products live
Conventional
25% down · 7.5% · 30yr
- Down + closing
- —
- Monthly P&I
- —
- Monthly cashflow
- —
- DSCR
- —
- Eligible?
- —
Personal DTI + credit; lowest rate.
DSCR
20% down · 8.5% · 30yr
- Down + closing
- —
- Monthly P&I
- —
- Monthly cashflow
- —
- DSCR
- —
- Eligible?
- —
No personal income docs; deal must DSCR.
Hard money
10% down · 12.0% · 12mo
- Down + closing
- —
- Monthly P&I
- —
- Monthly cashflow
- —
- DSCR
- —
- Eligible?
- —
Short-term bridge; refi at stabilization.
Rent comps 22 comps
| Address | Beds | Baths | Sqft | Rent | $/sqft | DOM | Units | Dist |
|---|---|---|---|---|---|---|---|---|
| 2136 Dayton Ln Grand Prairie, TX | 4.0 | 2.5 | 2313 | $7,900 | $3.42 | 43d | 1 | 0.18mi |
| 2136 Dayton Ln Unit 1019626P Grand Prairie, TX | 4.0 | 2.5 | 2303 | $12,424 | $5.39 | 21d | 1 | 0.18mi |
| 3705 Pierce Ln Grand Prairie, TX | 3.0 | 2.5 | 1819 | $3,000 | $1.65 | 24d | 1 | 0.40mi |
| 3740 Pierce Ln Grand Prairie, TX | 4.0 | 3.5 | 2100 | $3,300 | $1.57 | 43d | 1 | 0.41mi |
| 2468 Ranchview Dr Grand Prairie, TX | 3.0 | 2.0 | 2200 | $3,000 | $1.36 | 43d | 1 | 0.45mi |
| 2410 Lost Mesa Grand Prairie, TX | 4.0 | 2.0 | 2220 | $2,900 | $1.31 | 43d | 1 | 0.58mi |
| 2504 Frontier Dr Grand Prairie, TX | 4.0 | 2.5 | 2541 | $2,820 | $1.11 | 43d | 1 | 0.64mi |
| 2361 Shirecreek Cir Grand Prairie, TX | 4.0 | 2.5 | 2588 | $2,675 | $1.03 | 43d | 1 | 0.72mi |
| 854 Timberdale St Grand Prairie, TX | 3.0 | 2.0 | 1612 | $2,200 | $1.36 | 43d | 1 | 0.90mi |
| 3156 Pine Valley Dr Grand Prairie, TX | 4.0 | 2.5 | 2301 | $2,760 | $1.20 | 6d | 1 | 0.91mi |
| 4105 Devon Ct Grand Prairie, TX | 3.0 | 3.0 | 1973 | $1,100 | $0.56 | 43d | 1 | 0.97mi |
| 819 Over Ridge Dr Grand Prairie, TX | 4.0 | 2.5 | 2046 | $2,500 | $1.22 | 20d | 1 | 1.13mi |
| 2510 Bentley Dr Grand Prairie, TX | 4.0 | 2.0 | 1638 | $2,211 | $1.35 | 43d | 1 | 1.25mi |
| 618 Thornwood Trl Grand Prairie, TX | 4.0 | 2.0 | 1803 | $2,465 | $1.37 | 1d | 1 | 1.29mi |
| 4255 Fall Creek Dr Grand Prairie, TX | 3.0 | 2.0 | 2264 | $2,600 | $1.15 | 43d | 1 | 1.32mi |
| 2645 Danberry Ln Grand Prairie, TX | 4.0 | 2.0 | 1595 | $2,219 | $1.39 | 19d | 1 | 1.35mi |
| 860 Roaring Springs Rd Grand Prairie, TX | 3.0 | 2.5 | 2857 | $2,716 | $0.95 | 24d | 1 | 1.35mi |
| 3914 Willowood Ln Grand Prairie, TX | 3.0 | 2.0 | 1963 | $2,519 | $1.28 | 7d | 1 | 1.37mi |
| 2661 Claremont Dr Grand Prairie, TX | 3.0 | 2.0 | 1841 | $1,985 | $1.08 | 24d | 1 | 1.45mi |
| 2661 Claremont Dr Grand Prairie, TX | 3.0 | 2.0 | 1841 | $2,106 | $1.14 | 43d | 1 | 1.45mi |
| 2901 W Bardin Rd Grand Prairie, TX | 3.0–4.0 | 2.5 | 1703 | $3,224 | $1.89 | 1d | 6 | 1.46mi |
| 2901 Bardin Rd Unit 19443 Grand Prairie, TX | 3.0 | 2.5 | 1634 | $2,000 | $1.22 | 4d | 1 | 1.48mi |
HOA detail
- Monthly dues
- $67 · $804/yr
- Likely covers
- landscaping
Listing history 3 events
-
2026-04-20status Pending
-
2026-03-10price $480,990
-
2026-03-06$478,990 Active
ⓘ Source: listings_history table (triggers on properties + properties_extension) + one-shot
backfill from property_details.listing_events for pre-trigger history.
Nearby sold comps map
Loading sold comps map…
Walkable amenities ~0.75 mi
Loading nearby amenities…
Taxation est. · year 1
- Rental income
- $32,391
- − Mortgage interest
- −$26,943
- − Property taxes
- −$7,215
- − Insurance
- −$2,405
- − Repairs & maintenance
- −$2,591
- − Management
- −$2,591
- − HOA
- −$804
- − Depreciation
- −$13,992
- Taxable loss
- −$24,151
- Est. tax savings @ 24.0%
- +$5,796
- After-tax cash flow
- $-9,307/yr
For passive investors: Depreciation is non-cash, so a rental often shows a tax loss while cash-flowing — sheltering income. Rental losses are passive: they offset passive income freely, and up to $25,000/yr can offset ordinary (W-2) income if you actively participate and your MAGI is under $100k (phasing out to $0 by $150k); unused losses carry forward. On sale, claimed depreciation is recaptured at up to 25%, and gains may owe capital-gains tax (a 1031 exchange can defer both). Figures are a year-1 estimate at your 24.0% rate — not tax advice; consult a CPA.
Schools (NCES district)
- District
- Grand Prairie ISD
- NCES district ID
- 4821420
- Math proficiency
- 29% ▼ -21.00%
- Reading proficiency
- 35% ▼ -8.00%
- Median HH income
- $51,094
- Composite
- 27.95/100
- National rank
- #6861
- State rank
- #572 of 826 in TX
Livability — Grand Prairie
- Score
- 80/100
- State rank
- #33
- US rank
- #1660
Category grades
Schools grade is shown separately in the Schools card above.
Census & demographics
- Census place
- Grand Prairie, TX
- County
- Dallas County · 2,612,404 people
- City population
- 201,439
- Metro
- Dallas-Fort Worth-Arlington, TX
- Population (ZIP)
- 97,278
- Household income
- $89,301
- Rent vs Own
- Severe rent burden
- 3118.0
Population outlook (Dallas County) Hauer SSP2
- Today (2025)
- 2,979,839 people
- By 2030
- 3,191,823 · +7.1%
- By 2040
- 3,619,611 · +21.5%
- By 2050
- 4,026,915 · +35.1%
- By 2075
- 4,957,073 · +66.4%
- By 2100
- 5,508,725 · +84.9%
Race, ethnicity, and origin ACS 2023
- Neighborhood character
- Highly diverse neighborhood (Simpson 0.71)
- Race & ethnicity
- Hispanic / Latino 39% Black 29% White 19% Two or more races 16% Asian 9%
- Hispanic origin (detail)
- Mexican 31% Puerto Rican 1%
- Common ancestry
- Slovak 1% Lithuanian 1% Italian 1%
- Foreign-born
- 21% · Canada, Vietnam, China
- Languages at home
- 62% English-only · Spanish 27% Vietnamese 4% Chinese 1%
Political lean MEDSL · Dallas
- 2024 margin
- Strong D (+22.2) · D 60.2% · R 38.0% · Other 1.8%
- 2008→2024 swing
- +6.9pp toward D · 2008: 15.3pp · 2024: 22.2pp
- All cycles
- 2024: D+22.2 2020: D+31.6 2016: D+26.2 2012: D+15.4 2008: D+15.3
Not yet ingested
- Civics
- —
Market trends
- HPI YoY
- ▼ -103.08%
- Current HPI
- 289.3711
- Rent YoY
- ▲ 0.08%
- Metro
- Dallas-Fort Worth-Arlington, TX
- State GDP YoY
- ▲ 3.95%
- F500 in state
- 110
Industry mix (Fortune 500 HQ in TX)
| Industry | F500 HQs | Revenue |
|---|---|---|
| Energy | 16 | $1,198B |
|
||
| Technology | 5 | $198B |
|
||
| Engineering / Construction | 4 | $72B |
|
||
| Energy Services | 3 | $60B |
|
||
| Utilities | 3 | $41B |
|
||
| Healthcare | 2 | $330B |
|
||
Price history
+0.4% since first listed3 events — show timeline
- 2026-04-20 Pending — NTREIS
- 2026-03-10 Price Changed $480,990 NTREIS
- 2026-03-06 Listed $478,990 NTREIS
Cash-flow waterfall
monthlySold comps — $/sqft
last 12 mo · ≤1 miLoading sold comps…