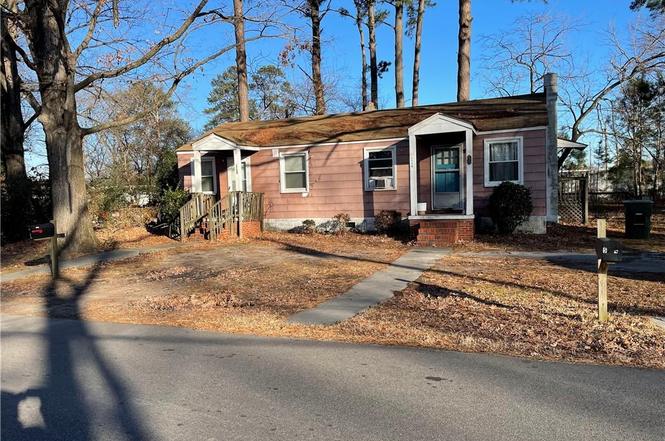
 Duplex
5642 Brickell Rd · Norfolk, VA
Flood risk 1/10 · Minimal
- FEMA flood zone
- X (unshaded)
- Chance of flooding over 30 yrs
- 0.0%
- Est. flood insurance / yr
- $507 – $1,088
Fire risk 1/10 · Minimal
- Est. fire insurance / yr
- $666 – $1,236
Heat risk 9/10 · Severe
- Hot days now (above 106°F)
- 7 days/yr
- Hot days in 30 yrs
- 16 days/yr
Wind risk 8/10 · Major
- Chance of severe wind over 30 yrs
- 80.0%
Air-quality risk 3/10 · Minor
- Unhealthy air days now
- 2 days/yr
- Unhealthy air days in 30 yrs
- 3 days/yr
Risk factors via First Street. Map © Google.
Why this score? — see what drove the B- grade
The composite is a weighted blend of 9 inputs, each scored 0–100. Each bar is that input's sub-score; the figure is the points it added to the 100-point composite (weight × sub-score).
- Cash flow +30.0/30.0
- DSCR +10.0/10.0
- 1% rule +8.2/10.0
- ARV discount +5.8/15.0
- Rent growth +5.0/5.0
- Livability +4.2/5.0
- Schools +3.5/10.0
- Condition / age +2.5/5.0
- Appreciation +0.0/10.0
$199,900
🖨 Deal sheet 📄 Offer letter ✓ Due diligence
Multi-family units
County records classify this as Multi-Family (2-4 Unit). Listing-text estimate: 2 units. confirmed
Listing remarks
Excellent duplex opportunity offering strong rental income and long-term stability. This property features two separate units with established long-term tenants, providing immediate cash flow for investors. Great for those seeking a low-maintenance income-producing property in a high-demand rental area. For owner-occupants, this is a fantastic house-hacking opportunity—live in one unit while renting out the other to offset your mortgage and build equity. Each unit offers private living spaces, making it suitable for both personal use and rental flexibility. Conveniently located near Military Circle Mall and Janaf Shopping Center with easy access to shopping, dining, major roadways, an
Key facts
- Long-term tenants
- Two separate units
- Duplex opportunity
Tags
Neighborhood map
What this means for you Summary
Snapshot
- This is a 2 × 2-bed/2.0-bath units multifamily listed at $200k.
Deal economics
- At list price, monthly cash flow is $761 ($9k/yr) — positive. Per door: $380/mo.
- The deal already cash-flows at list — no discount required.
- Meets the 1% rule at list price ($3k rent vs $200k).
- Cap rate 10.9% vs local median 4.0% in Norfolk — top-decile yield for the area; either an underpriced asset or a hidden risk that comps aren't pricing in. Stress-test before assuming the spread holds.
Location & tenants
- Location reads 83/100 on livability (#43 in VA, #1,026 nationally) — a professional / high-income tenant draw. Strengths: amenities A+, commute A+, health & safety A+; Watch: employment C-, crime F.
- Norfolk City Public School District (urban): math 27% / reading 56% proficiency, ranked #118 of 131 in VA (top 90%) — families likely to look elsewhere, expect single-tenant / working-renter base with shorter leases.
- Zoned schools: Lake Taylor (math 22% / reading 45%, grade F, #984 of 1,108 statewide, top 89%, 626 students, 96% FRL); Booker T Washington High (math 26% / reading 70%, grade D, #303 of 319 statewide, top 95%, 947 students, 94% FRL) — zoned schools average 95% FRL vs 59% district-wide (36 pts higher); higher-poverty schools than district average — tighter screening recommended.
- Market conditions: Rents rising fast (+15.1%/yr); 76 active listings in the ZIP; 20 comparable units currently listed for rent nearby; rentals at typical pace (median 20d on market — plan ~3-4 weeks tenant-placement turnaround); 438 units permitted in Norfolk city in 2024 (273 in 5+ unit buildings).
- At $2,635/mo this rent would consume 50% of the median local household income ($63k/yr) (locally 1255% of renters already pay >50% of income on rent) — very limited rent-growth headroom before tenants either downsize or default.
Forward outlook
- Local home prices are declining (-3.0%/yr); year-one equity from $1k of loan paydown is wiped out by about $6k of value loss. Plan a longer hold.
- At projected returns (-3.0% appreciation + 8.0% rent growth), your $56k cash investment doubles in ~6 years — after that, you're playing with house money.
Negotiation context
- Only 6 days on market — expect competitive offers; lowballing is unlikely to land.
- 4 sale attempts since 7y ago with the ask held roughly flat each time — persistent listings suggest the price (not the market) is what's stuck; bring a comps-based counter.
- Current owner paid $155k; 29% above their basis — modest negotiation headroom, anchor on the comps not their cost.
Risks & watch-outs
- Watch-outs: built in 1955 — expect roof / HVAC / electrical / plumbing capex.
- Climate carrying-cost: severe wind risk, 80% chance of damaging wind over 30y; extreme-heat days projected 7→16/yr by 2055 (HVAC capex compounding) — expect insurance premiums to compound above CPI over the hold.
Questions for the listing agent
- Can we see the unit-by-unit rent roll, current vacancy, and any below-market leases? What's the average tenancy length?
- What capital expenditures (roof, boiler, parking lot, exteriors) have been made in the last 5 years, and what's planned in the next 2?
- Built in 1955 — when were the roof, HVAC, electrical panel, plumbing, and water heater last replaced?
- Is there a deadline driving the sale (1031 exchange, divorce, estate, relocation)? That informs how much negotiation room exists.
- Schools are A-rated — typically a magnet for longer-tenancy family renters. What's the average tenant stay here, and is there a school-zone premium baked into asking?
- Crime grade is F in this area — have there been break-ins, vandalism, or insurance claims at this property in the last 3 years? What carrier currently insures it and at what premium?
- What's the average days-on-market for RENTAL listings here right now (not sales)? A rising rental-DOM trend means longer vacancies and softer asking-rent achievability than the comps imply.
- What's the recent tenant-quality profile in this submarket — average credit score on applications, eviction rate, late-payment / NSF rate, and stable-employment percentage? A property-management company in the area should have these aggregated.
- How much new apartment / multifamily construction is in the pipeline within 1–3 miles? Heavy new supply (>2% of stock underway) typically softens rents 12–24 months out; light construction supports rent growth.
Investment metrics
- 1% rule
- 1.32% ✓
- Cap rate
- 10.86%
- Cash-on-cash
- 16.31%
- DSCR
- 1.73
- GRM
- 6.3
CMA / ARV
- ARV (on-the-fly)
- $192,512
- Comps found
- 1
Show comp detail 1 sale within ~0.75 mi
| Address | Dist | Beds/Ba | Sqft | Sold | Price | $/sf | Match |
|---|---|---|---|---|---|---|---|
| 5642 Brickell Rd | 0.00mi | 2/2.0 | 1,000 (-2%) | 2mo | $187,500 | $188 | 95 |
Match score weights: distance 35% · size 25% · config 20% · recency 20%. Top-matched comps best support the ARV.
Projected returns pro-forma
-3.0% appreciation · 8.0% rent growth · sell at horizon
- IRR
- 12.7%
- Equity multiple
- 1.54×
- Total profit
- $29,994
- Equity at exit
- $29,806
- IRR
- 25.2%
- Equity multiple
- 3.71×
- Total profit
- $151,907
- Equity at exit
- $17,284
Cash invested: $55,972 (down + closing). Projections, not guarantees.
Landlord ↔ Tenant lean methodology
- Overall (STATE)
- 55 Moderately Landlord-Leaning
- State Virginia
- 55 Moderately Landlord-Leaning · D+2
- County
- — inherits STATE
- City
- — inherits STATE
ZIP-level market 23502
- Home prices YoY
- -20.7%
- Rents YoY
- 15.1%
- Active inventory
- 76
- Price-to-rent
- 12.6×
Monthly cashflow live
- Estimated rent
- $2,635 high interval (Pro) →
- Mortgage (P&I)
- −$1,048
- Tax from tax record
- −$189 /mo · $2,271/yr
- Insurance
- −$83
- HOA
- −$0
- Vacancy / Maint / Mgmt
- −$553
- Net cashflow
- $761
Break-even live
2-unit breakdown (identical units grouped — click to expand)
| Units | Beds | Baths | Est. rent |
|---|---|---|---|
| 2× units | 2 | 2 | $2,636 |
| #1 | 2 | 2 | $1,318 |
| #2 | 2 | 2 | $1,318 |
| Total (2 units) | $2,635 | ||
UW: 25.0% down · 7.5% · 30yr · 1.5% tax · 5.0% vac · 8.0% maint · 8.0% mgmt
Financing live
Cash to close
- Down payment
- $49,975
- Closing costs
- $5,997
- Reserves months
- —
- Total cash needed
- —
Loan-product check · same deal, 3 products live
Conventional
25% down · 7.5% · 30yr
- Down + closing
- —
- Monthly P&I
- —
- Monthly cashflow
- —
- DSCR
- —
- Eligible?
- —
Personal DTI + credit; lowest rate.
DSCR
20% down · 8.5% · 30yr
- Down + closing
- —
- Monthly P&I
- —
- Monthly cashflow
- —
- DSCR
- —
- Eligible?
- —
No personal income docs; deal must DSCR.
Hard money
10% down · 12.0% · 12mo
- Down + closing
- —
- Monthly P&I
- —
- Monthly cashflow
- —
- DSCR
- —
- Eligible?
- —
Short-term bridge; refi at stabilization.
Rent comps 20 comps
| Address | Beds | Baths | Sqft | Rent | $/sqft | DOM | Units | Dist |
|---|---|---|---|---|---|---|---|---|
| 5667 Brickell Rd Unit 14 Norfolk, VA | 1.0 | 1.0 | 700 | $995 | $1.42 | 3d | 1 | 0.05mi |
| 516 Hicks Ave Unit A Norfolk, VA | 2.0 | 2.0 | 810 | $1,585 | $1.96 | 43d | 1 | 0.70mi |
| 1060 Kempsville Rd Unit 00 08107 Norfolk, VA | 3.0 | 2.0 | 1383 | $2,479 | $1.79 | 12d | 1 | 0.93mi |
| 1060 Kempsville Rd Apt 10305 Norfolk, VA | 2.0 | 2.0 | 975 | $2,142 | $2.20 | 7d | 1 | 0.93mi |
| 1060 Kempsville Rd Unit 00 09212 Norfolk, VA | 2.0 | 2.0 | 1002 | $2,370 | $2.37 | 43d | 1 | 0.93mi |
| 1060 Kempsville Rd Norfolk, VA | 2.0 | 2.0 | 1149 | $2,400 | $2.09 | 19d | 1 | 0.99mi |
| 1060 Kempsville Rd Norfolk, VA | 1.0 | 1.0 | 723 | $1,775 | $2.46 | 20d | 1 | 0.99mi |
| 1060 Kempsville Rd Norfolk, VA | 3.0 | 2.0 | 1425 | $2,975 | $2.09 | 11d | 1 | 0.99mi |
| 1060 Kempsville Rd Norfolk, VA | 1.0 | 1.0 | 914 | $2,250 | $2.46 | 16d | 1 | 0.99mi |
| 1060 Kempsville Rd Norfolk, VA | 2.0 | 2.0 | 1070 | $2,400 | $2.24 | 44d | 1 | 0.99mi |
| 1060 Kempsville Rd Norfolk, VA | 2.0 | 2.0 | 1218 | $2,400 | $1.97 | 23d | 1 | 0.99mi |
| 5249 Curlew Dr Norfolk, VA | 1.0 | 1.0 | 800 | $1,075 | $1.34 | 44d | 1 | 1.04mi |
| 6163 Kempsville Cir Norfolk, VA | 1.0–3.0 | 1.0–2.0 | 1120 | $2,523 | $2.25 | 1d | 12 | 1.04mi |
| 1323 W Norcova Dr Norfolk, VA | 3.0 | 1.0 | 1410 | $2,500 | $1.77 | 43d | 1 | 1.05mi |
| 5214 Revere Dr Unit REV5214A-EA Norfolk, VA | 2.0 | 1.0 | 900 | $1,250 | $1.39 | 43d | 1 | 1.07mi |
| 1371 E Norcova Dr Norfolk, VA | 2.0 | 1.0 | 967 | $1,750 | $1.81 | 7d | 1 | 1.11mi |
| 1445 Norcova Ave Apt E Norfolk, VA | 2.0 | 1.0 | 750 | $1,125 | $1.50 | 43d | 1 | 1.32mi |
| 4852 E Princess Anne Rd Norfolk, VA | 1.0 | 1.0 | 700 | $1,099 | $1.57 | 17d | 1 | 1.37mi |
| 1562 Norcova Ave Norfolk, VA | 3.0 | 1.0 | 1288 | $2,000 | $1.55 | 17d | 1 | 1.49mi |
| 4670 Kincaid Ave Apt E Norfolk, VA | 2.0 | 1.0 | 800 | $1,250 | $1.56 | 2d | 1 | 1.50mi |
Listing history 9 events
-
2026-02-04status Under Contract
-
2026-01-29$199,900 Active
-
2023-10-23soldstatus $155,000
-
2023-10-03status Under Contract
-
2023-09-27$119,000 Active
-
2019-09-30soldstatus $70,000
-
2019-09-12status Under Contract
-
2019-09-12Active Under Contract
-
2019-08-19$85,000
ⓘ Source: listings_history table (triggers on properties + properties_extension) + one-shot
backfill from property_details.listing_events for pre-trigger history.
Tax reassessment forecast VA · Resets to sale price
- Current annual tax
- $2,271 · $189/mo
- Projected year-2 tax
- $2,271 · $189/mo
- Expected delta
- $0/yr ($0/mo · 0.0%)
ⓘ Screening estimate from a state-policy table — verify with the county assessor before closing.
Climate risk First Street
- Flood 1/10 Low FEMA zone X (unshaded) · 0% chance over 30 yrs
- Wildfire 1/10 Low
- Heat 9/10 Extreme 7 d/yr ≥106°F today · 16 d/yr by 30 yrs out
- Wind 8/10 Severe 80% chance of damaging wind over 30 yrs
- Air quality 3/10 Moderate 2 unhealthy d/yr today · 3 by 30 yrs out
Nearby sold comps map
Loading sold comps map…
Walkable amenities ~0.75 mi
Loading nearby amenities…
Taxation est. · year 1
- Rental income
- $31,620
- − Mortgage interest
- −$11,198
- − Property taxes
- −$2,271
- − Insurance
- −$1,000
- − Repairs & maintenance
- −$2,530
- − Management
- −$2,530
- − Depreciation
- −$5,815
- Taxable income
- $6,278
- Est. tax owed @ 24.0%
- −$1,507
- After-tax cash flow
- $7,623/yr
For passive investors: Depreciation is non-cash, so a rental often shows a tax loss while cash-flowing — sheltering income. Rental losses are passive: they offset passive income freely, and up to $25,000/yr can offset ordinary (W-2) income if you actively participate and your MAGI is under $100k (phasing out to $0 by $150k); unused losses carry forward. On sale, claimed depreciation is recaptured at up to 25%, and gains may owe capital-gains tax (a 1031 exchange can defer both). Figures are a year-1 estimate at your 24.0% rate — not tax advice; consult a CPA.
Schools (NCES district)
- District
- Norfolk City Public School District
- NCES district ID
- 5102670
- Math proficiency
- 27% ▼ -44.00%
- Reading proficiency
- 56% ▼ -10.00%
- Median HH income
- $44,358
- Composite
- 35.08/100
- National rank
- #5026
- State rank
- #118 of 131 in VA
Livability — Norfolk
- Score
- 83/100
- State rank
- #43
- US rank
- #1026
Category grades
Schools grade is shown separately in the Schools card above.
Census & demographics
- Census place
- Norfolk, VA
- County
- Norfolk City · 214,042 people
- City population
- 214,042
- Metro
- Virginia Beach-Norfolk-Newport News, VA-NC
- Population (ZIP)
- 20,399
- Household income
- $63,208
- Rent vs Own
- Severe rent burden
- 1255.0
Population outlook (Norfolk County) Hauer SSP2
- Today (2025)
- 249,032 people
- By 2030
- 252,347 · +1.3%
- By 2040
- 253,644 · +1.9%
- By 2050
- 251,913 · +1.2%
- By 2075
- 245,281 · -1.5%
- By 2100
- 219,548 · -11.8%
Race, ethnicity, and origin ACS 2023
- Neighborhood character
- Diverse neighborhood (Simpson 0.67)
- Race & ethnicity
- Black 46% White 31% Hispanic / Latino 12% Two or more races 9% Asian 4%
- Hispanic origin (detail)
- Mexican 4% Puerto Rican 2% Dominican 2%
- Common ancestry
- Portuguese 1% Romanian 1% Slovak 1%
- Foreign-born
- 9% · Canada, Jamaica
- Languages at home
- 88% English-only · Spanish 6% Tagalog/Filipino 3% Other Indo-European 1%
Political lean MEDSL · Norfolk
- 2024 margin
- Solid D (+41.5) · D 70.0% · R 28.5% · Other 1.6%
- 2008→2024 swing
- -1.4pp toward R · 2008: 43.0pp · 2024: 41.5pp
- All cycles
- 2024: D+41.5 2020: D+45.6 2016: D+42.0 2012: D+44.0 2008: D+43.0
Not yet ingested
- Civics
- —
Market trends
- HPI YoY
- ▼ -83.50%
- Current HPI
- 320.4522
- Rent YoY
- ▲ 15.10%
- Metro
- Virginia Beach-Norfolk-Newport News, VA-NC
- State GDP YoY
- ▲ 2.40%
- F500 in state
- 50
Industry mix (Fortune 500 HQ in VA)
| Industry | F500 HQs | Revenue |
|---|---|---|
| Aerospace / Defense | 4 | $236B |
|
||
| Technology / Defense | 3 | $32B |
|
||
| Financial Services | 2 | $176B |
|
||
| Utilities | 2 | $27B |
|
||
| Insurance | 2 | $25B |
|
||
| Technology | 2 | $15B |
|
||
Price history
+135.2% since first listed9 events — show timeline
- 2026-02-04 Pending — REINMLS
- 2026-01-29 Listed $199,900 REINMLS
- 2023-10-23 Sold (Public Records) $155,000 Public Records
- 2023-10-03 Pending — REINMLS
- 2023-09-27 Listed $119,000 REINMLS
- 2019-09-30 Sold (Public Records) $70,000 Public Records
- 2019-09-12 Pending — REINMLS
- 2019-09-12 Listed — REINMLS
- 2019-08-19 Listed $85,000 REINMLS
Property tax history
+4.6%/yrLatest (2025): $2,271 · +8.7% YoY. Source: county tax records.
Cash-flow waterfall
monthlySold comps — $/sqft
last 12 mo · ≤1 miLoading sold comps…