23012 Homestead Rd · Anchorage, AK
Flood risk 1/10 · Minimal
- FEMA flood zone
- X (unshaded)
- Chance of flooding over 30 yrs
- 0.0%
- Est. flood insurance / yr
- $507 – $1,088
Fire risk No data
- Est. fire insurance / yr
- —
Heat risk No data
- Hot days now (above threshold)
- —
- Hot days in 30 yrs
- —
Wind risk No data
- Chance of severe wind over 30 yrs
- —
Air-quality risk 1/10 · Minimal
- Unhealthy air days now
- —
- Unhealthy air days in 30 yrs
- —
Risk factors via First Street. Map © Google.
Why this score? — see what drove the C grade
The composite is a weighted blend of 9 inputs, each scored 0–100. Each bar is that input's sub-score; the figure is the points it added to the 100-point composite (weight × sub-score).
- Cash flow +20.5/30.0
- ARV discount +15.0/15.0
- DSCR +6.5/10.0
- 1% rule +5.1/10.0
- Livability +3.9/5.0
- Schools +3.7/10.0
- Rent growth +2.5/5.0
- Condition / age +2.5/5.0
- Appreciation +0.0/10.0
$417,000
🖨 Deal sheet 📄 Offer letter ✓ Due diligence
Listing remarks
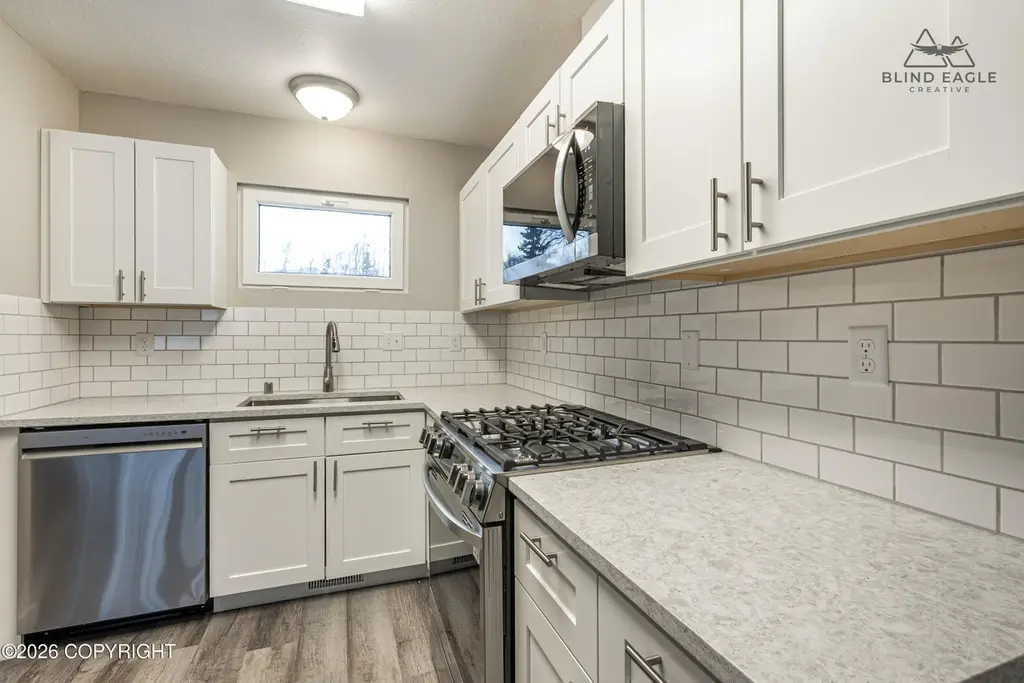
Closing cost credits may be available for owner occupant! Located near JBER, this ranch home is conveniently located for military personnel or a quick commute into Anchorage or the Valley for civilians! This home is extremely functional with 3 bedrooms, 1 bathroom, a huge bonus room, laundry room, and lots of storage! This is a Fannie Mae Homepath Property. Offers must be submitted @homepath.com An extensive remodel has just been completed and the home is in pristine condition! In addition to cosmetic upgrades, this property has a new roof, new furnaces/water heater, new appliances, new partial foundation, new windows, and fresh interior/exterior paint. This property is rounded out with a
Key facts
- Huge bonus room
- Lots of storage
- Extensive remodel
Tags
Neighborhood map
What this means for you Summary
Snapshot
- This is a 3-bed/1.0-bath single-family listed at $417k.
Deal economics
- At list price, monthly cash flow is $549 ($7k/yr) — positive.
- The deal already cash-flows at list — no discount required.
- Meets the 1% rule at list price ($4k rent vs $417k).
- Recommended offer: $379k (9.0% below list) — sets the bar for market timing.
- Cap rate 7.9% vs local median 3.8% in Anchorage — top-decile yield for the area; either an underpriced asset or a hidden risk that comps aren't pricing in. Stress-test before assuming the spread holds.
Location & tenants
- Location reads 78/100 on livability (#6 in AK, #2,553 nationally) — a middle-class / working-renter tenant base. Strengths: amenities A+, commute A+, employment A+; Watch: crime F, cost of living F.
- Anchorage School District (urban): math 37% / reading 43% proficiency, ranked #6 of 21 in AK (top 29%) — families likely to look elsewhere, expect single-tenant / working-renter base with shorter leases.
- Market conditions: 93 active listings in the ZIP; 1 comparable units currently listed for rent nearby; 306 units permitted in Anchorage Municipality in 2024 (90 in 5+ unit buildings).
Forward outlook
- Local home prices are declining (-3.0%/yr); year-one equity from $3k of loan paydown is wiped out by about $13k of value loss. Plan a longer hold.
- Anchorage County population projected at +12% by 2050 — modest demand growth; plan on rents tracking national, not racing it.
Negotiation context
- It's been on market 113 days — a 9% lower offer ($379k) is reasonable based on typical stale-listing flexibility.
- 6 sale attempts since 22y ago; this cycle's ask has dropped $48k (10%) from the opening price — seller is motivated, your offer sets the floor, not the list.
Questions for the listing agent
- It's been on market 113 days. Have you received any prior offers? Is the seller open to a 9% concession, seller financing, or rate buy-down credit?
- Why hasn't it sold? Are there any deal-killer items the seller is aware of (foundation, flood, title, zoning, code violations)?
- Is there a deadline driving the sale (1031 exchange, divorce, estate, relocation)? That informs how much negotiation room exists.
- Schools are B-rated — typically a magnet for longer-tenancy family renters. What's the average tenant stay here, and is there a school-zone premium baked into asking?
- Crime grade is F in this area — have there been break-ins, vandalism, or insurance claims at this property in the last 3 years? What carrier currently insures it and at what premium?
- What's the average days-on-market for RENTAL listings here right now (not sales)? A rising rental-DOM trend means longer vacancies and softer asking-rent achievability than the comps imply.
- What's the recent tenant-quality profile in this submarket — average credit score on applications, eviction rate, late-payment / NSF rate, and stable-employment percentage? A property-management company in the area should have these aggregated.
- How much new for-sale + rental construction is in the pipeline within 1–3 miles? Heavy new supply typically softens prices + rents 12–24 months out; constrained supply supports both.
Investment metrics
- 1% rule
- 1.01% ✓
- Cap rate
- 7.87%
- Cash-on-cash
- 5.64%
- DSCR
- 1.25
- GRM
- 8.3
CMA / ARV
- ARV (median comp)
- $508,663
- List price
- $417,000
- Delta
- -18.02%
- Verdict
- UNDERPRICED
- Comps
- 20 within 1.0 mi
Show comp detail 12 sales within ~0.75 mi
| Address | Dist | Beds/Ba | Sqft | Sold | Price | $/sf | Match |
|---|---|---|---|---|---|---|---|
| 20880 Oberg Rd | 0.32mi | 3/2.0 | 1,920 (+1%) | 1mo | $425,000 | $221 | 79 |
| 22909 Green Garden Dr | 0.32mi | 3/2.5 | 1,959 (+3%) | 10mo | $528,000 | $270 | 65 |
| 22471 Centurion Dr | 0.34mi | 3/2.5 | 1,828 (-4%) | 10mo | $467,900 | $256 | 64 |
| 22479 Centurion Dr | 0.33mi | 3/2.0 | 1,772 (-7%) | 10mo | $485,000 | $274 | 61 |
| 22839 Northwoods Dr | 0.49mi | 3/2.5 | 1,900 (+0%) | 13mo | $470,000 | $247 | 60 |
| 23105 Green Garden Dr | 0.40mi | 3/2.0 | 1,760 (-7%) | 7mo | $429,000 | $244 | 60 |
| 23234 Northwoods Dr | 0.65mi | 4/3.0 (+1) | 2,036 (+7%) | 2mo | $589,900 | $290 | 43 |
| 23070 Sheltering Spruce Ave | 0.45mi | 3/2.0 | 2,088 (+10%) | 22mo | $650,000 | $311 | 40 |
| 20903 Chickadee St | 0.61mi | 3/2.0 | 2,057 (+8%) | 19mo | $449,900 | $219 | 37 |
| 22747 Mc Manus Dr | 0.60mi | 3/2.5 | 1,740 (-8%) | 20mo | $479,000 | $275 | 36 |
| 21964 Deer Park Dr | 0.69mi | 4/2.0 (+1) | 1,796 (-5%) | 20mo | $447,000 | $249 | 33 |
| 22115 Oberg Rd | 0.67mi | 4/2.5 (+1) | 2,142 (+13%) | 19mo | $580,000 | $271 | 20 |
Match score weights: distance 35% · size 25% · config 20% · recency 20%. Top-matched comps best support the ARV.
Projected returns pro-forma
-3.0% appreciation · 3.0% rent growth · sell at horizon
- IRR
- -7.6%
- Equity multiple
- 0.72×
- Total profit
- $-32,621
- Equity at exit
- $62,176
- IRR
- 2.0%
- Equity multiple
- 1.14×
- Total profit
- $16,584
- Equity at exit
- $36,055
Cash invested: $116,760 (down + closing). Projections, not guarantees.
Landlord ↔ Tenant lean methodology
- Overall (STATE)
- 80 Strongly Landlord-Friendly
- State Alaska
- 80 Strongly Landlord-Friendly · R+8
- County
- — inherits STATE
- City
- — inherits STATE
ZIP-level market 99567
- Home prices YoY
- -4.7%
- Active inventory
- 93
- Price-to-rent
- 8.3×
Monthly cashflow live
- Estimated rent
- $4,200 medium interval (Pro) →
- Mortgage (P&I)
- −$2,187
- Tax from tax record
- −$409 /mo · $4,903/yr
- Insurance
- −$174
- HOA
- −$0
- Vacancy / Maint / Mgmt
- −$882
- Net cashflow
- $549
Break-even live
UW: 25.0% down · 7.5% · 30yr · 1.5% tax · 5.0% vac · 8.0% maint · 8.0% mgmt
Financing live
Cash to close
- Down payment
- $104,250
- Closing costs
- $12,510
- Reserves months
- —
- Total cash needed
- —
Loan-product check · same deal, 3 products live
Conventional
25% down · 7.5% · 30yr
- Down + closing
- —
- Monthly P&I
- —
- Monthly cashflow
- —
- DSCR
- —
- Eligible?
- —
Personal DTI + credit; lowest rate.
DSCR
20% down · 8.5% · 30yr
- Down + closing
- —
- Monthly P&I
- —
- Monthly cashflow
- —
- DSCR
- —
- Eligible?
- —
No personal income docs; deal must DSCR.
Hard money
10% down · 12.0% · 12mo
- Down + closing
- —
- Monthly P&I
- —
- Monthly cashflow
- —
- DSCR
- —
- Eligible?
- —
Short-term bridge; refi at stabilization.
Rent comps 1 comps
| Address | Beds | Baths | Sqft | Rent | $/sqft | DOM | Units | Dist |
|---|---|---|---|---|---|---|---|---|
| 19452 Sullins Dr Chugiak, AK | 4.0 | 2.5 | 2617 | $4,200 | $1.60 | 43d | 1 | 1.39mi |
Listing history 24 events
-
2026-06-10days on market $417,000 Active 113 DOM
-
2026-06-09days on market $417,000 Active 112 DOM
-
2026-06-08days on market $417,000 Active 111 DOM
-
2026-06-07days on market $417,000 Active 110 DOM
-
2026-06-03days on market $417,000 Active 106 DOM
-
2026-06-02days on market $417,000 Active 105 DOM
-
2026-06-01days on market $417,000 Active 104 DOM
-
2026-05-31days on market $417,000 Active 103 DOM
-
2026-05-30days on market $417,000 Active 102 DOM
-
2026-05-05price $424,900
-
2026-04-25status Active
-
2026-04-14status Pending
-
2026-04-07status Active
-
2026-04-04price $434,900
-
2026-02-28price $444,900
-
2026-01-29price $454,900
-
2026-01-05$464,900 Active
-
2023-04-14soldstatus
-
2008-12-19soldstatus
-
2008-05-22$219,500
-
2004-10-06soldstatus
-
2004-09-07$199,900
-
2004-07-08$205,000
-
1999-06-01soldstatus
ⓘ Source: listings_history table (triggers on properties + properties_extension) + one-shot
backfill from property_details.listing_events for pre-trigger history.
Tax reassessment forecast AK · Partial reset (capped growth)
- Current annual tax
- $4,903 · $409/mo
- Projected year-2 tax
- $4,933 · $411/mo
- Expected delta
- +$30/yr (+$2/mo · 0.6%)
ⓘ Screening estimate from a state-policy table — verify with the county assessor before closing.
Climate risk First Street
- Flood 1/10 Low FEMA zone X (unshaded) · 0% chance over 30 yrs
- Air quality 1/10 Low
Nearby sold comps map
Loading sold comps map…
Walkable amenities ~0.75 mi
Loading nearby amenities…
Taxation est. · year 1
- Rental income
- $50,400
- − Mortgage interest
- −$23,358
- − Property taxes
- −$4,903
- − Insurance
- −$2,085
- − Repairs & maintenance
- −$4,032
- − Management
- −$4,032
- − Depreciation
- −$12,131
- Taxable loss
- −$142
- Est. tax savings @ 24.0%
- +$34
- After-tax cash flow
- $6,620/yr
For passive investors: Depreciation is non-cash, so a rental often shows a tax loss while cash-flowing — sheltering income. Rental losses are passive: they offset passive income freely, and up to $25,000/yr can offset ordinary (W-2) income if you actively participate and your MAGI is under $100k (phasing out to $0 by $150k); unused losses carry forward. On sale, claimed depreciation is recaptured at up to 25%, and gains may owe capital-gains tax (a 1031 exchange can defer both). Figures are a year-1 estimate at your 24.0% rate — not tax advice; consult a CPA.
Schools (NCES district)
- District
- Anchorage School District
- NCES district ID
- 0200180
- Math proficiency
- 37% ▼ -2.00%
- Reading proficiency
- 43% ▲ 1.00%
- Median HH income
- $76,447
- Composite
- 37.0/100
- National rank
- #4523
- State rank
- #6 of 21 in AK
Livability — Anchorage
- Score
- 78/100
- State rank
- #6
- US rank
- #2553
Category grades
Schools grade is shown separately in the Schools card above.
Census & demographics
- Census place
- Anchorage, AK
- City population
- 218,117
- Population (ZIP)
- 6,739
Population outlook (Anchorage County) Hauer SSP2
- Today (2025)
- 314,993 people
- By 2030
- 321,771 · +2.2%
- By 2040
- 335,493 · +6.5%
- By 2050
- 352,799 · +12.0%
- By 2075
- 414,771 · +31.7%
- By 2100
- 474,485 · +50.6%
Race, ethnicity, and origin ACS 2023
- Neighborhood character
- Predominantly White (82%)
- Race & ethnicity
- White 82% Hispanic / Latino 7% Two or more races 6% Native American 5% Pacific Islander 1%
- Hispanic origin (detail)
- Puerto Rican 1%
- Common ancestry
- Portuguese 4% Italian 3% Serbian 2%
- Foreign-born
- 2% · Canada
- Languages at home
- 95% English-only · Spanish 5% German/W. Germanic 1%
Political lean MEDSL · Anchorage
- 2024 margin
- D (+12.7) · D 56.3% · R 43.7%
- 2016→2024 swing
- +27.9pp toward D · 2016: -15.2pp · 2024: 12.7pp
- All cycles
- 2024: D+12.7 2016: R+15.2
Not yet ingested
- Civics
- —
Market trends
- HPI YoY
- ▼ -13.74%
- Current HPI
- 279.3784
- Rent YoY
- —
- Metro
- —
- State GDP YoY
- —
- F500 in state
- 0
Price history
+107.3% since first listed15 events — show timeline
- 2026-05-05 Price Changed $424,900 AKMLS
- 2026-04-25 Relisted — AKMLS
- 2026-04-14 Pending — AKMLS
- 2026-04-07 Relisted — AKMLS
- 2026-04-04 Price Changed $434,900 AKMLS
- 2026-02-28 Price Changed $444,900 AKMLS
- 2026-01-29 Price Changed $454,900 AKMLS
- 2026-01-05 Listed $464,900 AKMLS
- 2023-04-14 Sold (Public Records) — Public Records
- 2008-12-19 Sold (Public Records) — Public Records
- 2008-05-22 Listed $219,500 AKMLS
- 2004-10-06 Sold (Public Records) — Public Records
- 2004-09-07 Listed $199,900 AKMLS
- 2004-07-08 Listed $205,000 AKMLS
- 1999-06-01 Sold (Public Records) — Public Records
Property tax history
+2.7%/yrLatest (2025): $4,903 · +6.6% YoY. Source: county tax records.
Cash-flow waterfall
monthlySold comps — $/sqft
last 12 mo · ≤1 miLoading sold comps…